
Abstract
The majority of present day industrial processes/products are defined by several quality characteristics, for which the process variables need to be precisely modulated to meet the required specifications. Hence, the multi-response process optimization has become an increasingly important and demanding task. In practice, many of these quality characteristics under consideration show conflicts among themselves, which need to be simultaneously satisfied. This situation is aggravated when the quality characteristics show correlation. To remedy this shortfall, we present a novel multi-objective process optimization approach, based on weighted principal components (principal component scores weighted by their respective eigen values), response surface methodology and desirability function. The implementation of the suggested approach is presented on a study that discusses the optimization of light-colored and reduced phytate containing protein extraction process from rapeseed press-cake. The effectiveness of the said approach was confirmed by performing additional confirmatory experiments at the predicted optimal condition. Furthermore, this study suggests the feasibility of the exploitation of the waste oilseed cake for extraction of high quality vegetable protein, using viable process and simple computational procedure. This study also briefly highlights performance analyses in cross-flow batch extraction scheme using optimized condition.
INTRODUCTION
Multi-response optimization has become an increasingly important issue in complex industrial processes, particularly in situations where more than one correlated response must be assessed simultaneously. Several publications have presented approaches using principal component analysis (PCA) for addressing the correlation among multiple quality characteristics to obtain uncorrelated components. These uncorrelated components are then substituted into multiple original responses. While effective, PCA-based multi-response optimization mostly assumes that only the first principal component (PC)[Citation1] or few PCs are dominant to represent the original responses,[Citation2] which is not always enough to explain most of the variance-covariance structure in the data set. In a number of cases this assumption is not satisfied, so the conventional PCA-based methods usually provide poor selection results. In order to overcome this shortcoming, few authors have proposed a method called weighted principal components (WPC) or weighted multivariate index (WMI).[Citation2,Citation3] It is a strategy that aggregates all the significant PC scores weighted by their respective eigen values. Generally, in the WPC method, all PCs are taken into consideration in order to completely explain variation in all responses.[Citation3] It is a good counter-measure to a weakly performing first PC that poorly represents the original data set.[Citation4]
Though PCA has been shown to mitigate the problem of correlation among multiple quality characteristics; however, principal component regression (PCR) cannot adequately model the non-linear relationships, in spite of its success in many applications. As such, response surface methodology (RSM) is frequently used.[Citation5−Citation11] This technique provides comprehensive and informative insight into the system, which leads to faster process optimization. Meanwhile, RSM, despite its great features and successful performance in optimizing non-linear data, is not able to deal with correlated responses, which is one of its drawbacks. So, it is expected that either PCA or RSM alone is inadequate for predicting such responses. In present investigation, a two-fold technique based on WMI and RSM was applied as strategy for tackling this problem. Another disadvantage of the PCA-based approaches is that they do not ensure all quality characteristics fall within their specification limits.[Citation3] This shortcoming can be considered by using a new methodology called desirability function-based PCA (DF-PCA), which claims to combine the advantageous features of both PCA and desirability function in a single method.[Citation4] Conventional desirability function permits a target value anywhere within the specification limits and focuses on the location effect; however, it ignores the correlation among the dependent variables. Taking into account all the information mentioned above and in response to these concerns, we put forward the combined approach modeling (RSM-WMI) along with desirability function.
In first step (), correlation structure among the responses (dependent variables) is established. The original data set are then replaced by the uncorrelated linear combinations in the form of PC scores (PCscores). If Z is the standardized response data matrix and E is the eigen vectors matrix of the multivariate set, then the PCscore can be written as Eq. (1):[Citation2−Citation4]
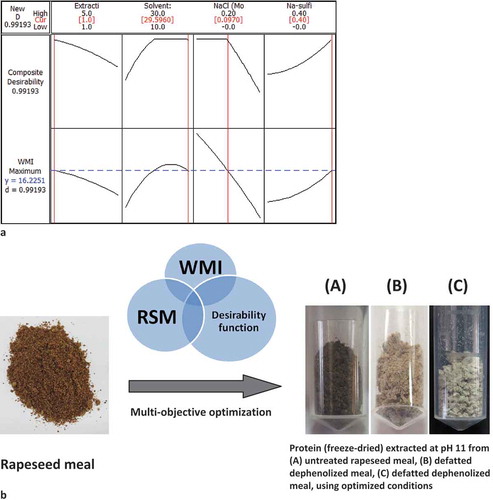
FIGURE 1 Architecture of a multi-objective optimization approach based on WMI, RSM, and desirability function.
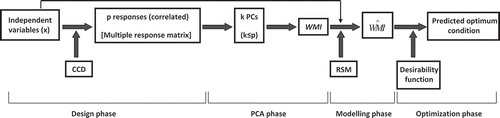
All p responses are transformed into k PCs (k < p), such that either Kaiser’s criteria (retaining only those PCs whose eigen values are greater than one) or cumulative variance greater than 80% is obtained. In the present investigation, all the PCs are retained to explain maximum variance in the data set. Considering the eigen values of the correlation matrix as set of weights, WMI was deduced as Eq. (2), where λ represents the eigen value of the pth PC.
Using central composite design (CCD), WMI is fitted to a polynomial regression equation with appropriate degree. Desirability function is used for judging the predicted WMI under optimum condition and for determining the optimum values of the causal factors (independent variables) that maximize overall composite desirability (D).
As an experimental demonstration for the proposed methodology, optimizing the extraction of light-colored protein with reduced level of phytate content from rapeseed press-cake (a major bulk waste from oil industries) have been chosen. Rapeseed proteins warrant investigation and potential beyond food applications. Deriving protein concentrates and isolates from Brassica oilseeds for food, drug, or cosmetic applications, have been attempted over the past few years for its superior-quality, high energy value, and also for curving the exorbitant cost of protein from animal sources. Unfortunately, the rapeseed/canola protein isolates produced from the reported methodologies/techniques mainly suffers from poor commercial appearance due to its unappealing dark brown-black color, caused by association of oxidized or polymerized polyphenolic compounds with protein matrices, especially during conventional alkaline extraction, and presence of high phytate content (5–7%), which is an anti-nutritional compound. Presence of phytate and dark color forming precursors in rapeseed and its products has greatly maligned its application as functional ingredient. Though some research has been conducted to reduce the darkening and phytate level of rapeseed protein; none of the proposed processes (ultrafiltration, diafiltration, ion-exchange, and protein micellar mass methods) have been commercially exploited or upscaled to practice so far, most likely due to membrane fouling problems, incomplete polyphenols and phytates removal, loss of soluble protein, excessive cost, high water consumption, or tedious processing, involving cumbersome and error-prone multi-steps.[Citation12] An effective search for efficient and cheap means for obtaining light-colored, low phytate rapeseed protein still remains a challenge.
Although several experimental design investigations for vegetable protein extraction can be found in literature, examples of optimization to improve the extraction of light-colored, phytate-reduced protein from rapeseed press-cake are scarce. Many studies from protein extraction literature illustrate the use of correlated responses. However, most authors choose to ignore the influence of the correlation structure that exists in the original data set. In view of the current discussions, the aim of this work is to apply a strategy based on CCD and WMI to find the suitable extraction parameters (extraction time, solvent: meal ratio, NaCl, and sodium sulphite concentrations) that simultaneously optimizes the protein yield, color characteristics, and phytate level of the rapeseed protein, extracted under alkaline condition. The influence of these extraction parameters on the protein yield and color parameters has had few arguments and studies. The choice of the extraction parameters and the influencing responses has been guided by a number of factors as indicated in the literature. Moreover, no organized attempt appears to have been made to study the extractability of vegetable protein using RSM-WMI-desirability function for multiple responses, particularly when the responses are correlated. The present investigation attempts such a methodical approach.
MATERIALS AND METHODS
Materials
Rapeseed press-cake was procured from Assam Khadi and Village Industries Board, Guwahati, Assam, India. The press-cake was ground to pass through 60 mesh size sieve and the resulting meal was detoxified prior to protein extraction according to our earlier report.[Citation13] All solvents and reagents were obtained from Merck® (India), of analytical grade. Bovine serum albumin (BSA) was procured from Sigma Chemicals Co. (St. Louis, MO, USA).
Optimization of Extraction Parameters
Rapeseed protein was extracted with selected 31 combinations of independent variables such as extraction time (1–5 h), solvent: meal ratio (10:1–30:1 v/w), NaCl concentration (0–0.2 M) and sodium sulfite concentration (0–0.4%) as per CCD (). Meal extracts were prepared by constant mixing of treated meal-solvent mixture in an orbital shaker set at 200 rpm (25°C) for a definite extraction time. The solvent consisted of an alkaline NaOH solution of pH 11, to which sodium chloride and sodium sulfite were added at each of the indicated concentrations in the design. Subsequently, the slurry was centrifuged at 10,000 rpm for 20 min (at 4°C). The supernatant was filtered and the volume of clarified extract was noted. Ammonium sulfate was added into the supernatant to 85% saturation[Citation14] and the mixture was kept in ice bath for 3 h with gentle stirring and then centrifuged. The obtained protein precipitate was re-dispersed in Milli-Q water (Millipore Water Purification System, Model-Elix, USA), the dispersion was adjusted to pH 7 and dialyzed. A known aliquot of this protein solution was analyzed for protein content by the Lowry method, using BSA as standard. The remaining protein solution was used for color measurement.
Color Measurements
All the precipitated protein isolates displayed a similar off-white color. However, upon dissolution in water, their solutions showed light brown colors of different intensities; an observation that was consistent with previous report on canola protein isolates.[Citation15] Therefore, following the methodology of Xu and Diosady,[Citation15] colorimetric evaluations were performed by scanning their aqueous solution. Briefly, aliquots of different protein solutions were diluted with Milli-Q water to give a concentration of 2 mg/mL (determined by Lowry method), which was done so that levels of extracted protein could be directly compared.[Citation16] Solutions were filled into a rectangular glass cell (6.5 cm length, 1 cm width, 6.5 cm height). The color intensity of the sample was measured using Hunter Lab Colorimeter (Ultrascan, VIS-Hunter Associates Lab., USA), fitted with a large area port (2.5 cm diameter aperture). The instrument (including 65°/0° geometry, D25 optical sensor, 10° observer, specular light) was calibrated using white and black reference tiles provided by the manufacturer. Measurements of Hunter-L (absolute lightness = 100; absolute darkness = 0), Hunter-a (+a = redness; –a = greenness) and Hunter-b (+b = yellowness; –b = blueness) values were taken. The average of three measurements was taken. Whiteness index (WI) was calculated using the equation (WI = L – 3b).[Citation17] Degree of whiteness was calculated by using the following formula:[Citation18]
The absorbance value (at 350 nm) of the protein solution was chosen as an index of darkening (or color intensity) and was measured as follows:[Citation19] Protein solution (1 mL), having 2 mg concentration, was dissolved in a 5 mL solution containing 4 mL of 6M urea and 1 mL of 1N NaOH. The solution was mixed and measured spectrophotometrically at 350 nm, against reagent only as blank.
Estimation of Phytates
Definite aliquots of known protein concentration were used for phytate determination using Wade reagent, according to method described by Bhandari and Kawabata.[Citation20] Results were expressed as sodium phytate equivalent in mg per 100 g protein.
TABLE 1 Central composite design at various protein extraction conditions from rapeseed press-cake, defined through the independent variables along with the observed values of the dependent variables (original responses)
Statistical Analyses
Average value and standard deviation was computed for each experimental run. CCD was chosen to systematically study the relative contribution of the four independent variables, namely extraction time, solvent: meal ratio, NaCl and sodium sulfite concentration (XA, XB, XC, and XD, respectively), with five levels (values) each (). The color parameters, protein yield and phytate level in protein were chosen as the dependent variables because of their known dependency on the extraction process.[Citation17] In the present investigation, CCD is being selected because it is the most currently used methodology in optimization procedures, especially when the experimental design is intended to find improved or optimal process settings.[Citation21] Data from the CCD were approximated to a second-order polynomial equation and analysis of variance (ANOVA) was used to evaluate data. The significances of polynomial relations were examined statistically at a probability (p) of 0.05. Statistical analysis was performed using STATISTICA (version 7, StatSoft, Oklahoma) and MINITAB (version 15, Minitab Inc., US) softwares. Effects of variables on responses were discussed by evaluation of Standardized Pareto chart.
Multi-Stage Cross-Flow Batch Extraction
Four stages of cross-flow extraction scheme were carried out by sequential batch-contacting stages.[Citation22] Protein extraction was accomplished at predicted optimal condition, at least for the initial two stages. An aliquot of the extract separated in each stage was analyzed for soluble protein content by Lowry method, and the remaining extract was used for protein recovery. Crude protein content was calculated as percent nitrogen × 6.25, for which the nitrogen content was determined by digestion of the samples in KelPlus (Kes 6L) equipment according to Kjeldahl procedure, followed by measurement of ammonium ions in the digest using KelPlus (Elite Ex) Pelican equipment.[Citation19] Crude protein of untreated rapeseed meal and partially dephenolized meal was found to be 44.8 and 36.028% (dry basis), respectively.
RESULTS AND DISCUSSION
In accordance with several published researches on protein extraction, four factors that can potentially affect rapeseed protein recovery were evaluated: extraction time, solvent: meal ratio, NaCl, and sodium sulfite concentration. These factors may also be conducive to a light color and phytate content of the protein.[Citation17] Hence, all four decisive factors were included in the CCD. The minimum and maximum levels of each factor were chosen according to the experiences of preliminary trials. The high isoelectric points of rapeseed proteins (pH ≈ 10) mandate the use of alkaline extraction conditions with pH level above 10, for higher dissolubility. However, alkaline pH (≥12) in presence of higher temperature can cause racemisation of amino acids. So, room temperature and pH level of 11 is generally preferred and considered for practical relevance.[Citation12,Citation19]
Color or appearance properties are critical parameters in defining the uses and acceptability of a protein product. In this study, rapeseed protein recuperation was optimized to lessen the development of unappealing dark color of the oilseed protein especially during alkaline extraction. For the determination of color of oilseed or vegetable protein, different authors used different methods: Blaicher et al.[Citation19] developed a spectrophotometric technique (Absorbance at 350 nm) exclusively to determine the color of rapeseed protein. Some workers[Citation15,Citation23−Citation25] used Hunter Colorimeter to find out the extent of lightness (L), redness (a) and yellowness (b) in canola/rapeseed seed protein. Again, few authors[Citation26−Citation28] used both Hunter Lab values and absorbance method concomitantly to determine the color reduction in canola protein. Still, Salcedo-Chávez et al.[Citation17] and Shaviklo et al.[Citation29] calculated WI of protein using the formula given by Codex Alimentarius. Furthermore, Wu et al.[Citation18] measured the degree of whiteness, along with CIELAB coordinates (L*, a*, b*). Multiple reaction characteristics and mechanisms as-well-as different phase localizations are usually involved in the assay of color parameters or color palette determination; for these reasons, no single assay will accurately reflect all color associated attributes in a mixed or complex system such as protein mixture from a biowaste.[Citation21] Color measurements were, therefore, carried out by all these mentioned methods to examine the effects of different combination of treatments used, so that “conforming products” (product meeting specifications) are obtained. Although, WI and degree of whiteness seem to be intimately related to each other, the response surface plots generated for them did not follow the same pattern (results not shown), indicating their individual significance for evaluating color parameters of rapeseed protein. Therefore, both parameters (WI and degree of whiteness) were studied as different responses and discussed side-by-side.
TABLE 2 Correlation coefficients (a) among the original responses of the rapeseed protein extraction parameters, (b) between the principal components scores with original responses, (c) between weighted multivariate index (representative response) with original responses
contains the eight responses (protein yield, color parameters, and phytate content) obtained for different combination of treatments according to CCD matrix. For demonstrating the existence of collinearity between the responses, the correlation matrix of the original responses was calculated (). Ribeiro et al.[Citation1] stated that if the Pearson correlation coefficient (r) between two variables in a multiple response system is ≥0.6, it can be considered that the corresponding variables have good degree of linear association between them. This way, a strong linkage was observed between Hunter-L and degree of whiteness (Pearson correlation coefficient, r = 0.97), WI and degree of whiteness (r = 0.91). A great association is seen between absorbance at 350 nm (Y2), Hunter-b (Y5), WI (Y6), degree of whiteness (Y7), and phytate content (Y8). Similarly, Hunter-L (Y3) is related with WI (Y6), (r = 0.77), and Hunter-b (Y5) negatively with WI (Y6; r = –0.94) and degree of whiteness (Y7; r = –0.71), while positively with phytate content (r = 0.70). WI (Y6) also showed negative dependency on phytate content (Y8). It is worth considering the connection between absorbance value (Y2) and Protein yield (Y1), and that between phytate content (Y8) and protein yield (Y1) as correlated variables, because r ≈ (–0.6) at p < 0.05.[Citation1] It means these variables have overlaps on the information of the subject, and hence, correlation existing amongst these responses should be precisely considered prior to optimization.
Once correlation among the multiple responses is detected, use of PCA can be recommended to reduce the redundant information, and Y (response) is replaced by the PC scores as the dependent variable (). As the PCA method groups correlated variables, it is expected that the responses with similar variations, as a function of changes in the experimental conditions, would be correlated. This correlation structure is well illustrated pictorially in and . The Pearson correlation coefficient between the PC scores and the original responses are shown in . It is clear that PC1 is highly correlated positively with Hunter-L (Y3), WI (Y6) and degree of whiteness (Y7), and negatively with absorbance at 350 nm (Y2), Hunter-b (Y5), and Phytate content (Y8). On the other hand, high correlation exists between PC2 and Hunter-a (Y4), and that between PC3 and protein yield (Y1). Though it seems that only the first two PCs dominate; only PC1 and PC2 have eigen value greater than 1 (). Ironically, PC1 and PC2 are capable of explaining only 78% of the total variation, which is considered as a poor explanation.[Citation2] So, it can be presumed that the replacement of original responses by using only the first two components (according to Kaiser’s rule), will not be a prudent choice. In this study, all the PCs are retained to explain maximum variance. The first seven PCs represent almost 100% of the total variability, suggesting that these components should be retained in order to cumulatively explain 100% of the variation in the data set. The WMI values reported in were calculated from PCs and eigen values by means of Eq. (4).
FIGURE 2 Scatterplot matrix displaying the pairwise associations among (a) various responses; and (b) PCs and responses.
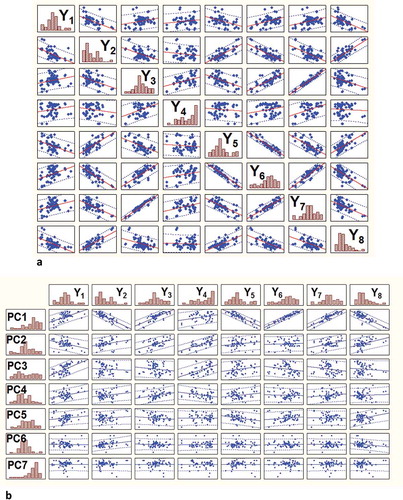
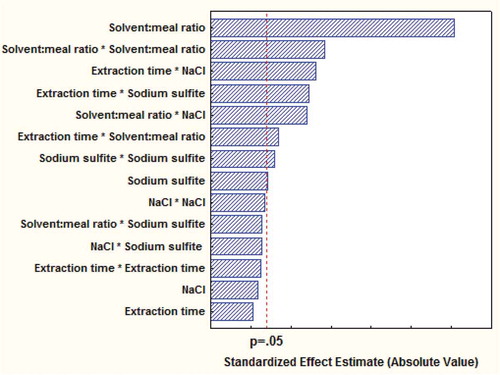
FIGURE 3 Standardized Pareto chart for the standardized main and interactions in the central composite design for WMI. Vertical dotted line indicates the statistical significance (p = 0.05) of the effects.
The estimated response surface model for WMI obtained from the polynomial regression analysis as a function of the coded factor levels are as follows:
Only the significant terms (p < 0.05) are shown in the above equations. Model adequacy is confirmed from the ANOVA table (), where the p-value for lack-of-fit (>0.05) and adjusted R2 value (coefficient of determination) of >0.93 show that the model describes the experimental points adequately. Furthermore, a good agreement between observed and predicted values of the WMI () within 95% prediction band (adj. R2 ≥ 0.95), and smaller Anderson-Darling (AD) normality value for error terms using standardized residuals along with its p-value greater than 0.05, strongly advocates that the distribution fits the data better (). The error terms of the PC scores had the normal distribution in the AD normality test within 95% confidence interval, meaning that the models are sufficiently accurate for predicting the relevant representative response (i.e., WMI).
TABLE 3 Central composite design at various protein extraction conditions from rapeseed press-cake, defined through the independent variables along with the observed values of the principal component scores and weighted multivariate index (representative response)
FIGURE 4 (a) The fitted-line plot indicating the closeness between observed response values and predicted response values (within 95% prediction band) for WMI; (b) Normal Probability plots (by Anderson-Darling Normality test within 95% confidence interval) using standardized residuals of WMI (the representative response).
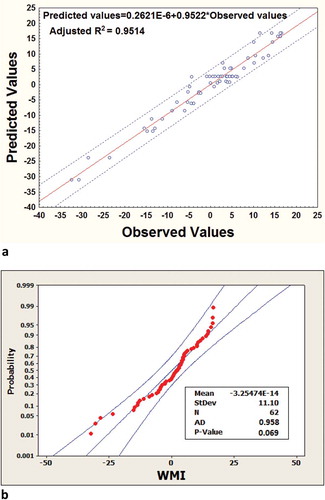
TABLE 4 Eigen analysis of the correlation matrix from original responses
TABLE 5 ANOVA of the estimated polynomial regression model built for WMI
Conditions for Optimum Responses
The model proposed for a response Y (in this case,) can be given as:
Where, b0 is the offset term; b1, b2, b3, and b4 are related to the linear terms; b5, b6, b7, and b8 are connected to the quadratic effects; b9, b10, b11, b12, b13, b14 are associated with the interaction effects. To optimize the process, the optimum point for each response of Eq. (6) was defined as the point where the first partial derivative of the function equals zero. This technique of finding the optimum condition has been discussed by some authors.[Citation30−Citation33]
As WMI is a single response, so, using the partial derivatives of polynomial regression equation of WMI (Eq. 5), optimal setting of each independent variable was obtained and the results are given in . The critical values of four independent variables ranged within the experimental region (–α, +α); however, the predicted WMI value (5.897) at the optimum point is much lesser than the (WMI)max value obtained within the experimental domain (–32.34 ≤ WMI ≤ 16.62). This indicates that the suggested optimal condition by partial derivatization method should be cautiously considered before implementation. Thus, unlike Cho et al.[Citation34] and Tabarestani et al.,[Citation35] solutions from partial derivatives of polynomial regression equation did not present a reasonable alternative for handling the present problem. As such, we opted for desirability function.
TABLE 6 Optimal conditions for protein extraction obtained by partial derivatives of regression equation of WMI
Determination of Optimum Condition by Desirability Function
Derringer function or desirability function (d) is the most currently used methodology in optimization procedures. This function transforms the estimated response variable (in this case,
), into a desirability value
(Fig. S1 in the online supplemental material). The values of
vary in the interval
(Eq. 8), increasing as the desirability of the corresponding response increases.
The individual desirabilities () are then combined using the geometric mean (Eq. 9) to give an overall composite desirability D, which increases as the balance of the properties becomes more favorable.
It should be remembered that WMI is highly correlated positively with Hunter-L, WI, and degree of whiteness (whiteness parameters), and considerably with protein yield. On the other hand, WMI is negatively correlated with absorbance at 350 nm, Hunter-b value, and phytate content (). In this work, there are several conflicts in quality characteristics, which should be simultaneously satisfied i.e., the responses Y1, Y3, Y6, and Y7 should be maximized, and Y2, Y4, Y5, and Y8 to be reduced as much as possible. Such a condition is often encountered in industrial practices or manufacturing processes, which can be resolved by WMI. In other words, increment in the yield and whiteness of the extracted rapeseed protein along with decrease in its phytate level, which were the prime objectives of the current investigation, can be performed by maximizing WMI.
In order to optimize, the overall composite desirability (D) was prioritized by specifying the goals and boundaries of WMI (maximum and minimum values of WMI obtained within the experimental region).[Citation36] Based on the proposed upper and lower bounds, the predicted WMI (16.2251) and its desirability (0.99193) at optimal condition are presented in . The behavior of the predicted WMI was generated from the optimized factor of 1h of extraction time, 29.596 v/w of solvent: meal ratio, 0.097M NaCl concentration and sodium sulfite level of 0.4% (). The high composite desirability (D) of 0.9919 indicates the best combinations of the causal factors to optimize the studied system.
FIGURE 5 (a) Overall optimum conditions and response behavior of WMI predicted from desirability function approach; (b) Photograph explaining the improvement in whiteness of rapeseed protein isolates (freeze-dried) under the predicted optimal condition.
Verification of Predicted Value at Optimum Condition
The final step in any design of experiment approach is to conduct confirmation experiment. As such, additional confirmatory experiments were conducted at the suggested optimum condition, namely 1 h of extraction time, 29.596 v/w of solvent: meal ratio, 0.097M NaCl concentration and sodium sulfite level of 0.4%, to verify the factor settings. Correspondingly, the observed experimental values of Y1–Y8 responses (mean of four measurements), obtained at optimal condition, are given in . These experimental values were converted to their normalized values (standardization of each response) using Eq. (10).
TABLE 7 Confirmatory trials of the optimal conditions
PCs were computed from the standardized data set using the Eq. (11).
TABLE 8 Fitted quadratic polynomial equations of original responses obtained by conventional response surface methodology
Comparison between RSM and WMI-RSM Methods: Modeling the Extraction Factors by Conventional RSM and Desirability Function Using the Original Responses
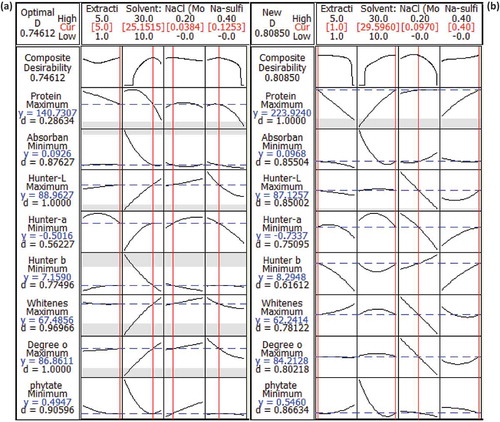
Using the (2)4-CCD matrix and the original response values (Y1–Y8) of , conventional RSM procedure was employed to fit the quadratic polynomial equations to the experimental data. The overall fit of the quadratic polynomial equations to the given data set is expressed by adjusted R2, which was found to be high in all responses (). In the presented response surface equations (), all insignificant terms were eliminated (p > 0.05) and the regression models were found to be significant at p < 0.05. In order to optimize eight responses simultaneously, desirability function (di) was used. Depending on whether a particular response is to be maximized, minimized, or assigned a target value, the goals and boundaries (maximum and minimum values obtained within the experimental region) of each response variable was set.[Citation36] The predicted responses and individual desirability are presented in . The individual desirabilities were then combined into composite desirability, which was very low (0.746). This is due to the described converse effects, i.e., unfeasible conformance to large number of responses.[Citation37] The behavior of the predicted responses was generated from the optimized factors of 5 h of extraction time, 25.152 v/w of solvent: meal ratio, 0.038M of NaCl concentration and sodium sulfite level of 0.125% (). In order to compare this predicted condition (proposed by RSM) with the optimal condition of WMI-RSM, the behavior of eight responses under the optimal condition of WMI-RSM-desirability function, was generated () and compared with . The composite desirability greatly increased from 0.746 to 0.809, which is indicative of the best combinations of the causal factors to optimize the studied system. So it vouched the fact that the predictive ability of “WMI-RSM-desirability function” trio is higher than “RSM-desirability function” especially for correlated responses, indicating the superiority of the former.
FIGURE 6 Comparison between the optimum condition and response behaviour predicted from (a) RSM-desirability function and (b) WMI-RSM-desirability function.
Tuning of the Optimal Extraction Condition for Maximum Protein Recovery (Multi-Stage Extraction)
For industrial applications, the number of extraction stages should be ascertained so that maximum protein recovery would be obtained. To achieve this, we conducted protein extractions at the predicted optimal condition, using a 4-stage cross-flow extraction scheme (). It should be noted that pre-treatment of the meal with methanol and acetone, during partial dephenolization, removes large amount of N-containing components (glucosinolates, tri-amine compounds like betaine, choline, sinapine, and free amino acids)[Citation39,Citation40] and considerable amount of alcohol-soluble prolamin protein from the meal.[Citation41−Citation44] As the use of nitrogen content (N) to estimate protein levels of oilseeds and meal have been the norm for the oilseed and seed meal industry,[Citation40] so elimination of these N-containing components reduced the crude protein level in the dephenolized meal and thereby the protein recovery (≈20% drop; ). Moreover, treatment with organic solvent might have denatured some protein in the meal, causing lesser protein dissolution and hence, low recovery.[Citation22] At least two extraction stages are often used in extraction protocols for ensuring sufficient protein dissolution from the meal. So, the solvent: meal ratio of 30:1 (v/w) (from predicted optimum condition) was used in Run 1 and 2. Extracts from the first two stages (E1 and E2) gave 69.158% of the total meal protein (). Under alkaline condition, protein net charge increases and leads to the increase of electrostatic repulsion and hydration of charged residue, which in-turn promotes protein solubilization into the extracting solvent.[Citation22] Subsequent extraction stages produced much lower protein yield, indicating that the proteins have been extracted at its maximum value.[Citation22] As such, the solvent: meal ratio of the succeeding stage(s) (Run 3 and 4) was then progressively reduced to half of that used in the previous extraction stage (Run 1 and 2). This was done because recuperation of small amount of protein from large volume of liquid can cause handling problem,[Citation45] and will also add to the increased cost of both water and waste-water treatment.[Citation46] Likewise, a ratio lower than 7.5:1 (v/w) was not tested because the reduced amount of solvent was not sufficient to disperse the meal completely. The total protein yield from Run 3 and 4, was found to be very low (5.288%). Also, the extracts of these runs (E3 and E4) were more viscous than the previous ones (E1 and E2), due perhaps to dissolved polysaccharides.[Citation47] At a larger scale, higher viscosities of the extract can result in difficulties during subsequent processing, or alternatively, removal of sugars and polysaccharides from these extracts (or protein) will add to the production cost. Thus, rapeseed protein extraction beyond two stages, using predicted optimal condition, seems less interesting for industrial scale, and therefore, Run 3 and 4 may be eliminated without much protein loss. The extracts from Run 1 and 2, after dialysis and freeze dry, gave off-white colored protein isolate, having protein purity higher than 80%. It is conceivable to assume that all protein reported for rapeseed meal cannot be recovered because the nitrogen (N) originating from molecules such as structural proteins (e.g., extensions, Gly-rich proteins, Pro-rich proteins, and arabinogalactan proteins) may not be soluble (i.e., insoluble protein), but contribute to the total N-content.[Citation40] Hence, presence of certain amount of protein in the residual mass (R4) is inevitable (). This solid residue may have a value as a functional ingredient due to its high fibre and marginal protein content.[Citation46]
FIGURE 7 (a) Cross-flow extraction in four stages [S(n) = extractive solvent: meal ratio of stage n; M = Partially dephenolized rapeseed meal; R(n) = Residual solid from stage n; E(n) = Extract from stage n; Alkaline solution of pH 11 (with 0.097M NaCl and 0.4% sodium sulfite) was used as extractant in all the stages; Extraction time for each run = 1 h]; (b) Distribution of protein content in the different stages of processing (alkaline solution of pH 11 was used for protein extraction in all the four stages of cross-flow extraction scheme). Values are mean of two replicates.
![FIGURE 7 (a) Cross-flow extraction in four stages [S(n) = extractive solvent: meal ratio of stage n; M = Partially dephenolized rapeseed meal; R(n) = Residual solid from stage n; E(n) = Extract from stage n; Alkaline solution of pH 11 (with 0.097M NaCl and 0.4% sodium sulfite) was used as extractant in all the stages; Extraction time for each run = 1 h]; (b) Distribution of protein content in the different stages of processing (alkaline solution of pH 11 was used for protein extraction in all the four stages of cross-flow extraction scheme). Values are mean of two replicates.](/cms/asset/d8bdf985-3db5-422d-8950-3939438e3727/ljfp_a_891612_f0007_oc.jpg)
Blaicher et al.[Citation19] reported that 79% of the total meal protein can be extracted by three successive extractions of rapeseed meal at pH 11, whereas dissolution of about 82 and 87% of the total meal protein can be attained by 3- and 4-stage counter-current extraction system, respectively, under the same alkaline condition (pH 11). In contrast, our investigation shows that almost 87% of the total protein present in partially dephenolized meal (starting material for protein extraction) or 69.16% of the total protein present in untreated rapeseed meal, could be realistically achieved during the first two consecutive extraction stages (at pH 11). Thus, concomitant application of WMI and desirability function based RSM optimization, followed by multi-stage cross-flow batch extraction, caused a substantial increase in the extent of dissolution of rapeseed meal protein and the resultant protein isolate exhibited visually acceptable white colour, with protein purity higher than 80%.
CONCLUSION
The presented systematic optimization technique, using WMI, RSM, and desirability function, was applied on a multi response process—extraction of light-colored rapeseed protein having reduced phytate level. This combined approach was used to optimize a large number of multiple correlated quality characteristics simultaneously. The advantage of the methodology is that the optimal factor combination reflects a compromise between the partially incommensurable quality characteristics. Overall, it can be concluded that the results from the presented method for the here-observed experimental study indicate a marked improvement in all quality characteristics. The study also reveals process performance analyses (in cross-flow batch extraction) that are not often presented in literature.
ACKNOWLEDGMENTS
MDP is thankful to DST-INSPIRE, India. The authors are very thankful to the head and faculties of Indian Statistical Institute (ISI), North-East Center, for providing an amiable academic atmosphere and valuable suggestions.
SUPPLEMENTAL MATERIAL
Supplemental data for this article can be accessed on the publisher’s website.
Supplemental figures
Download MS Word (272.5 KB)REFERENCES
- Ribeiro, J.S.; Teófilo, R.F.; Augusto, F.; Ferreira, M.M.C. Simultaneous optimization of the microextraction of coffee volatiles using response surface methodology and principal component analysis. Chemometrics and Intelligent Laboratory Systems 2010, 102, 45–52.
- Paiva, A.P.; Costa, S.C.; Paiva, E.J.; Balestrassi, P.P.; Ferreira, J.R. Multi-objective optimization of pulsed gas metal arc welding process based on weighted principal component scores. International Journal of Advanced Manufacturing Technology 2010, 50, 113–125.
- Salmasnia, A.; Kazemzadeh, R.B.; Seyyed-Esfahani, M.; Hejazi, T.H. Multiple response surface optimization with correlated data. International Journal of Advanced Manufacturing Technology 2012, DOI:10.1007/s00170-012-4056-9.
- Salmasnia, A.; Kazemzadeh, R.B.; Niaki, S.T.A. An approach to optimize correlated multiple responses using principal component analysis and desirability function. International Journal of Advanced Manufacturing Technology 2011, DOI:10.1007/s00170-011-3824-2.
- Bostan, A.; Razavi, S.M.A.; Farhoosh, R. Optimization of hydrocolloid extraction from wild sage seed (Salvia macrosiphon) using response surface. International Journal of Food Properties 2010, 13, 1380–1392.
- Jideani, V.A.; Oloruntoba, R.H.; Jideani, I.A. Optimization of fura production using response surface methodology. International Journal of Food Properties 2010, 13, 272–281.
- Koocheki, A.; Azarpazhooh, E. Evaluation of mass exchange during osmotic dehydration of plum using response surface methodology. International Journal of Food Properties 2010, 13, 155–166.
- Sogi, D.S.; Oberoi, D.P.S.; Malik, S. Effect of particle size, temperature, and total soluble solids on the rheological properties of watermelon juice: A response surface approach. International Journal of Food Properties 2010, 13, 1207–1214.
- Agrafioti, P.T.; Katsanidis, E. Effects of additives on the selected quality attributes and cooking yield of squid: Modelling and optimization. International Journal of Food Properties 2012, 15, 579–589.
- Hassan, H.F.; Ramaswamy, H.S. Optimization of instrumental texture of carrot and meat alginate simulated particles for use in thermal processing biological validation studies. International Journal of Food Properties 2012, 15, 1319–1335.
- Zhao, X.-H.; Song, J.-T. Evaluation of antioxidant properties in vitro of plastein-reaction-stressed soybean protein hydrolysate. International Journal of Food Properties 2014, 17, 152–162.
- Sadeghi, M.A.; Appu Rao, A.G.; Bhagya, S. Evaluation of mustard (Brassica juncea) protein isolate prepared by steam injection heating for reduction of antinutritional factors. Lebensmittel-Wissenschaft und Technologie 2006, 39, 911–917.
- Das Purkayastha, M.; Das, S.; Manhar, A.K.; Deka, D.; Mandal, M.; Mahanta, C.L. Removing antinutrients from rapeseed press-cake and their benevolent role in waste cooking oil-derived biodiesel: Conjoining the valorization of two disparate industrial wastes. Journal of Agricultural and Food Chemistry 2013, 61, 10746–10756.
- Liu, Y.; Zhao, G.; Ren, J.; Zhao, M; Yang, B. Effect of denaturation during extraction on the conformational and functional properties of peanut protein isolate. Innovative Food Science and Emerging Technologies 2011, 12, 375–380.
- Xu, L.; Diosady, L.L. Removal of phenolic compounds in the production of high-quality canola protein isolates. Food Research International 2002, 35, 23–30.
- Park, S-H.; Bean, S.R. Investigation and optimization of the factors influencing sorghum protein extraction. Journal of Agricultural and Food Chemistry 2003, 51, 7050–7054.
- Salcedo-Chávez, B.; Osuna-Castro, J.A.; Guevara-Lara, F.; Domínguez-Domínguez, J.; Paredes-López, O. Optimization of the isoelectric precipitation method to obtain protein isolates from amaranth (Amaranthus cruentus) seeds. Journal of Agricultural and Food Chemistry 2002, 50, 6515–6520.
- Wu, N.; Wang, L.; Yang, X.; Yin, S.; Teng, Z.; Zheng, E. Comparison of flavor volatiles and some functional properties of different soy protein products. Journal of the American Oil Chemists’ Society 2011, 88, 1621–1631.
- Blaicher, F.M.; Elstner, F.; Stein, W.; Mukherjee, K.D. Rapeseed protein isolates: Effect of processing on yield and composition of protein. Journal of Agricultural and Food Chemistry 1983, 31, 358–362.
- Bhandari, M.R.; Kawabata, J. Cooking effects on oxalate, phytate, trypsin, and a-amylase inhibitors of wild yam tubers of Nepal. Journal of Food Composition and Analysis 2006, 19, 524–530.
- Dorta, E.; Lobo, M.G.; González, M. Optimization of factors affecting extraction of antioxidants from mango seed. Food and Bioprocess Technology 2011, DOI:10.1007/s11947-011-0750-0.
- Lestari, D.; Mulder, W.; Sanders, J. Improving Jatropha curcas seed protein recovery by using counter current multistage extraction. Biochemical Engineering Journal 2010, 50, 16–23.
- Diosady, L.L.; Xu, L.; Chen, B.-K. Production of high-quality protein isolates from defatted meals of Brassica seeds. US Patent US20030060607A1, 2003.
- Segall, K.I.; Willardsen, R.; Schweizer, M. Preparation of canola protein isolate involving isoelectric precipitation. US Patent US20090175999A1, 2009.
- Xu, L. The removal of phenolic compounds for the production of high-quality canola protein isolates. PhD Thesis, Department of Chemical Engineering and Applied Chemistry, University of Toronto: Toronto, Canada, 1999.
- Green, B.E. Colour reduction in canola protein isolate. US Patent US20060281904A1, 2006.
- Green, B.E.; Xu, L.; Milanova, R.; Segall, K.I. Colour reduction in canola protein isolate. US Patent US7678392B2, 2010.
- Gosnell, B.; Segall, K.I.; Schweizer, M. Production of canola protein. US Patent US7955625B2, 2011.
- Shaviklo, G.R.; Thorkelsson, G.; Arason, S.; Sveinsdottir, K. Characteristics of freeze-dried fish protein isolated from saithe (Pollachius virens). Journal of Food Science and Technology 2012, 49(3), 309–318.
- Bup, D.N.; Abi, F.; Tenin, D.; Kapseu, C.; Tchiegang, C. Optimisation of the cooking process of sheanut kernels (Vitellaria paradoxa Gaertn.) using the Doehlert experimental design. Food and Bioprocess Technology 2009, DOI:10.1007/s11947-009-0274-z.
- Peričin, D.; Radulović, L.; Trivić, S.; Dimić, E. Evaluation of solubility of pumpkin seed globulins by response surface method. Journal of Food Engineering 2008, 84, 591–594.
- Quanhong, L.; Caili, F. Application of response surface methodology for extraction optimization of germinant pumpkin seeds protein. Food Chemistry 2005, 92, 701–706.
- Santelli, R.E.; de Almeida Bezerra, M.; de SantAna, O.D.; Cassella, R.J.; Ferreira, S.L.C. Multivariate technique for optimization of digestion procedure by focused microwave system for determination of Mn, Zn, and Fe in food samples using FAAS. Talanta 2006, 68, 1083–1088.
- Cho, S.M.; Gu, Y.S.; Kim, S.B. Extracting optimization and physical properties of yellowfin tuna (Thunnus albacares) skin gelatin compared to mammalian gelatins. Food Hydrocolloids 2005, 19, 221–229.
- Tabarestani, H.S.; Maghsoudlou, Y.; Motamedzadegan, A.; Sadeghi Mahoonak, A.R. Optimization of physico-chemical properties of gelatin extracted from fish skin of rainbow trout (Onchorhynchus mykiss). Bioresource Technology 2010, 101, 6207–6214.
- Tan, M.C.; Chin, N.L.; Yusof, Y.A. A box–behnken design for determining the optimum experimental condition of cake batter mixing. Food and Bioprocess Technology 2010, DOI:10.1007/s11947-010-0394-5.
- Pickardt, C.; Neidhart, S.; Griesbach, C.; Dube, M.; Knauf, U.; Kammerer, D.R.; Carle, R. Optimisation of mild-acidic protein extraction from defatted sunflower (Helianthus annuus L.) meal. Food Hydrocolloids 2009, 23, 1966–1973.
- Ghodsvali, A.; Haddad Khodaparast, M.H.; Vosoughi, M.; Diosady, L.L. Preparation of canola protein materials using membrane technology and evaluation of meals functional properties. Food Research International 2005, 38, 223–231.
- Qian, J.; Yang, Q.; Sun, F.; He, M.; Chen, Q.; Yun, Z.; Qin, L. Cogeneration of biodiesel and nontoxic rapeseed meal from rapeseed through in-situ alkaline transesterification. Bioresource Technology 2012, DOI:http://dx.doi.org/10.1016/j.biortech.2012.10.017.
- Wanasundara, J.P.D.; Abeysekara, S.J.; McIntosh, T.C.; Falk, K.C. Solubility differences of major storage proteins of Brassicaceae oilseeds. Journal of the American Oil Chemists’ Society 2012, 89, 869–881.
- Alam, M.; Basha, S.M.; Boyd, L.C. Characterization of methanol-soluble and methanol-insoluble proteins from developing peanut seed. Journal of Agricultural and Food Chemistry 2000, 48, 5517–5521.
- Gorinstein, S. Alcohol-soluble and total proteins from Amaranth seeds and their comparison with other cereals. Journal of Agricultural and Food Chemistry 1991, 39, 848–850.
- Shull, J.M.; Watterson, J.J.; Kirleis, A.W. Proposed nomenclature for the alcohol-soluble proteins (Kafirins) of Sorghum bicolor (L. Moench) based on molecular weight, solubility, and structure. Journal of Agricultural and Food Chemistry 1991, 39, 83–87.
- Klockeman, D.M.; Toledo, R.; Sims, K.A. Isolation and characterization of defatted canola meal protein. Journal of Agricultural and Food Chemistry 1997, 45, 3867–3870.
- Rodrigues, I.M.; Coelho, J.F.J.; Carvalho, M.G.V.S. Isolation and valorisation of vegetable proteins from oilseed plants: Methods, limitations, and potential. Journal of Food Engineering 2012, 109, 337–346.
- Xu, L.; Lui, F.; Luo, H.; Diosady, L.L. Production of protein isolates from yellow mustard meals by membrane processes. Food Research International 2003, 36, 849–856.
- Teng, Z.; Wang, Q. Extraction, identification, and characterization of the water-insoluble proteins from tobacco biomass. Journal of the Science of Food Agriculture 2012, 92, 1368–1374.