
Abstract
Saffron is the commercial name of the dried stigmas of Crocus sativus L. flower. Due to the high cost of saffron, adulteration sometimes occurs in the local market. In this study, the aroma fingerprints of saffron, saffron with yellow styles, safflower, and dyed corn stigma were detected by an electronic nose system. The features of the obtained signals from electronic nose system were extracted and used for data analysis. In this work, principal component analysis was used and the results were confirmed by back propagation artificial neural networks. The results revealed that the system can recognize the saffron adulteration satisfactorily. As a conclusion, it was found that the electronic nose could provide good separation of the saffron and adulterated one (safflower and other adulteration) as 100 and 86.87% classification accuracy, respectively, by means of artificial neural networks. The electronic nose was able to differentiate non-adulterated and adulterated saffron at higher than 10% adulteration level successfully.
INTRODUCTION
Saffron, the dried stigmas of Crocus Sativus L., is one of the most precious agricultural products and also is the most expensive spice among 85 known spices in the world and thus, is called red gold. Saffron is a sterile triploid plant[Citation1] and it is a member of the Iridaceae family.[Citation2] Each saffron flower has only three stigmas which is used as a food additive due to its aroma, color, and bitter taste,[Citation3,Citation4] and is also used in traditional medicine.[Citation5]
Currently, saffron is produced in Iran, Spain, Greece, Italy, Turkey, and India. Iran is the main saffron producer in the world with 220 tons per year, i.e., about 90% of the total production in the world, and the rest is produced in other countries.[Citation1,Citation6] Actually, traditional cultivation and harvesting of saffron are carried out by hand which is a time consuming and laborious process. Resulting in 1 kg saffron being taken from about 150,000 flowers with a cost of more than $2000.[Citation7] Quality of samples depends on the color produced by crocin and crocetins (carotenoid derivatives), the main volatile of safranal (a monoterpene: C10H14O) and the bitter taste which is produced by picrocrocin (a monoterpene glucoside: C16H26O7).[Citation8]
Unfortunately, since saffron is an expensive product, in various ways, it is cheated by the dealers. Therefore, quality control of saffron is important for the spice industries and also the consumers. Adulteration of food products includes adding any type of cheap materials to expensive or valuable materials in order to reduce the amount of expensive products and thus, produce products with lowest cost and the highest profits.[Citation9] Therefore, adding or mixing of similar materials such as beet, pomegranate fibers, red-dyed silk fibers, safflower, and marigold to red stigma of saffron are the most common types of fraud in saffron production. Another way for adulteration, in order to increase the saffron mass, is immersion of saffron fibers in honey, vegetable oils, or glycerin.[Citation10−Citation12] The most common methods used to detect adulteration in food are spectroscopy and gas chromatography.[Citation13] The most important parameters to establish saffron quality are the aroma, bitterness, and coloring strength. Saffron color and aroma are determined by different equipment such as UV-Vis spectrometry, HPLC, and gas chromatography-mass spectrometry (GC-MS).[Citation4,Citation14] However, these methods are expensive and require trained experts. Unfortunately, as of yet, analytical methods have not been developed to grade saffron.
Recently, a new analytical technique has been developed which is called the electronic nose[Citation15] that could detect and specify complex odors using some arrays of sensors.[Citation16] The first work for odor simulation was published in 1982 by Persaud and Dodd.[Citation17] E-nose systems are used to simulate mammalian olfactory response to aromas[Citation18,Citation19] and use an array of chemical gas sensors to give a response and then pattern recognition algorithm for the analysis of volatile compounds is applied.[Citation20−Citation22] The most notable use of the e-nose application is in the food industry. Electronic nose offers facilities for fast and precise development, life scale determination, quick recognition of undesirable microorganisms, and fast decay identification. Saffron aroma is released by the metabolic processes at the processing and storage duration. Metabolic processes of microorganisms in food and agricultural crops leads to produce volatile organic compounds. It is also possible to determine fake and original saffron by sensing these compounds in the headspace and several researchers have used electronic nose to determine fake and original products such as sunflower oil, corn oil,[Citation23,Citation24] sesame oil,[Citation19] tea, coffee, etc. They determined fake products using the electronic nose at the satisfactory level of 95%. Manuel Carmona et al. used an electronic nose to determine geographic origins of saffron with a 90% of confidence.[Citation25] However, no study has been reported for detecting adulteration in saffron by using of e-nose. This work focuses on the use of the e-nose for quality control of saffron. The aim of this research is to study the effectiveness of a system for detecting original saffron from safflower (Carthamus tinctorius L.) as the most important adulterated material in saffron, saffron with yellow style, saffron stigmas heavy with corn stigma (called silk) colored using natural dyes such as beetroot (Beta vulgaris L.) based on e-nose technology.
MATERIAL AND METHODS
Samples
The original saffron samples in two batches, with red threads (Sargol) and threads with yellow styles (), used in this study were supplied from a saffron farming area in the Qaen County (South Khorasan, Iran). Safflower, corn stigma (silk), and natural dyes, such as beetroot (Beta vulgaris L.) were purchased from a local market in Karaj city (Alborz, Iran). The samples were kept in room temperature away from light until starting experiments. The original saffrons were mixed with safflower in proportions ranging from 10 to 50% (w/w) of saffron. Then, for each group, the relevant experiments were carried out and detected 15 times by the e-nose. The corn stigma was colored with natural dye extracted from beetroot and then mixed in the range of 25 to 50% (w/w) with original saffron. The bunch of threads saffron with yellow styles was used as one of the adulterated samples because yellow styles decrease cost of saffron in local marketing. For each group of this kind of adulteration, samples were detected five times with e-nose system.
FIGURE 1 Saffron stigmas with yellow style.[Citation26]
![FIGURE 1 Saffron stigmas with yellow style.[Citation26]](/cms/asset/f30fc97f-77ea-4763-a3fe-3cd7ac7a66bb/ljfp_a_915850_f0001_oc.jpg)
Electronic Nose
The aroma fingerprints of saffron and adulterated samples were obtained using an electronic nose system. This system consists of MOS sensors, sensors, and sample container, three electronic valves, pumps, and oxygen container. shows the schematic of designed electronic nose system.
FIGURE 2 (a) Actual and (b) schematic view of designed e-nose system.
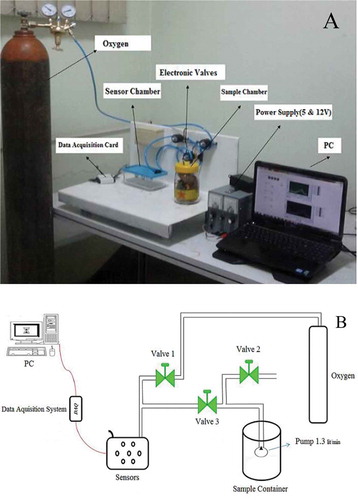
The designed system equipped with a pump (ACO-5501 from Hailea company, China) with the rate of 1.3 L/min which is located inside the samples container. The most popular sensors used to develop e-noses and are applicable in the food industry are metal oxide semiconductors (MOS) which were used in this work.[Citation18,Citation27,Citation28] A sensor array of six metal oxide semiconductors, MQ-type (HANWEI Electronics Co., Ltd., Henan, China) was used in electronic nose. The sensors specifications used in this electronic nose system are given in . These sensors were installed on an electronic board based on sensor circuitry recommended by the manufacturer. shows one of the sensor circuits.
FIGURE 3 (a) Sensor circuitry and (b) the method of placing the bases of a sensor.
The responses of the six sensors were obtained by a data acquisition card (NI USB-6009, National Instrument) with 0.305 mV sensitivity, connected to a personal computer programed by Lab View 2012 Software. Static headspace analysis is the most popular and low cost sampling method[Citation29] which was used in this study. The sample was placed in a container and then let the system so that the headspace becomes saturated with the odor. This headspace is then transferred into the sensor array chamber. Because of saturated gas with the vapor the initial response of the sensors to the odor is considerable. After duration, the headspace was removed from the chamber and replaced by clean air and thus, the sensor response returned to its baseline value.[Citation29] Each sensor collected the data and converted it into an electrical signal which is suitable for computer analysis.[Citation22] The electronic nose system was scheduled for three phases, baseline correction, injection of flavor of sample and clean-up sensors, and sample chambers with clean air (oxygen; ).
TABLE 1 MOS sensors used in designed e-nose, main applications, and detection ranges
FIGURE 4 (a) E-nose sensor response to an odorant;[Citation21,Citation30] typical response of e-nose to samples: (b) saffron; (c)safflower; (d) corn stigma.
![FIGURE 4 (a) E-nose sensor response to an odorant;[Citation21,Citation30] typical response of e-nose to samples: (b) saffron; (c)safflower; (d) corn stigma.](/cms/asset/a6af3002-b31d-4b87-a22c-86c656e862ff/ljfp_a_915850_f0004_oc.jpg)
To start the experiments, first sample was placed inside the chamber and then the chamber was closed. Because agricultural materials are alive and breathe, we waited 3600 s to let headspace be filled with odors and then the experiment was started. Oxygen was passed through the sensors chamber in baseline correction phase for 200 s to reach sensors to their baseline. In injection phase, the pump was turned on and the odor passes through the sensors for 180 s. In this phase, output voltage of each sensor changes depending on the type and sensitivity to the gas. Then in the last stage, and to clean the sensors, oxygen was passed over sensors and thus, smells inside the sample container were removed by the pump. This stage lasts for 120 s. Sensors responses in the 500 s were collected by a data acquisition system programed with Lab View 2012 Software. – show typical recordings for original saffron, safflower, and corn stigma samples.
The next step in analyzing the odor is pre-processing of signals in order to improve the quality of the information available and to optimize the array output before passing on to the pattern recognition system. The three most commonly used methods are shown in . The fractional method was used in this study. In the fractional method, the baseline value xs(0) was subtracted from the dynamic response xs(t) and then was divided into the baseline to obtain fractional manipulation. The preprocessed response ys(t) in this method provided dimensionless, normalized response that compensates large or small signals.[Citation21] The preprocessed data were then used in a multivariate analysis technique. There are two types of pattern recognition, those used as statistical techniques or neural network-based approaches. These methods are based on whether the technique is used for quantification or classification.[Citation27] Statistical methods are parametric and include principal component analysis (PCA), linear discriminant analysis (LDA), principal component regression (PCR), partial least square (PLS), and clustering algorithms such as K-mean. Artificial intelligence techniques include artificial neural networks (ANN; including MLP, SOM, LVQ, and ART), fuzzy logic and genetic algorithm.[Citation22] In this work, data was processed using statistical methods such as PCA and ANN.
TABLE 2 Standard data normalization techniques[Citation19]
Data Analysis
In an electronic nose system, two major building blocks are the sensors and the pattern classification engine. The aim of this study is to identify saffron quality by the electronic nose. After data collection, they were analyzed using PCA and also ANN. PCA is a non-supervised method which is used to find the correlation in multi-sensor array data to predict test data. PCA results are confirmed by ANN. Two three-layer feed forward neural network including input layer, hidden layer, and output layer have been used (). For six sensors in the sensor array, the ANN has six inputs with normalized data from the measured signals and the output layer has seven nodes for classification between saffron and safflower (original saffron, safflower and five groups of mixing saffron with safflower) and other network has five nodes modified to classify among saffron, corn stigma, and saffron with yellow styles. In the ANN, sigmoid activation (tanh) functions were used in the hidden and output layer, respectively.[Citation32] Then the network was created and trained with the training algorithm of Levenberg-Marquardt. The algorithm was based on the mean square error (MSE) and was used to obtain the optimized network of different nodes in hidden layer. The network was trained to minimize MSE between the network outputs and the target values. Finally, optimal selected model had 6-9-5 structure for classification among saffron, saffron with yellow style, and corn stigmas. Data processing was carried out in Matlab (The Mathworks Inc., Natick, MA, USA), Microsoft Excel, Neuralsolution 5, and The Unscrambler 10.2 (CAMO ASA, Norway).
FIGURE 5 Schematic of multilayer perceptron neural network.[Citation31]
![FIGURE 5 Schematic of multilayer perceptron neural network.[Citation31]](/cms/asset/c684329d-3b5f-4525-be57-d1cc6ef7324a/ljfp_a_915850_f0005_b.gif)
RESULT AND DISCUSSION
PCA Results
For statistical analysis for each group (saffron, safflower, corn stigma, and their mixture), 15 samples were registered with all sensors in the e-nose system. Therefore, 165 samples were used in data acquisition. For the reduction of data dimensionality the fractional method was employed. PCA was employed to discriminate among saffron and adulterated one by using the obtained signals. The data obtained by the process mentioned above (the fractional method) was applied as the input of multivariate analysis, and the plots of the first two principal components are shown in . PCA reduces the complexity of the data-set, from the initial n-dimensional space (six sensors) to a few dimensions. PCA is performed with no information on the classification of samples. It is based on the variance of the data-set.
FIGURE 6 Plot of PCA for: (a) saffron, safflower, and their mixture; (b) saffron, yellow style, corn stigma, and their mixtures.
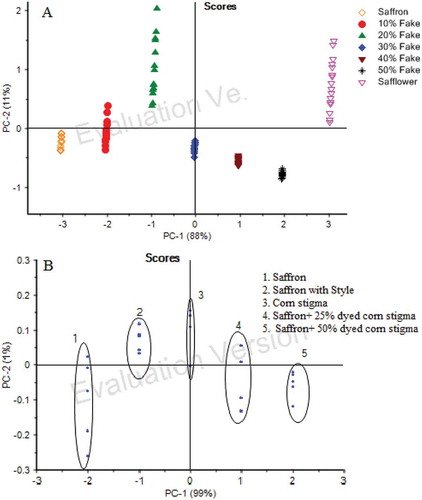
In the PCA scores plot has been represented where the first two components (PC1 and PC2) represent the total variance between the sample measurements. The scores plot has been used to determine whether distinct data clusters exist for pattern recognition. As observed in these figures, all the samples could be clearly discriminated one from each other. For PCA analysis, overall PC1 and PC2 explained 100% of the total variance among saffron, yellow style and dyed corn stigma (PC1 = 99% and PC2 = 1%). Also confidence intervals for detecting and separating between saffron and safflower, ellipses correspond to 99% (PC1 = 88% and PC2 = 11%). The PCA scores plot structure was in conformity with the signals from electronic nose system recorded for each sample. The results indicate that it is clearly possible to discriminate saffron mixed with adulterant.
Sensors are at the hearth of electronic tongues. A key issue is the correct selection of sensors able to detect particular components present in saffron while showing good complementarity. The loading plot presented in demonstrates that the electrodes selected show a high degree of complementarity and these loadings appear in the four quadrants of the plot.
ANN RESULTS
The back propagation (BP) multilayer perceptron algorithm was used to classify and to detect saffron and adulterated types. Performance evaluations of each designed networks were compared by MSE and correlation coefficient (r). For training the network different nodes in hidden layer and MSE were carried out. In this work, a MSE of 10−8, a minimum gradient of 10−10, and maximum epoch of 100 were used. If any of these conditions were occurred the training process to prevent of over training would stop. The initial weights and biases of the network were generated automatically by the program. The learning rate as 0.02 and the momentum factor as 0.9 were used. Numbers of neurons for hidden layer were selected based on trial and error. The data were divided to three subsets: 60% was used for training, 20% for testing, and the remaining 20% were kept for cross validation. In order to minimize ANN training time, only one hidden layer was considered. By comparing information obtained for MSE and percentage accuracy of different networks, the best results were found by choosing nine nodes in a hidden layer. After network training and validation using optimized ANN model, i.e., 6-9-5 structure, success rate (classification accuracy) for five outputs (saffron, saffron with yellow style, corn stigma, and their mixture), were found to be 86.87% ( gives the results obtained for such test) and for saffron, safflower, and their mixture were 100% ().
TABLE 3 Classification confusion matrix of correctly classified saffron
TABLE 4 Correct classification rate for saffron and safflower
CONCLUSIONS
An electronic nose based on six metal oxide semiconductor sensors was used to detect saffron, safflower, dyed corn stigma and their mixture as adulteration in saffron. The electronic nose system can successfully classify between original saffron and the adulterated one by pattern recognition method. Results of PCA showed that the signals corresponding to different samples were significantly different. All kinds of materials (original saffron and adulterated one) can be detected. The PCA technique and analysis of the electronic nose was very useful for evaluating the quality of the saffron. After detecting adulteration, e-nose system accompanied with ANN can approximately classified saffron from saffron mixtures with fraud materials (success rate = 86.87% among saffron and mixture with dyed corn stigma and yellow style, and success rate = 100% between saffron and safflower). From the PCA plots of samples, it reveals that distinct discrimination of saffron samples is possible by electronic nose system. The results based on ANN model also provide high percentage of classification accuracy. The result of ANN method to classify the fraud in saffron is promising to do more research on detection of adulteration in other agricultural and food products by the electronic nose system. Taking into account that this is the first time that an electronic nose was used to analyze saffron, these results indicate that this new array of sensors based on MOS sensors can be a valuable tool to classify saffron samples. In addition, according to the results, the electronic nose can be used for the detection of these and other adulterants in saffron.
ACKNOWLEDGMENTS
The support of Research Deputy of University of Tehran, Iran is gratefully appreciated.
REFERENCES
- Husaini, A.M.; Wani, S.A.; Sofi, P.; Rather, A.G.; Parray, G.A.; Shikari, A.B.; Mir, J.I. Bioinformatics for saffron (Crocus sativus L.) improvement. Communications in Biometry and Crop Science 2009, 4 (1), 3–8.
- Rios, J.L.; Recio, M.C.; Giner, R.M.; Manez, S. An update review of saffron and its active compounds. Phytotherapy Research 1996, 10, 189–193.
- Singh, A.K.; Singh, L.; Verma, N. Extent and pattern of agro- morphological diversity in saffron (Crocus Sativus L.) From Jammu and Kashmir in India. Society for Recent Development in Agriculture 2010, 10 (1), 232–239.
- Campo, P.C.; Garde-Cerdan, T.; Sanchez, A.M.; Maggi, L.; Carmona, M.; Gonzalo, L.A. Determination of free amino acids and ammonium ion in saffron (Crocus sativus L.) from different geographical origins. Food Chemistry 2009, 114, 1542–1548.
- Kianbakht, S.; Mozaffari, K. Effects of saffron and its active constituents, Crocin and Safranal, on prevention of indomethacin induced gastric ulcers in diabetic and non-diabetic rats. Journal of Medicinal Plants 2009, 8 (5), 30–38.
- Ghorbani, M. The efficiency of saffron’s marketing channel in Iran. World Applied Sciences Journal 2008, 4 (4), 523–527.
- Sujata, V.; Ravishankar, G.A.; Venkataraman, L.V. Methods for the analysis of the saffron metabolites crocin, crocetins, picrocrocin, and safranal for the determination of the quality of the spice using thin-layer chromatography, high-performance liquid chromatography and gas chromatography. Journal of Chromatography 1992, 624, 497–502.
- Lage, M.; Cantrell, C.L. Quantification of saffron (Crocus sativus L.) metabolites crocins, picrocrocin, and safranal for quality determination of the spice grown under different environmental Moroccan conditions. Scientia Horticulturae 2009, 121, 366–373.
- Bongsoo, N. Electronic nose for detection of food flavor and volatile components. In: Emerging Technologies for Food Quality and Food Safety Evaluation; Taylor and Francis Group: 2011; Chapter 9, 235–255.
- Javanmardi, N.; Bagheri, A.; Moshtaghi, N.; Sharifi, A.; Hemati-Kakhki, A. Identification of safflower as a fraud in commercial saffron using RAPD/SCAR marker. Journal of Cell and Molecular Research 2011, 3 (1), 31–37.
- Remington, J.P.; Horatio, C.; Wood, O. The dispensatory of the United States of America. 1918. http://www.henriettesherbal.com/eclectic/usdisp/crocus.html (accessed in 2014).
- Babaei, S.; Talebi, M.; Bahar, M. Developing an SCAR and ITS reliable multiplex PCR-based assay for safflower adulterant detection in saffron samples. Food Control 2014, 35, 323–328.
- Rohman, A.; Che Man, Y.B. Authentication of extra virgin olive oil from sesame oil using FTIR spectroscopy and gas chromatography. International Journal of Food Properties 2012, 15 (6), 1309–1318.
- Scott, S.M.; James, D.; Zulfiqur, A. Data analysis for electronic nose systems. Microchimica Acta 2007, 156, 183–207.
- Schaller, E.; Bosset, J.O.; Escher, F. Electronic noses and their application to food. Lebensmittel Wissenschaf Und Technologie 1998, 31 (4), 305–316.
- Mahmoudi, E. Electronic nose technology and its applications. Sensors & Transducers Journal 2009, 107 (8), 17–25.
- Persaud, K.; Dodd, G. Analysis of discrimination mechanisms in the mammalian olfactory system using a model nose. Nature 1982, 23, 299–352.
- Ciosek, P.; Wroblewski, W. Sensor arrays for liquid sensing—electronic tongue systems. Analyst 2007, 10, 963–978.
- Zheng, H.; Wang, J. Detection of adulteration in camellia seed oil and sesame oil using an electronic nose. European Journal of Lipid Science Technology 2006, 108, 116–124.
- Ramasamy, R.; Prakash, M.; Keshava Bhat, K. Characterization of aroma active compounds of cumin (Cuminum cyminum L.) by GC-MS, e-nose, and sensory techniques. International Journal of Food Properties 2013, 16 (5), 1048–1058.
- Arshak, K.; Moore, E.; Lyons, G.M.; Harris, J.; Clifford, S. A review of gas sensors employed in electronic nose applications. Sensor Review 2004, 24 (2), 181–198.
- Ghasemi-Varnamkhasti, M.; Mohtasebi, S.S.; Rodriguez-Mendez, M.L.; Lozano, J.; Razavi, S.H.; Ahmadi, H. Potential application of electronic nose technology in brewery. Trends in Food Science & Technology 2011, 22, 165–174.
- Mildner-Szkudlarz, S.; Jelen, H. The potential of different techniques for volatile compounds analysis coupled with PCA for the detection of the adulteration of olive oil with hazelnut oil. Food Chemistry 2008, 110, 751–761.
- Son, H.J.; Kang, J.H.; Hong, E.J.; Lim, C.R.; Choi, J.Y.; Noh, B.S. Authentication of sesame oil with addition of perilla oil using electronic nose based on mass spectrometry. Korean Journal of Food Science & Technology 2009, 41, 609–614.
- Carmona, M.; Martinez, J.; Zalacain, A.; Rodriguez-Mendez, M.L.; Saja, J.A.; Alonso, G.L. Analysis of saffron volatile fraction by TD-GC-MS and e-nose. European Food Research Technology 2006, 223, 96–101.
- Anonymous. www.saffron.com (accessed in 2014).
- Jurs, P.C.; Bakken, G.A.; McClelland, H.E. Computational methods for the analysis of chemical sensor array data from volatile analytes. Chemical Reviews 2000, 100, 2649–2678.
- Rock, F.; Barsan, N.; Weimar, U. Electronic nose: Current status and future trends. Chemical Reviews 2008, 108, 705–725.
- Craven, M.A.; Gardner, J.W.; Bartlett, P.N. Electronic noses development and future prospects. Trends in Analytical Chemistry 1996, 15, 486–493.
- Rajamaki, T.; Alakomi, H.L.; Ritvanen, T.; Skytta, E.; Smolander, M.; Ahvenainen, R. Application of an electronic nose for quality assessment of modified atmosphere packaged poultry meat. Food Control 2006, 17, 5–13.
- Heidarbeigi, K.; Ahmadi, H.; Omid, M.; Tabatabaeefar, A. Evolving an artificial neural network classifier for condition monitoring of Massy Ferguson tractor gearbox. International Journal of Applied Engineering Research 2010, 5 (12), 2097–2107.
- Haykin, S. Neural networks: A comprehensive foundation. Prentice Hall: New Jersey, 1999.