
Abstract
In this work, the response surface methodology was used to determine the optimum level of input variables, gluten deformation index (mm) and the level of grape seed flour (%) addition in wheat flour that improve falling number index and Mixolab dough rheological parameters. The full factorial model was the best compatible model which fitted to each response. A replacement dose of 4.08% in wheat flour with gluten deformation index value of 8.27 mm was found optimal. The influence of optimum values of variables on dough microstructure has been investigated using epifluorescence light microscopy.
INTRODUCTION
Grape seeds are by-products which could be regarded as an excellent ingredient for food products due to their chemical composition: oil, protein, fibers, phenol complexes including tannin, sugars, etc.[Citation1–Citation6] They are also an excellent source of some useful minerals, such as calcium, phosphorus, and potassium.[Citation7] In addition, grape seeds are a good source of polyphenols[Citation8,Citation9] which contain a wide variety of proanthocyanidins with a strong antiradical action and components with a polar chemical structure that are heat resistant.[Citation10,Citation11] Currently, grape seeds are recognized as a rich source of natural antioxidants and other bioactive compounds[Citation12,Citation13] with several beneficial effects on human health, acting as antioxidant, anti-ulcer,[Citation8] anticarcinogen,[Citation14] cardioprotective,[Citation15] anti-inflamatory,[Citation16] antimicrobial, and neuro-protective agents.[Citation17] Due to health supporting properties and nutrient profile of grape seeds, these can be used as a potential source of non-wheat flours (WFs) in the formulation of composite flour for bread-making technology.
Different studies have highlighted the effects of different doses of grape seed flour (GSF) addition on dough rheological behavior and bread quality. For example, the replacement of WF with GSF at levels of 2.5, 5.7, and 10 g GSF/100 g WF in bread making increased the total phenolic content of the bread and dough, and influenced the sensory profile of the bread as evaluated by consumers.[Citation18] The replacement of WF with up 10% GSF increased the nutritional value of bakery products without influencing negatively dough rheological and sensorial bread characteristics.[Citation19] The bread antioxidant activity increased significantly with the increased dose of GSF substitution at the levels of 2.5, 5, and 7.5 g GSF/100 g WF.[Citation20,Citation21] GSF increased the dough development time at a level of 5.0%, but did not change it very much at the levels of 2.5 and 7.5%. When testing it at Farinograph, the dough stability (ST) value increased from 6.4 to 12.3 min with the increase of GSF content from 0 to 7.5%, mixing tolerance index decreased from 41.1 to 6.4 Brabender Units and dough extensibility value was higher in GSF added dough than in the control.[Citation20] Also, other studies revealed that the substitution of WF with GSF at the levels of 3, 5, and 7 g GSF/100 g WF has the effect of decreasing the falling number (FN) index, of increasing the alpha-amylase activity in wheat-grape seed composite flour and of improving the dough rheological properties simultaneously with the increasing dose of the GSF substitution level.[Citation22] GSF has been developed to add value to the crop and to improve the nutritional value of bakery products,[Citation19] fact that will lead to a good balance of high antioxidant activity with consumer acceptability.[Citation23]
The main problem in the use of GSF in higher quantities in WF is the inferior baking quality and consumer acceptability. Studies showed that with the increase of GSF replacement in WF bread, bread brightness and volume decreased; a higher GSF replacement (>7.5 g GSF/100 g WF) led to a lower sensory acceptance of astringency and sweetness.[Citation18] The presence of large particles in flour might puncture the expending gas cells during fermentation, reducing loaf volume. Moreover the large particles of flour could result in a rough and speckled exterior bread loaf appearance.[Citation24] However, GSF is devoid of gluten and its addition to wheat affects WF’s physicochemical, dough rheological, handling, and bread making properties.
It is known that the baking quality is significantly influenced by dough microstructure and dough rheological behavior.[Citation25,Citation26] Therefore, it was considered useful to study the effect of WF quality and the added GSF dose on dough microstructure and rheology. Mixolab, a tool providing information on water absorption, the protein strength, and the starch behavior during cooking, was used as a rheological device. A epifluorescence light microscopy (EFLM) based on a fluorescence technique according to Peighambardoust et al.[Citation27] and Codină and Mironeasa[Citation28] was used to study dough microstructure.
The aim of this study was to determine the optimum GSF-level value that may be used in WF dough by using experimental design and response surface model in order to obtain optimum values for FN index and Mixolab rheological properties that may lead to a high bread quality. Dough microstructure was also determined by EFLM for the optimum dose established by this statistical technique. In our study, statistical technique response surface methodology (RSM) was used to determine the optimum process variable combinations which improve FN index and rheological parameters of formulated dough’s assessed by the Mixolab device. To the best of the author’s knowledge, this kind of statistical technique has not yet been used to establish the optimum GSF dose that can be added in WF dough in order to obtain high-quality bread.
MATERIALS AND METHODS
Flour Characteristics
Two commercial WFs, of different quality parameters, with a gluten deformation index (GDI) of 4 mm (WF1) and GDI of 14 mm (WF2) respectively, milled at S.C. MOPAN S.A. Suceava County, Romania were used. GDI is a parameter used to establish the gluten quality, respectively, to assessment the gluten elasticity and viscosity. It determination is based on the relationship between gluten quality and it ability to deform when it left to rest, it deformation being higher as it quality is lower. GSF of particle size at 200–150 μm was obtained from grape seeds through mechanical milling. The grape seeds, Aligoté variety growing in Romania, were collected at their commercial maturity from the Odobeşti ecosystem, viticulture center Jariştea. The seeds were directly obtained by manual separation from dried grape pomace in open air.
The quality characteristics of the WF samples were determined according to the Romanian or International Cereal Chemistry methods: GDI (SR 90:2007), ash content (ICC method 104/1), moisture content (ICC method 110/1), wet gluten content (ICC method 106/2), and FN index (ICC method 107/1).
The analytical parameters of grape seeds were made according to standard analysis methods: moisture content (SR EN ISO 665:2003), raw fat content (SR EN ISO 659:2009), raw protein content (SR EN ISO 20483:2007), and ash, as a percentage of the dried substance (SR ISO 2171:2009). Carbohydrate content was determined as a difference of mean values: 100 – (the quantity in percentage of the moisture content, ash, protein, and oil).[Citation29] When calculating the protein content, the general factor 6.25 was used. The analyses were made in triplicate, and the values of the parameters are the average expression ± standard deviation.
Experimental Design
The effect of two levels for WF quality parameters, corresponding to GDI of 4 mm and 14 mm, respectively, and the effect of four levels (0, 3, 5, and 7%) for the dose of GSF added in WF on FN index and Mixolab rheological parameters (dependent variables) were investigated using the RSM by means of full factorial design with two independent variables. Based on the experimental design results, the two factor interaction (2FI) models were developed to predict the FN index and rheological parameters, derived from the Mixolab as a functional combination of design variables, GDI and level of GSF added in WF. All the models were statistically validated using F-ratio test. The graphical response surfaces analysis was employed to identify and discuss the main and interaction effects of factors on responses.
Rheological Characteristics of Samples Formulation
Rheological analysis of samples formulation according to the experimental design () was performed using the Mixolab device (Chopin, Tripette et Renaud, Paris, France) with standard option “Chopin+” protocol. This equipment is able to measure the torque (N·m) produce during different stages of dough formation, in function of temperature and time. The settings used in the study were the mixing temperature at 30°C, heating rate of 4°C/min up to 90°C, cooling rate of 4°C/min up to 50°C and total analysis time of 45 min. The rheological characteristics of samples formulation were assessed for the following Mixolab parameters: dough stability (ST), C1 torque, i.e., the maximum torque during mixing, C2 torque, i.e., minimum value of torque indicating the protein weakening based on the mechanical work and the increasing temperature, difference between torques C1 and C2 (C1-2), i.e., the protein network strength under increased heating, C3 torque, i.e., the maximum torque produced during the heating stage expressing the starch gelatinization, difference between torques C3 and C2 (C3-2), i.e., the gelatinization rate, C4 torque, i.e., the ST of the starch gel formed, C5 torques, i.e., the starch retrogradation during the cooling stage and difference between torques C5 and C4 (C5-4), i.e., the indicator of bread shelf life. More details about the protocol and Mixolab parameters were reported in our previous studies.[Citation28,Citation30]
TABLE 1 The values of independent variables used in full factorial design with responses
Microscopy
Dough microstructure was evaluated by EFLM using a fluorescence technique. For the fluorescence microscopic examination, the samples formulation of WF dough were stained with specific fluorochromes to detect simultaneously starch and protein distribution.[Citation31] The protein phase is stained with rhodamine and is shown in red and starch granules by fluorescein isothiocyanate, in green. The dough samples were observed with Motic AE 31 (Motic-Optic Industrial Group Co. Ltd. Xiamen, China) epifluorescence microscope operated by a catadioptric objectives LWD PH 20× (N.A. 0.4). Raw images were acquired using Digital Color Camera Moticam 2300 in JPG format using RGB mode (12 bits per each channel) with a resolution of 1280 × 1024 pixels (300 dpi). Image analysis were processed by using an ImageJ (version 1.45, National Institutes of Health, Bethesda, MD, USA) processing program acording to Codină and Mironeasa.[Citation28]
Statistical Analysis
A second order regression equation (Eq. [Citation1]) was applied, in order to fit the response variables:
where Y is the response variable; βo is a constant; β1, β2, β11, β22, and β12 are the linear, quadratic, and interaction coefficients, respectively, and X1, X2 are the independent variables.
Stat-Ease Design Expert 7.0.0 software package (trial version) was used to determine the effects of the independent variables, to calculate regression coefficients, to carry out analysis of variance (ANOVA) and to build the response surface, at a 95% confidence level. The models of each response were expressed in terms of real values of the independent variables and only the statistically significant terms (p < 0.05) have been used to analyze the behavior of the fitted mathematical models. The optimal values of the process parameters were obtained by the desirability function, a multi-response analysis, proposed by Derringer and Suich.[Citation32]
RESULTS AND DISCUSSION
Flour Characteristics
The analytical characteristics of WF samples used in this study are shown in . The ash content was 0.59 and 0.61 for WF1 and WF2, respectively. These flours belong to two categories, namely strong and good flour for bread making according to the Romanian standard SR 877:1996. Both flours had a low alpha-amylase activity. The chemical composition of grape seeds, determined as a percentage from dried substance was shown in . The greatest amount is represented by the carbohydrate content. According to some studies[Citation33,Citation34] fibers (non-digestible carbohydrates) are in the highest quantity. From the digestible carbohydrates fructose is present in the greatest amount, followed by glucose with no significant values for the rest of the sugars.[Citation35]
TABLE 2 Quality characteristics of wheat flour (mean value ± standard deviation)
TABLE 3 Parameters of the grape seed used for obtaining grape seed flour
FN Index and Rheological Characteristics of Samples Formulation
The results for the FN index and Mixolab rheological parameters performed accordingly to the experimental design are shown in .
Statistical Analysis and Response Surface
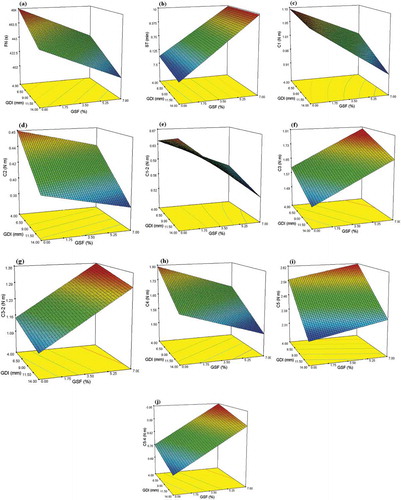
The ANOVA results highlight that the regression models obtained for dependent variables were statistically relevant, with a significance level ranging from p < 0.0001 to p < 0.001. The fitted models represented well the experimental data with high coefficients of determination (R2), varying from 0.8549 to 0.9968, depending on the investigated responses, indicating that above 85% of the variability in the response could be explained by the model. These results suggest that the models fitted for the FN index and rheological parameters assessed by Mixolab lead to significant regression, low residual values and no lack-of-fit. –j show the effect of GDI and level of GSF added in WF on FN index and rheological parameters assessed by Mixolab.
FIGURE 1 Response surface plots showing the combined effects of gluten deformation index (GDI) and grape seed flour level (GSF) on: A: falling number (FN); B: dough stability (ST); C: C1 torque (C1); D: C2 torque (C2); E: difference between torques C1 and C2 (C1-2); F: C 3 torque (C3); G: difference between torques C3 and C2 (C3-2); H: C 4 torque (C4); I: C 5 torque (C5); and J: difference between torques C5 and C4 (C5-4).
FN Index
The regression model calculated for FN index was:
where Y1 is the FN index response (FN, s) and X1 and X2 are the real values of GDI (mm) and GSF level added in WF (GSF, %), respectively. The regression model (Eq. [Citation2]) indicated that FN index was highly significant (p < 0.0001) for the linear terms of GDI and for the level of GSF added in WF. The negative coefficient of the first-order term of GDI indicated that FN index of composite flour decreased with the increase of GDI of WF. Meanwhile, the negative coefficient of GSF level also led to a decrease of FN index. ANOVA for the 2FI model as fitted to experimental results showed significance (p < 0.05), whereas lack-of-fit was insignificant (p > 0.05). The FN index ranged from 400 to 484 s for the composite flours’ formulation. Decrease in FN value with the increase in GSF level added in WF may be attributed to increased activity of alpha-amylase in composite flour.[Citation22] This alpha-amylase activity increase can be due by the high level of calcium content from GSF,[Citation7] which stabilizes alpha-amylase,[Citation36] a calcium metalloenzime, unable to function in the absence of calcium.[Citation37] The effect of GDI and GSF level on FN index is shown in . An increase in GDI value led to an increase in the FN index value. These values increased with the increase dose of GSF addition in WF dough. Increasing the GSF level in WF dough led to a decrease in the FN value of 436.78 s at 6.75% GSF level and a value of GDI of 5.39 mm. FN index decreased at 404.59 s for a 6.78% GSF level added in WF with a value of GDI of 13.70 mm.
Dough Physical Characteristics Obtained with the Mixolab Device
Dough ST
The 2FI model describing dough ST as a simultaneous function of GDI and level of GSF added in WF is presented as follows:
where Y2 is the ST response. Dough ST was significantly affected (p < 0.0001) by the GDI and by the level of GSF added in WF. The interaction term of GDI and GSF level (X1X2) was found to be significant (p < 0.05). The regression model (Eq. [Citation3]) fitted to the experimental results of dough ST showed higher coefficient of determination (R2 = 0.9968). The F-value for ST was significant with an insignificant lack-of-fit (p > 0.05). The dough ST ranged from 7.5 to 10.02 min for the composite flours’ formulation. An increase in GDI decreased significantly (p < 0.05) dough ST. A decrease in ST with increasing value of GDI was probably due to gluten quality which was more extensible and presented lower stretch. The ST increased significantly (p < 0.0001) as the level dose of GSF increased. This may be due probably to the high content of lipids that can be found in the composition of grape seeds, these ones being able to form lipoprotein complexes between starch, gluten and other hydrophobic components, thus leading to the compaction and stabilization of dough.[Citation38] The effect of GDI of WF and GSF levels added in WF on dough ST is shown in . Response surface plot showed that an increase level of GSF with decreasing of GDI increased the dough ST. A decrease in GDI at 5.39 mm increased the dough ST at 9.88 min at a level of GSF of 6.75%. An increase in GDI at 13.70 mm increased the dough ST at 9.88 min at a level of GSF of 6.78%.
Maximum torque during mixing, C1
The model of response surface for C1 torque is represented by the Eq. (4)
where Y3 is the C1 response. The results of regression analysis for the C1 torque demonstrated that the linear terms of GDI and GSF value as well as the interaction term between these terms were statistically significant. All linear regression coefficients showed the negative effect of C1 torque. They complied with previous observations[Citation39] that suggested that the increase level of GSF added in WF led to a decrease in C1 torque value ().
Minimum torque—measure of protein weakening, C2
The regression equation for C2 parameter, which measures the protein weakening, at GDI and GSF levels was:
where Y4 is the C2 response. It was observed that GDI and GSF level had highly significant negative linear effect (p > 0.0001 and p > 0.05) on C2 torque, while the interaction terms between GDI and GSF level had a insignificant effect (p > 0.05; Eq. 5). The regression model fitted to the experimental results of C2 showed a higher coefficient of determination (R2 = 0.9236). The F-value for C2 which was significant with an insignificant lack-of-fit (p > 0.05). The C2 torque was decreased with the increase GDI and GSF. The decrease in C2 with the increase of GSF level may be attributed to the gluten dilution, thus losing some of its elasticity and becoming more extensible and less resistant.[Citation22] It was observed that the increase of GSF level with the increase level of GDI in WF decreased C2 torque () probably due to the activity intensification of proteolytic enzymes.
Difference between torques C1 and C2
The regression model for the difference between torques C1 and C2 (C1-2), which indicates the protein network strength under increased heating, is given by the Eq. (6):
where Y5 is the C1-2 response. The ANOVA revealed that the model adequately fitted to the experimental data for Mixolab value C1-2. It can be seen that the main effect of GSF and interaction terms between GDI and GSF level (X1X2) exhibited strong significant effect on C1-2, while the main effect for GDI did not show significant effect on C1-2. The R2 value was high this indicating that 0.96 of the total variation was explained by the model and only 0.04 of the total variation was unexplained. The relative contribution of each factor to response variable C1-2 was measured directly by the regression coefficient in the fitted model. A positive sign for the regression coefficient indicated that the ability of the GDI (X1) factor increased the C1-2, while the negative sign indicated the ability of factors GSF (X2) and (X1X2) decreased the C1-2 response value. The effect of GDI of WF and GSF level added in WF on protein network strength under increased heating is shown in .
Maximum torque—measure of starch gelatinization, C3
The regression model obtained for C3 torque (Eq. 7), which represent maximum consistency during starch gelatinization, showed higher coefficient of determination (R2 = 0.93). It was observed that GDI and GSF level had highly significant linear effect (p < 0.001) on C3.
where Y6 is the C3 response. The negative coefficient of X1 indicated that C3 increased with the decrease of GDI. A positive influence of GSF level (X2) was found on C3, which increased possibly due to quick rupture of starch granules which determined a lower pasting temperature and a higher paste consistency. This fact is because of the slight increase of free water quantity in dough, after the increase activity of the alpha amylase in the dough with the GSF addition in WF. The free water will be absorbed by the grape seed components which will lead to a higher dough viscosity. The F-value for C3 was significant (p > 0.05), whereas lack-of-fit was not significant (p < 0.05). The response surface graph showed that C3 torque increased with the increase of level of GSF, whereas it decreased with the increase of value of GDI of WF as shown in .
Difference between torques C3 and C2
The response surface for difference between C3 and C2 (C3-2) torques is described by the equation:
where Y7 is the C3-2 response. C3-2 was significantly affected (p < 0.05) by the linear term of GSF level, but it was not significantly (p > 0.05) dependent on GDI of WF. The positive coefficient of GSF (Eq. 8) indicated that C3-2 increased with the increase of value of this variable. The regression model fitted to the experimental results of C3-2 showed a higher coefficient of determination (R2 = 0.88). The F-value for C3-2 was significant with an insignificant lack-of-fit (p > 0.05). The effect of GDI of WF and GSF level on C32 is shown in . The response surface plot showed that an increased level of GSF with a decrease of GDI value led to an increase of C3-2.
Minimum torque—measure of starch gel ST, C4
The regression model for C4 torque, which represents the ST of the starch gel formed, is given by Eq. (9):
where Y8 is the C4 response. The regression model obtained is satisfactory since the value of the coefficient of determination (R2) was high and close to 1. The value of R2 indicated that 0.96 of the total variation was explained by the model and only 0.04 of the total variation was unexplained. The relative contribution of each factor to response variable (C4) was measured directly by the regression coefficient in the fitted model. The negative sign for the regression coefficients in the fitted model indicated the ability of a factor to decrease the response variable C4 (). The results of ANOVA for dependent variable C4 indicated that the model fitted adequately to the experimental data for C4 torque. The effect for GDI and GSF exhibited strong significant effect on C4. This can be explained by the fact that the amylolytic activity of alpha-amylase in flour is increased by GSF addition, and thus the consistency of dough decreases.[Citation22]
Maximum torque—measure of starch retrogradation, C5
The regression analysis result indicated that maximum consistency during starch retrogradation (C5) was highly significant (p < 0.0001) on linear term of GDI (X1) and GSF level (X2) added in WF. The regression equation obtained for C5 torque was the following:
where Y9 is the C5 response. The negative coefficient of GDI (X1; Eq. 10) indicated that C5 torque increased with the decrease of this variable while positive coefficient of GSF (X2) showed an increase in C5. An increase in C5 torque with the increase in GSF level may be attributed to the increase of α-amylase activity in wheat-grape seed composite flours and the lipid content in GSF that is higher.[Citation22] The ANOVA for the 2FI model of C5 torque as fitted to experimental results showed significance (p < 0.05). The coefficient of determination (R2) for C5 torque was 0.99. The F-value for C5 torque was significant (p < 0.05), whereas lack-of-fit was insignificant (p > 0.05). The response surface graph showed that C5 torque decreased with the increase of GDI of WF, whereas increased with the increase level of GSF as shown in .
Difference between torques C5 and C4
Multiple regression equation was generated related to the difference between torques C5 and C4 (C5-4) to actual levels of the variables. The model was developed as follows:
where Y10 is the C5-4 response. The difference of the points C5-4 was significantly affected by terms of GDI (X1) and GSF level (X2) at p < 0.01 and p < 0.0001, respectively. The regression model (Eq. [Citation11]) fitted to the experimental results of the difference between torques C5-4 showed higher coefficient of determination (R2 = 0.95). The F-value for C5-4 was significant (p < 0.0001) with an insignificant lack-of-fit (p > 0.05). showed that C5-4 increased when the GSF level was increased; however, at a maximum level of GSF (7%), C5-4 at value of 0.86 N·m was obtained.
Microscopy
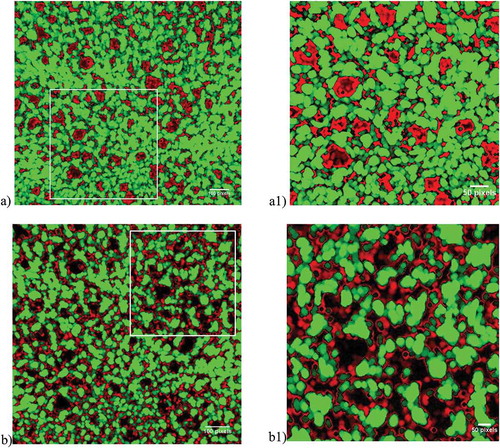
WF dough with 0 and 4.08% (w/w on flour basis) GSF (%) addition were analyzed by EFLM ( and ). The dough samples obtained were formed by mixing for 5 min. The examination of the control dough microstructure () showed starch granules surrounded continuously by the gluten matrix. WF dough was presented like a homogeneous network of starch and gluten which was interconnected each other. The comparison of the dough sample with GSF addition () with the control sample showed a dough structure that had been changed dramatically. The dough structure was less coherent, with great disruption of the gluten matrix. The starch granules were less associated with the dough gluten. In this image, small areas did not interact with the gluten and starch matrix. This discontinuous network could be a result from the interaction between gluten protein and GSF which broke the gluten starch structure. Even so, this structure had not affected negatively the Mixolab rheological data yet, probably due to the low dose of GSF addition in WF.
FIGURE 2 Microstructure taken by EFLM of wheat dough with A: 0% grape seed flour and B: 4.08% grape seed flour. Green are starch granules, while red is protein. Images (a1) and (b1; 1x1 pixels, bars = 50 pixels) are higher magnification images of (a) and (b; 2 x 2 mm, bars = 100 pixels) at positions indicated by the squares.
Optimization
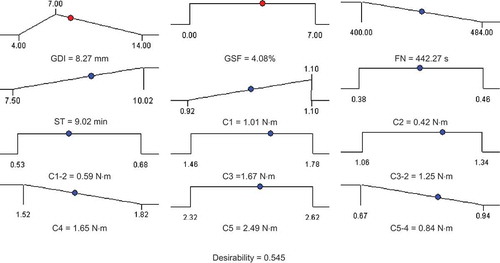
Simultaneous optimizations of the multiple responses were applied for the minimum FN index; maximum ST and C1 torque; C2 torque, difference between torques C1 and C2 (C1-2), C3 torque, difference between torques C3 and C2 (C3-2), C5 torque in the range, minimum value of C4 torque and difference between torques C5 and C4 (C5-4). These criteria were chosen taking into account the correlations obtained between FN index and dough ST[Citation40,Citation41] and the relationships found between FN and Mixolab parameters C4 and C5-4.[Citation38] Applying the methodology of desired function, the optimum level of independent variables was obtained and it indicated a GDI of 8.27 mm and a GSF level of 4.08%. Under these optimum conditions, the predicted FN index of 442.28 s, dough ST of 9.02 min, C1 of 1.01, C2 of 0.42, C1-2 of 0.59, C 3 of 1.67, C3-2 of 1.25, C4 of 1.65, C5 of 2.49, and C5-4 of 0.84 N·m were obtained with a desirability function score of 0.559. A desirability ramp was developed for the optimized conditions and is shown in , indicating the optimized conditions obtained in this study.
FIGURE 3 Desirability ramp for optimized.
CONCLUSIONS
In the present work it was showed that the dough microstructure, its rheological properties, and its alpha-amylase activity were significantly affected by GSF addition. The microstructure sample with GSF addition was characterized by some disruption of the gluten and starch matrix. Regarding the dough rheological properties and alpha-amylase activity, optimization process revealed that the best results were obtained for a dose of 4.08% GSF added in WF with GDI value of 8.27 mm. The models can be used to predict quality of the composite flour based on WF and dough rheological behavior using parameters that are usually and easily determinate by the processors of bread making.
ACKNOWLEDGMENT
The authors would like to thank to S.C. Enzymes & Derivates S.A., Romania, for technical support.
REFERENCES
- Bravi, M.; Spinoglio, F.; Verdone, N.; Adami, M.; Aliboni, A.; D’Andrea, A.; De Santis, A.; Ferri, D. Improving the Extraction of -Tocopherol-Enriched Oil from Grape Seed by Supercritical CO2. Optimization of the Extraction Conditions. Journal of Food Engineering 2007, 78, 488–493.
- Martinello, M.; Hecker, G.; Pramparo, M.D.C. Grape Seed Oil Deacidification by Molecular Distillation: Analysis of Operative Variables Influence Using the Response Surface Methodology. Journal of Food Engineering 2007, 81, 60–64.
- Kim, S.Y.; Jeong, S.M.; Park, W.P.; Nam, K.C.; Ahn, D.U.; Lee, S.C. Effect of Heating Conditions of Grape Seeds on the Antioxidant Activity of Grape Seed Extracts. Food Chemistry 2006, 97, 472–479.
- Cao, X.; Ito, Y. Supercritical Fluid Extraction of Grape Seed Oil and Subsequent Separation of Free Fatty Acids by High-Speed Counter-Current Chromatography. Journal of Chromatography A 2003, 1021, 117–124.
- Sovová, H.; Kučera, J.; Jež, J. Rate of the Vegetable Oil Extraction with Supercritical CO2-II. Extraction of Grape Oil. Chemical Engineering Science 1994, 49, 415–420.
- Gómez, A.M.; López, C.P.; De La Ossa, E.M. Recovery of Grape Seed Oil by Liquid and Supercritical Carbon Dioxide Extraction: A Comparison with Conventional Solvent Extraction. The Chemical Engineering Journal and the Biochemical Engineering Journal 1996, 61, 227–231.
- Mironeasa, S.; Mironeasa, C.; Codină, G.G. Evaluation of Mineral Element Content in Grape Seed and Defatted Grape Seed. Food and Environment Safety 2010, IX, 53–60.
- Saito, M.; Hosoyama, H.; Ariga, T.; Kataoka, S.; Yamaji, N. Antiulcer Activity of Grape Seed Extract and Procyanidins. Journal of Agricultural and Food Chemistry 1998, 46, 1460–1464.
- Katalinic, V.; Mozina, S.S.; Generalic, I.; Skroza, D.; Ljubenkov, I.; Klancnik, A. Phenolic Profile, Antioxidant Capacity, and Antimicrobial Activity of Leaf Extracts from Six Vitis Viniferea L. Varieties. International Journal of Food Properties 2013, 16, 45–60.
- Joshi, S.S.; Kuszynski, C.A.; Bagchi, D. The Cellular and Molecular Basis of Health Benefits of Grape Seed Proanthocyanidin Extract. Current Pharmaceutical Biotechnology 2001, 2, 187–200.
- Nakamura, Y.; Tsuji, S.; Tonogai, Y. Analysis of Proanthocyanidins in Grape Seed Extracts, Health Foods, and Grape Seed Oils. Journal of Health Science 2003, 49, 45–54.
- Luther, M.; Parry, J.; Moore, J.; Meng, J.; Zhang, Y.; Cheng, Z.; Yu, L. Inhibitory Effect of Chardonnay and Black Raspberry Seed Extracts on Lipid Oxidation in Fish Oil and Their Radical Scavenging and Antimicrobial Properties. Food Chemistry 2007, 104, 1065–1073.
- Yemis, O.; Bakkalbasi, E.; Artik, N. Antioxidative Activities of Grape (Vitis Vinifera) Seed Extracts Obtained from Different Varieties Grown in Turkey. International Journal of Food Science and Technology 2008, 43, 154–159.
- Hertog, M.G.; Bueno-de-Mesquita, H.B.; Fehily, A.M. Fruit and Vegetable Consumption and Cancer Mortality in the Caerphilly Study. Cancer Epidemiology, Biomarkers, & Prevention 1996, 5, 673–677.
- Sato, M.; Maulik, G.; Ray, P.S.; Bagchi, D.; Das, D.K. Cardioprotective Effects of Grape Seed Proanthocyanidin Against Ischemic Reperfusion Injury. Journal of Molecular and Cellular Cardiology 1999, 31, 1289–1297.
- Terra, X.; Valls, J.; Vitrac, X.; Merrillon, J.M.; Ardevol, L.; Arola, L.; Arola, A.; Blade, C.; Fernandez-Larrea, J.; Pujadas, G.; Salvado, J.; Blay, M. Grape-Seed Procyanidins Act As Antiinflammatory Agents in Endotoxin-Stimulated RAW 264.7 Macrophages by Inhibiting Nfkb Signaling Pathway. Journal of Agricultural and Food Chemistry 2007, 55, 4357–4365.
- Aron, P.M.; Kennedy, J.A. Flavan-3-ols: Nature, Occurrence, and Biological Activity. Molecular Nutrition & Food Research 2008, 52, 79–104.
- Hoye, C.; Ross, C. Total Phenolic Content, Consumer Acceptance, and Instrumental Analysis of Bread Made with Grape Seed Flour. Journal of Food Science 2011, 76, S428–S436.
- Munteanu, M.F.; Gligor, R.; Alexa, E.; Poiana, A.M.; Onet, M. Determination of the Nutritional Properties from Grape Seed Flour. Current Opinion in Biotechnology 2013, 24, S115.
- Meral, R.; Doğan, I.S. Grape Seed As a Functional Food Ingredient in Bread-Making. International Journal of Food Sciences and Nutrition 2013, 64, 372–379.
- Acun, S.; Gül, H. Effects of Grape Pomace and Grape Seed Flours on Cookie Quality. Quality Assurance and Safety of Crops & Foods 2014, 6, 81–88.
- Mironeasa, S.; Codină, G.G.; Mironeasa, C. The Effects of Wheat Flour Substitution with Grape Seed Flour on the Rheological Parameters of the Dough Assessed by Mixolab. Journal of Texture Studies 2012, 43, 40–48.
- Rosales Soto, M.U.; Brown, K.; Ross, C.F. Antioxidant Activity and Consumer Acceptance of Grape Seed Flour-Containing Food Products. International Journal of Food Science and Technology 2012, 47, 592–602.
- Crabtree, J.; James, A.W. Composite Flour Technology. TPI’s Experience and Opinions on the Planning and Implementation of National Programmes. Tropical Science 1982, 242, 77–84.
- Autio, K.; Laurikainen, T. Relationships Between Flour/Dough Microstructure and Dough Handling and Baking Properties. Trends in Food Science and Technology 1997, 8, 181–185.
- Wieser, H. Chemistry of Gluten Proteins. Food Microbiology 2007, 24, 115–119.
- Peighambardoust, S.H.; Van der Goot, A.J.; Van Vliet, T.; Hamer, R.J.; Boom, R.M. Microstructure Formation and Rheological Behaviour of Dough under Simple Shear Flow. Journal of Cereal Science 2006, 43, 183–197.
- Codină, G.G.; Mironeasa, S. Influence of Mixing Speed on Dough Microstructure and Rheology. Food Technology and Biotechnology 2013, 51, 509–519.
- Besbes, S.; Blecker, C.; Deroanne, C.; Drir, N.E.; Attia, H. Date Seeds: Chemical Composition and Characteristic Profiles of Lipid Fraction. Food Chemistry 2004, 84, 577–584.
- Codină, G.G.; Mironeasa, S.; Mironeasa, C. Variability and Relationship Among Mixolab and Falling Number Evaluation Based on Influence of Fungal α-Amylase Addition. Journal of the Science of Food and Agriculture 2012, 92, 2162–2170.
- Lee, L.; Ng, P.K.W.; Whallon, J.H.; Steffe, J.F. Relationship Between Rheological Properties and Microstructural Characteristics of Nondeveloped, Partially Developed, and Developed Doughs. Cereal Chemistry 2002, 78, 447–452.
- Derringer, G.; Suich, R. Simultaneous Optimization of Several Response Variables. Journal of Quality Technology 1980, 12, 214–219.
- Murga, R.; Ruíz, R.; Beltrán, S.; Cabezas, J.L. Extraction of Natural Complex Phenols and Tannins from Grape Seeds by Using Supercritical Mixtures of Carbon Dioxide and Alcohol. Journal of Agricultural and Food Chemistry 2000, 48, 3408–3412.
- Kim, S.-Y.; Jeong, S.-M.; Park, W.-P.; Nam, K.C.; Ahn, D.U.; Lee, S.-C. Effect of Heating Conditions of Grape Seeds on the Antioxidant Activity of Grape Seed Extracts. Food Chemistry 2006, 97, 472–479.
- Yamaguchi, F.; Yoshimura, Y.; Nakazawa, H.; Ariga T. Free Radical Scavenging Activity of Grape Seed Extract and Antioxidants by Electron Spin Resonance Spectrometry in An H202inaoh/DMSO System. Journal of Agricultural and Food Chemistry 1999, 47, 2544–2548.
- Oh, H.S.; Kim, K.H.; Suh, S.W.; Choi, M.U. Spectroscopic and Electrophoretic Studies on Structural Stability of α-Amylase from Bacillus Amyloliquefaciens. Korean Journal of Biochemistry 1991, 24, 158–167.
- Vallee, B.L.; Stein, E.A.; Sumerwell, W.N.; Fischer, E.H. Metal Content of Amylases of Various Origins. Journal of Biological Chemistry 1959, 234, 2901–2905.
- Carr, N.O.; Daniels, N.W.R.; Frazier, P.J. Lipid Interactions in Bread Making. Critical Reviews in Food Science and Nutrition 1992, 31, 237–258.
- Codină, G.G.; Mironeasa, S.; Mironeasa, C. Evaluation of Strong Wheat Type 650 Flour Parameters with the Farinograph Instrument. Bulletin of University of Agricultural Sciences and Veterinary Medicine Cluj-Napoca. UASVM. Animal Science and Biotechnologies 2011, 68, 418.
- Codină, G.G.; Mironeasa, S.; Bordei, D.; Leahu, A. Mixolab Versus Alveograph and Falling Number. Czech Journal of Food Science 2010, 28, 185–191.
- Codină, G.G.; Mironeasa, S.; Mironeasa, C.; Popa, C.N.; Tamba-Berehoiu, R. Wheat Flour Dough Alveograph Characteristics Predicted by Mixolab Regression Models. Journal of the Science of Food and Agriculture 2012, 92, 638–644.