
Abstract
The present study was conducted to determine the genetic variability of two major health-promoting bioactive components in lentil (lens culinaris L.) cultivars. The total dietary fiber content in lentil genotypes was analyzed using a combination of enzymatic and gravimetric methods utilizing the Total Dietary Fiber Assay Kit (Sigma Chemicals, St. Louis, USA). The total dietary fiber varied significantly in the range of 10 ± 1 to 21 ± 1 g/100 g lentil dry seed weight with an average of 15.0 g/100 g lentil dry seed weight (p < 0.1). Further, a significant genotypic difference was also recorded in the lentil genotypes (p < 0.1) for folate content which was estimated using the trienzyme extraction and high-performance liquid chromatography method with an average value of 222 µg/100 g lentil dry seed weight. The range of variability for folate content was 114 ± 3 to 330 ± 7 µg/100 g dry seed weight, except in one of the genotype IG-163, where the folate content was recorded as high as 448 ± 7 µg/100 g dry seed weight. The mean total dietary fiber and folate content of Mediterranean landraces of lentil was higher (18 g/100 g and 247 µg/100 g lentil dry seed weight) as compared to the other genotypes (15 g/100 g and 198 µg/100 g lentil dry seed weight), respectively.
INTRODUCTION
Lentil (Lens culinaris L.), a cool-season food legume, is a good source of protein, carbohydrates, essential fatty acids, and a range of vitamins and minerals.[1] It has a unique profile of carbohydrates including several healthful prebiotic compounds: raffinose-family oligosaccharides (RFO), fructooligosaccharides (FOS), sugar alcohols, and resistant starch (RS)[2] which contributes to its low glycemic index.[3] These prebiotic components directly or indirectly, play a role in satiating,[4] and the cholesterol-reducing response[5] of the lentil. The dietary fiber has been demonstrated as a healthy food component with hypoglycemic effect.[6] Lentil seeds are typically high in fiber, of this, approximately one-third to three-quarters is insoluble fiber and the remaining is soluble fiber.[7–9] Another important bioactive component in lentils is vitamin B9 or folic acid (folate). An adequate intake of folate helps in reducing the risk of early embryonic brain development, specifically neural tube defects (NTDs),[10] colon cancer,[11] and brain disorders.[12] Folate deficiency is also associated with elevation of the homocysteine level, which is an independent risk factor for cardiovascular disease.[13] Humans are unable to synthesize folates, hence it must be obtained from food and supplements. Most staple food crops, including cereals are poor source of dietary folates and diets based on these foods often do not fulfil the RDA for folate. These health benefits reflect the nutritional significance of folic acid and dietary fiber, and have attracted the consumer to fiber- and folic acid-rich foods. Public health organizations also recommended an increase in the daily consumption of folic acid and dietary fiber.[14,15] Over the past two decades, the estimation of folate and dietary fiber has been receiving much attention.[16] Therefore, this study was planned to standardize a reliable and reproducible methodology for quantification of dietary fiber and also total folate and survey the genetic variability for these two important nutritional traits in available lentil germplasm and identify the genotypes high in dietary fiber and bioavailable folates.
MATERIALS AND METHOD
Lentil seeds (dehulled) of 30 different genotypes including Mediterranean landraces, breeding lines, and released varieties were collected from the Crop Improvement Division of the institute, air-dried and powdered in a Wiley mill to pass 100-mm sieve. Triplicate sub-sample (1 g) was dried in a vacuum oven to a constant weight for dry matter determination.
Estimation of Dietary Fiber
For the estimation of the total dietary fiber (TDF), an assay procedure was standardized with a slight modification of the Official Methods of Analysis (AOAC) method,[17] for rapid and reproducible determination of the TDF content in mature lentil seeds using a combination of enzymatic and gravimetric methods using the Sigma Total Dietary Fiber Assay Kit. The fat-free died sample was treated with heat stable α-amylase (Sigma-A3306) for gelatinization, hydrolysis, and depolymerization of starch and then enzymatically digested with protease (Sigma-P3910) at 60°C (to solubilize and depolymerize proteins) and amylo-glucosidase (Sigma-A9913; to hydrolyze starch fragments to glucose) to remove the protein and starch. Thereafter, four volumes of ethanol were added to precipitate the soluble dietary fiber (SDF) and remove depolymerized protein and glucose (from starch). The residue was then filtered and washed with 78% ethanol, 95% ethanol and acetone, dried, and weighed. Half of the sample was analyzed for protein and the remaining half was ashed at 525°C in a muffle furnace. The TDF is the weight of the residue minus the weight of Kjeldahl protein and ash determined separately.
Estimation of Folic Acid
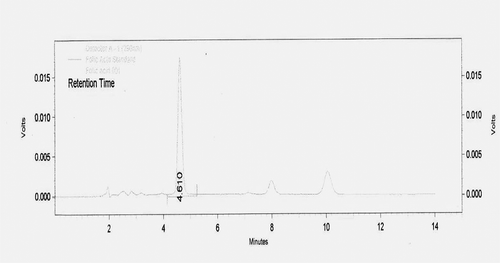
The multiplicity of folate forms and generally the low levels in foods makes quantitative analysis of folate a difficult task. The assay of folates from foods generally involves three steps: liberation of folates from the cellular matrix; deconjugation from the polyglutamate to the mono- and di-glutamate forms; and the detection of the biological activity or chemical concentration of the resulting folates. The seed samples were grinded and suspended in 20 mL extraction buffer (0.1 M phosphate buffer pH 7.8 containing 10 mM ascorbic acid) and homogenized in a domestic blender, thereafter the homogenized samples were autoclaved at 121°C for 15 min, and cooled immediately in order to release the folate that may be trapped or bound to the matrices of protein and carbohydrate, the trienzyme extraction procedure was used, which included the use of three enzymes; protease (2 mg/mL), α-amylase (20 mg/mL), and a conjugase from rat serum (5 mg/mL). The supernatant was passed through a Millipore filter (0.45 µm), before the 10 µL sample extract was injected into the high-performance liquid chromatography (HPLC) system with UV-visible detector (290 nm). Total folate was separated using a C18 column (15cm × 4.6 mm, particle size 5 µm) in series with a guard column. An isocratic mobile phase with a flow rate of 1.0 mL min–1 was applied using the following eluents: Methanol – 5 mMol hepatanesulfonic acid sodium salt/0.1% triethanolamine (25:75 v/v), and pH adjusted to 2.8 with orthophosphoric acid. The representative chromatogram of the working standard solution of folic acid is presented in . Analyses were performed in triplicate. Ten microliter aliquots of pure folate standard solution was used to create calibration curves and for peak identification (retention time 4.61 min) and quantification. The assay for folic acid was selective as no significant interfering peak was observed near the retention time of folic acid. The linearity of the method was determined by injecting four solutions of concentrations between 1 and 150% of the expected concentration. Analysis was performed in triplicate to determine the linearity of the assay. Good linearity was obtained with correlation coefficient above 0.96. The precision of the procedure was checked by analyses of 10 working standard solutions (10 µg/mL). The RSD value was 1.5%, which indicated the satisfactory repeatability of the system and also showed the accuracy and reproducibility of the method. The precision of the method was checked for within day and between day variations.
FIGURE 1 HPLC chromatogram for folic acid.
Statistical Analysis
The data obtained for each sample from the analysis of values of the traits examined (TDF and folic acid separately) were subjected to a one-way analysis of variance (ANOVA) analysis, as well as Duncan’s multiple range test in order to establish the statistical significance, involving calculation of mean value, standard deviation, and coefficient of variation for those measurements. The samples’ distinguishability (ρ) was evaluated as the significance of differences between the mean values of each tested trait for each genotype. The significance of differences of the results was established by ANOVA method (at the significance level of 1%).
RESULTS AND DISCUSSION
TDF Content
The results on the TDF content of 17 different lentil genotypes are presented in . The ANOVA showed that the TDF content in 17 lentil genotypes varied significantly (p < 0.1) in the range of 10 ± 1 to 22 ± 1 g/100 g seed dry weight with an average of 15.0 g/100 g dry seed weight. Landrace IG-134327 showed the highest content of TDF (22 ± 1 g/100 g), whereas, minimum TDF content was recorded in cultivar VL-1 (10 ± 1 g/100 g). The mean TDF content of Mediterranean landraces of lentil was higher (18 g/100 g dry seed weight) as compared to the mean of released varieties (15 g/100 g dry seed weight) and active germplasm (14 g/100 g dry seed weight; ).The variability in range of TDF (10 ± 1 to 22 ± 1 g /100 g) as reported in this study is close to the values reported earlier,[8,18,19] where dietary fiber has been reported to range from 11.5 to 33.2, 9.7 to 24.1, and 11.0 to 26.9 g/100 g, respectively. The mean TDF content (15 g/100 g) of 17 different genotypes reported in this study is also very close to the mean values reported earlier,[8,20] where the TDF content in lentil was reported as 11.5 and 15.8 g/100 g, respectively which was lower than that of chickpea (22.7 g/100 g) and pigeonpea (15.5 g/100 g). The SDF in lentil ranged from 1.2 to 6.7 g/100 g, whereas the insoluble dietary fiber (IDF) ranged from 8.8 to 31.4 g/100 g. In an earlier study, the dietary fiber content (DFC) of chickpeas (Cicer arientinum) was reported in the range of 18–22 g /100 g, pigeonpea (Cajanus cajan L.; 5.1 g/100 g), mung bean (Vigna radiata L.; 16.3 g/100 g), and dry peas (Pisum sativum; 5.1 g/100 g). It has also been reported that the desi types of chickpea have higher total DFC and insoluble DFC as compared to the kabuli types. Usually no significant differences are found in soluble DFC between kabuli and desi types due to similar proportion of hemicelluloses which constitute large part (~55%) of the total seed dietary fiber in kabuli and desi types.[21] In another study,[22] it has been reported that beans contained 14 to 19 g/100 g TDF; however, Sharma[9] reported 17 to 23.4 g/100 g TDF in beans and 26 g/100 g in chickpeas. It has been reported that the IDF content represent the maximum part of the TDF of the legumes, whereas SDF only being a small part.[23]
FIGURE 2 Total dietary fiber in lentil genotypes (%).
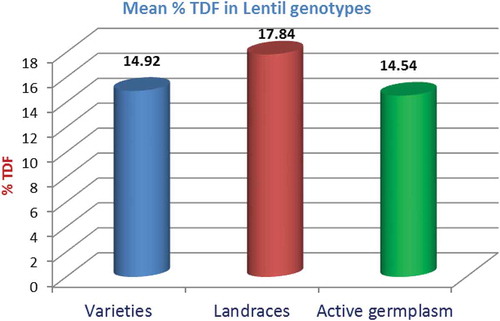
TABLE 1 Mean total dietary fiber content in lentil genotypes
Total Folate Content
The data on ANOVA for total folate content of lentil genotypes showed significant genotypic differences (p < 0.1) for folate content (), with an average value of 222 µg/ 100 g dry seed weight. The Mediterranean landraces of lentil had higher mean folate content (247 µg/100 g) as compared to the other cultivars (198 µg/100 g). The USDA National Nutrition Database[24] reports the total dietary folate equivalence for raw lentil as 479 µg/100 g, field pea (557 µg/100 g), and chickpea (65 µg/100 g). The average value of folate content (222.23 µg/100 g dry seed weight) in lentil genotypes as reported in this study is very close to average value (255 μg/100 g) reported recently.[25] In the set of genotypes analyzed in the present study only one genotype, i.e., IG-163, showed a very high folate content (448.08 µg/100 g), otherwise the range of variability observed for the remaining genotypes (114.38 to 330.44 µg/100 g dry seed weight) is very close to the range reported in the recent study.[25] In addition, they have also reported that lentil had higher folate concentration as compared to chickpea (42–125 μg/100 g), yellow field pea (41–55 μg/100 g), and green field pea (50–202 μg/100 g) and the range of variability within the species is comparatively lower in lentil (216–290 µg/100 g) as compared to other food legumes (in case of kabuli chickpea and field pea folate ranged from 42–125 µg/100 g and 41–202 µg/100 g, respectively). A statistically significant year × location interaction and year × location × genotype interaction effect on lentil folate concentration was reported in this study (p < 0.05). Han and Tyler[26] also reported that location had a significant effect on the folate content of lentil and dry pea; however, cultivar did not. Müller[27] estimated the folic acid content of grain, cereal products and legumes by means of HPLC and reported that among the legumes, beans (128 µg/100 g) had the highest content of total folate, followed by lentils (103 µg/100 g) and peas (57 µg/100 g).
TABLE 2 Mean folate content in lentil genotypes
The differences in the values of folate content in this study with other references may be due to various factors such as differences in cultivation conditions (season and climate), agronomic condition, cultivar and species, and the method used for folate estimation. Food folate levels have been measured using different analytical methods including HPLC and microbial assays. These assays include a microbiological method using Lactobacillus rhamnosus[26] and HPLC-mass spectroscopy methods[28] which include the extraction (conjugase, enzyme treatment, incubation periods) and deconjugation procedure, which might also explain the differences in the folate value in the foods.[29] The use of trienzyme treatment, with the inclusion of α-amylase and protease in the folate analysis, is often used to enhance the release of the folate that is bound or trapped in the food matrix of proteins and oligosaccharides besides the deconjugation with the folate conjugase, thus enhancing the yield of folate from foods.[30] It has also been reported that the incubation of α-amylase and conjugase for 3 h resulted in a moderate increase in the folate readings.[31] They further found that the period of incubation inversely contributed to the increase in folate values. This observation is supported by many researchers who opt for the trienzyme approach as the method of choice for folate measurement in food rather than conjugase alone.[32] The use of tri-enzyme approach as done in the present study enhances the folate yield in food analyses and appears to be essential to determine food folate content accurately.[33]
CONCLUSION
The study is helpful to generate data for the existing genetic variability in the available germplasm of this crop species for two important health promoting components. The significant effect of cultivar, on the levels of dietary fiber and folate in lentils as observed in this study is of particular importance to pulse breeders. However, further studies are required on environmental effects and its interaction with genotypes.
REFERENCES
- Bhatty, R.S. Composition and Quality of Lentil (Lens-Culinaris Medik)—A Review. Canadian Institute of Food Science and Technology Journal 1988, 21, 144–160.
- Wang, N.; Hatcher, D.W.; Toews, R.; Gawalko, E.J. Influence of Cooking and Dehulling on Nutritional Composition of Several Varieties of Lentils (Lens culinaris). LWT–Food Science and Technology 2009, 42, 842–848.
- Jenkins, D.J.; Wolever, T.M.; Taylor, R.H.; Barker, H.; Fielden, H.; Baldwin, J.M.; Bowling, A.C.; Newman, H.C.; Jenkins, A.L.; Goff, D.V. Glycemic Index of Foods: A Physiological Basis for Carbohydrate Exchange. The American Journal of Clinical Nutrition 1981, 34, 362–366.
- McCrory, M.A.; Hamaker, B.R.; Lovejoy, J.C.; Eichelsdoerfer, P.E. Pulse Consumption, Satiety, and Weight Management. Advances in Nutrition 2010, 1, 17–30.
- Cani, P.D.; Lecourt, E.; Dewulf, E.M.; Sohet, F.M.; Pachikian, B.D.; Naslain, D.; et al. Gut Microbiota Fermentation of Prebiotics Increases Satietogenic and Incretin Gut Peptide Production with Consequences for Appetite Sensation and Glucose Response After a Meal. American Journal of Clinical Nutrition 2009, 90, 1236–1243.
- Gupta, P.; Premavalli, K.S. In Vitro Studies on Functional Properties of Selected Natural Dietary Fibers. International Journal of Food Properties 2011, 14(2), 397–410.
- Huges, J.S.; Swanson, B.G. Soluble and Insoluble Dietary Fiber in Cooked Common Beans (Phaseolus vulgaris) Seeds. Food Microstructure 1989, 8, 15–20.
- Khan, A.R.; Alam, S.; Ali, S.; Bibi, S.; Khalil, I.A. Dietary Fiber Profile of Food Legumes. Sarhad Journal Agriculture 2007, 23, 763–766.
- Sharma, R.D. Dietary Fiber Profile of Selected Pulses. Indian Journal of Nutrition and Dietetics 1986, 23, 330–332.
- Ashfield-Watt, P.A.L.; Pullin, C.; Whiting, J.; Clark, Z.E.; Moat, S.J.; Burr, M.L.; Lewis, M.J.; Powers, H.J.; McDowell, I.F.W. Methylene Tetrahydrofolate Reductase (C677T) Genotype Modulates Blood Folate and Homocysteine Responses to a Folate Rich Diet or Low Dose Folate Supplement: A Randomised Controlled Trial. American Journal of Clinical Nutrition 2002, 76, 180–186.
- Su, L.J.; Arab, L. Nutritional Status of Folate and Colon Cancer Risk: Evidence from NHANES I Epidemiologic Follow-up Study. Annals of Epidemiology 2001, 11, 65–72.
- Yoo, J.H.; Choi, G.D.; Kang, S.S. Pathogenicity of Thermolabile Methyltetrahydrofolate Reductase for Vascular Dementia. Arteriosclerosis, Thrombosis, and Vascular Biology 20: 1921–1925.Vegetable Oils. International Journal of Food Sciences and Nutrition 2000, 48, 251–255.
- Hao, L.; Ma, J.; Stampfer, M.J.; Ren, A.; Tian, Y.; Tang, Y.; Willett, W.C.; Li, Z. Geographical, Seasonal, and Gender Differences in Folate Status Among Chinese Adults. Journal of Nutrition 2003, 133, 3630–3635.
- WHO. Healthy Nutrition Preventing Nutrition Related Diseases in Europe; WHO Regional Office for Europe. Nut Unit Copenhagen: Denmark, 1986.
- NRC (National Research Council). Dietary Fiber in Diet and Health: Implication for Reducing Chronic Disease Risk; National Academic Press: Washington, DC, 1989.
- Englyst, H.N.; Bingham, S.A.; Runswick, S.R.; Collinson, E.; Cummings, J.H. Dietary Fiber (Nonstarch Polysaccharides) in Fruit, Vegetables, and Nuts. Journal of Human Nutrition and Dietetics 1988, 1, 233–272.
- AOAC International. Official Methods of Analysis, 16th Ed.; Vol. 1, Section 12.1.07, Method 960.52, AOAC, Rockville, 1997.
- Vidal-Valverde, C.; Frias, J. Legume Processing Effects on Dietary Fibre Components. Journal of Food Science 1991, 56, 1350–1352.
- Ramulu, P.; Rao, U. Effect of Processing on Dietary Fiber Content of Cereals and Pulses. Plant Foods for Human Nutrition 1997, 50, 249–257.
- Tosh, S.M.; Yada, S. Dietary Fibres in Pulse Seeds and Fractions: Characterization, Functional Attributes, and Applications. Food Research International 2010, 43, 450–460.
- Singh, U. Dietary Fibre and Its Constituents in Desi and Kabuli Chickpea (Cicer arietinum L.) Cultivars. Nutrition Reports International 1984, 29, 419–426.
- Hughes, J.S.; Swanson, B.G. Soluble and Insoluble Dietary Fiber in Cooked Common Bean (Phaseolus vulgaris) Seeds. Food Microstructures 1989, 8, 15–23.
- Giovana, E.; de, A.C.; Keila da, S.Q.M.; Soely, M.P.M.R.; Admar, C.; de, O. Chemical Composition, Dietary Fibre, and Resistant Starch Contents of Raw and Cooked Pea, Common Bean, Chickpea, and Lentil Legumes. Food Chemistry 2006, 94, 327–330.
- U.S. Department of Agriculture Agricultural Research Service USDA National Nutrient Database for Standard Reference. http://ndb.nal.usda.gov2012,25 (accessed July 27, 2013).
- SenGupta, D.; Thavarajah, D.; Knutson, P.; Thavarajah, P.; McGee, R.J.; Coyne, C.J.; Kumar, S. Lentils (Lens culinaris L.), a Rich Source of Folates. Journal of Agriculture and Food Chemistry 2013, 61, 7794–7799.
- Han, J.Y.; Tyler, R.T. Determination of Folate Concentrations in Pulses by a Microbiological Method Employing Trienzyme Extraction. Journal of Agriculture and Food Chemistry 2003, 51, 5315–5318.
- Müller, H. Determination of the Folic Acid Content of Grain, Cereal Products, Baked Goods, and Legumes Using High-Performance Liquid Chromatography (HPLC). Z Lebensm Unters Forsch 1993, 197, 573–577.
- Yarbaeva, S.N.; Giraud, D.; Albrecht, J.A. Iron and Folate Contents of Tajik Legumes. Food and Nutrition Science 2011, 2, 337–343.
- Devi, R.; Arcot, J.; Sotheeswaran, S.; Ali, S. Folate Contents of Some Selected Fijian Foods Using Tri-Enzyme Extraction Method. Food Chemistry 2008, 106, 1100–1104.
- Johnston, K.E.; Dirienzo, D.B.; Tamura, T. Folate Content of Dairy Products Measured by Microbiological Assay with Trienzyme Treatment. Journal of Food Science 2001, 67, 817–820.
- Holasova, M.; Fiedlerova, V.; Vavreinova, S. Determination of Folates in Vegetables and Their Retention During Boiling. Czech Journal of Food Science 2008, 26, 31–37.
- Gujska, E.; Kuncewicz, A. Determination of Folate in Some Cereals and Commercial Cereal-Grain Products Consumed in Poland Using Trienzyme Extraction and High-Performance Liquid Chromatography Methods. European Food Research and Technology 2005, 221, 208–213.
- Tamura, T.; Mizuno, Y.; Johnston, K.E.; Jacob, R.A. Food Folate Assay with Protease, α-Amylase, and Folate Conjugase Treatments. Journal of Agriculture and Food Chemistry 1997, 45, 135–139.