
ABSTRACT
In this study, phenolic profile and antioxidant activity of 60 Turkish honey samples of nineteen different floral origins were evaluated by ultra-performance liquid chromatography with electrospray ionization coupled to tandem mass spectrometry, providing the identification of 32 phenolic compounds. Thyme (1051.58 mg/kg), pine (994.18 mg/kg), carob (935.03 mg/kg), eucalyptus (814.46 mg/kg), rhododendron (680.71 mg/kg), heather (562.59 mg/kg), cedar (561.83 mg/kg), and euphorbia (501.64 mg/kg) present significantly high phenolic content. Moreover ferulic, homogentisic, gentisic, syringic, 3,4-dihydroxybenzoic, caffeic, vanillic, p-coumaric, 4-hydroxy benzoic, and trans-2-hydroxy cinnamic acids were the most abundant of the determined compounds. The antioxidant activities of the honeys were evaluated by β-carotene-linoleic acid inhibition, DPPH free radical scavenging activity and ABTS+ cation radical scavenging activity which were measured as IC50: 10.87 – 48.23 µg/mL, SC50: 54.33 – 99.40 µg/mL and SC50: 10.33 – 41.20 µg/mL, respectively. Phenolic compounds are considered antioxidant constituents, and they could be stated as components that account for antioxidant activity in Turkish honeys.
Introduction
Honey is a bee-processed natural product, and has very old history in the world. Unifloral honeys are highly demanded, though, they are expensive compared to multi-floral honeys, primarily due to limited production, scarce field, and climatic conditions of blossoming. Honey includes more than 100 substances, such as carbohydrates, amino acids, minerals, phenolic compounds, enzymes, and the composition of honey is highly dependent on the flowers visited by bees and the weather condition of the area from which the honey is harvested.[Citation1,Citation2] Phenolic compounds constitute the important quality parameter of honeys and account for their color, sensory properties, and antioxidant activity.[Citation3–Citation6] The determination and evaluation of phenolic constituents in honeys appeal high attention by consumers and researchers owing to health-promoting feature which accompanies by bioactivity.[Citation7] In a previous study by Viuda-Martos et al., the antimicrobial, anti-inflammatory, antimutagenic, antitumor, and antioxidative activity of honey were revealed.[Citation8] Botanical origin of honeys was classified according to phenolic ingredients[Citation7] and this consequently implies that as honey bees collect nectar from plants which contain bioactive components. These phytochemical ingredients can be transferred to honey by honey-bees.[Citation9,Citation10]
Thus, honey has been used to cure and prevent several illnesses.[Citation10–Citation13] Some of the illnesses related to oxidative damage can be healed due to therapeutic features of honey having antioxidant capacity.[Citation2] Honey, being a source of antioxidant, played an important role in preventing deteriorative oxidation of food, as a result of heat and metals.[Citation14] It is substantial to correlate the antioxidant activity with different antioxidant compounds as a whole in honeys and their phenolic extracts.
Various types of honey are produced in Turkey. The identification of several honey produced in Turkey previously reported by some groups;[Citation10,Citation15–Citation18] however, the identification of 32 phenolic compounds and antioxidant activity of the studied honeys were not reported previously. Liquid chromatography mass spectrometry (LC-MS) provides high selectivity, sensitivity, and validity for the analysis phenolic compounds in complex matrices.[Citation19] The ultra-performance liquid chromatography with electrospray ionization coupled to tandem mass spectrometry (UPLC-ESI-MS/MS) is highly reliable for accurate and precise identification of individual phenolic compounds on the basis of mass transition monitoring.
In Turkey, honey can be produced in three seasons of the year, is one of the richest countries in the world in honey variety and production due to its geographical location. The aim of present study was to increase the knowledge of the Turkish honey based on identification of the individual phenolic contents of nineteen different floral origins using UPLC-ESI-MS/MS for the first time. In addition, scavenging activities and antioxidant activity were evaluated by DPPH, ABTS+, and β-carotene bleaching assays. Phenolic profile and antioxidants activities of Turkish honeys with high apitherapy potential is shown in this study.
Materials and methods
Honey samples
Honey samples and their collection regions are shown in . They were stored at room temperature in the dark until the time of testing.
Table 1. Honey samples and their collection regions.
Standards and reagents
Phenolic reference standards (pyrogallol, homogentisic acid, 3,4-dihydroxybenzoic acid, gentisic acid, pyrocatechol, galantamine, 4-hydroxy benzoic acid, 3,4-dihydroxybenzaldehyde, catechin hydrate, vanillic acid, caffeic acid, syringic acid, vanillin, epicatechin, catechin gallate, p-coumaric acid, ferulic acid, rutin, trans-2-hydroxy cinnamic acid, myricetin, resveratrol, trans-cinnamic acid, luteolin, quercetin, naringenin, genistein, apigenin, kaempferol, hesperetin, chlorogenic acid, and chrysin) were purchased from Sigma-Aldrich Chemie GmbH (Steinheim, Germany). β-carotene, tween-40, 2,2-diphenyl-1-picrylhydrazyl (DPPH), 2,2′-azino-bis(3-ethylbenzothiazoline-6-sulfonicacid) diammonium salt (ABTS), potassium persulfate (K2S2O8), butylated hydroxytoluene (BHT), and butylated hydroxyanisole (BHA) were obtained from Sigma-Aldrich Chemie GmbH (Steinheim, Germany). All chemicals were analytical grade and purchased from local suppliers. High-performance liquid chromatography (HPLC)-water (18.2 MΩ) was purified by Millipore Milli-Q system (Molsheim, France) that contains reverse osmosis, ion exchange, and filtration steps.
Preparation of standard solutions
The reference stock standards (10 mg for each) were weighed in 10 mL flask and dissolved in methanol to obtain approximately 1000 mg/L stock concentration. Mixed working standard solutions of phenolic compounds at 50 mg/L were prepared for calibration points ranged 0.00–10.00 mg/L.
Instrumentation and conditions
The UPLC-ESI-MS/MS instrument includes a Waters (Milford, MA, USA) Acquity Ultra Performance LC with a Waters binary system manager and sample manager coupled to a Waters Xevo TQ-S triple quadrupole mass spectrometer with ESI probe. The separation was done with a Waters analytical C18 column, Acquity UPLC BEH C18 (1.7 µm 2.1 × 100 mm) at 40oC column oven temperature and 2 µL injection volume with the two mobile phases (mobile phase A, 0.5% [v/v] acetic acid in ultrapure water and mobile phase B, 0.5% [v/v] acetic acid in acetonitrile) with a linear gradient mode, 0–1 min 99% A, 1–10 min 70% A, 10–12 min 5% A, 12–13 min 99% A at 0.650 mL min-1 flow rate. The multiple reaction monitoring (MRM) mode executes the transitions of parent ion to daughter ions of m/z, and the optimal instrument parameters of the mass spectrometer were as described in previous methods.[Citation20,Citation21] MassLynx mass spectrometry software and TargetLynx data processing software (Waters) were used for the identification and evaluation of phenolic compounds by comparing retention time and m/z transitions of commercial standards using established calibration curves.
Sample preparation for the determination of phenolic compounds
Sixty honey samples were prepared for phenolic compounds determination. Each honey samples (10 g) were dissolved in ultrapure water (50 mL), and mixed 5 min via vortex. Then ethyl acetate (50 mL) was added into solution flask and the flask was placed on shaker (Promax 2020, Heidolph, Germany) for 30 min. After then, the flask settledfor the phase separation for 180 min. The water phase was extracted two more times with ethyl acetate, and the combined ethyl acetate extract was evaporated (Rotary Evaporator, Heidolph, Germany) under vacuum at 36oC. The residue was redissolved in methanol (5 mL) and filtered from Macherey-Nagel Chromafil Xtra PTFE 20/25 0.20 µm, and 2 µL of the solution was injected into UPLC-ESI-MS/MS.
Microscopic analysis of honey pollen
The real botanic origin of honeys was confirmed using Louveaux’s method.[Citation22] Honey samples were classified by frequency classes depending on the pollen grain:[Citation23,Citation24] A number of pollen grain >45% honey was placed in the class very frequent pollen, between 16–45% frequent pollen, between 4–15% isolated pollen, and <3% rare pollen. On the base of the data obtained, the more representative sixty honey samples have been classified.
Measurement of in vitro antioxidant capacity
The total antioxidant activity was evaluated using β-carotene-linoleic acid test system.[Citation25] The method is based on bleaching of β-carotene. β-carotene (0.5 mg) dissolved in chloroform (1 mL) was added into mixture of linoleic acid (20 μL) and Tween 40 emulsifier (200 mg). Solvent was evaporated under vacuum, distilled water (100 mL) saturated with oxygen was added by vigorous shaking. Then the emulsion was immediately added to each tube and, the zero time absorbance was initially measured at 470 nm. The absorbance measurements were reported every 30 min until it reached 120 min. The results were given as 50% inhibition concentration (IC50). BHT, BHA and α-tocopherol were used as antioxidant standards for the activity comparison.
The scavenging activity of honey samples for the radical DPPH was measured as a standard procedure applied to evaluate the antiradical activity of various foods.[Citation26] The color change of DPPH occurs from purple to yellow when the unpaired electron of DPPH forms a pair with hydrogen donated by a free radical scavenging antioxidant. Thus, the free radical DPPH is reduced to the corresponding hydrazine, and its absorbance at 517 nm decreases.[Citation27] The scavenging activity (H+ /e−-transferring ability) of honey for DPPH• was measured as described by Mensor et al.[Citation28] Briefly, every diluted extract sample was added (2.5 mL) to 1 mL of a 0.3 mM methanol DPPH solution. The mixture was stored in the dark for 30 min and the absorbance at 517 nm was measured with spectrophotometer.
The reagent for the ABTS/persulfate method[Citation29] was produced by reacting 7.0 × 10⁻³ mol/L stock solution of ABTS with 2.45 × 10⁻³ mol/L potassium persulfate and allowing the mixture to stand in the dark at room temperature for 12−16 h prior to use.[Citation29,Citation30]
Sample extraction method optimization
The extraction solvents (ethyl acetate, chloroform and dichlormethane), sample weight (5, 10, 20, and 40 g), and extraction times (10, 20, 30 and 60 min) were investigated to determine the best extraction efficiency. Optimal extraction was achieved with 10 g of honey sample extracted with ethyl acetate in a shaker for 30 min.
UPLC-ESI-MS/MS method optimization
The UPLC-ESI-MS/MS analysis method was applied to honey samples.[Citation20,Citation21] The gradient program of mobile phase was optimized for the separation of identified peaks with best resolution of analytes within 13 min for 32 phenolic compounds in the studied honeys. Acetic acid percentage in acetonitrile and in ultrapure water, and the content and steps of duration of acetonitrile in mobile phase were managed for well resolution of phenolic components. Although it can be observed that there was a co-elution of some analytes, the identification and quantification of them were accomplished by MS and MS/MS spectra of those analytes. A fluidics system was used for the method optimization experiments in infusion mode with combine mobile phase at flow ranged 10–50 µL. ESI is commonly implemented for a number of polar compounds, being ionized form in the solution, and supply less low mass of daughters from parent mass. Both negative and positive modes were examined, and positive mode produced more ions accordingly high noise level. Thus negative mode was decided that optimization of the ESI parameters are significant for the performance of sufficient MS signals for analytes, except for galantamine, genistein, quercetin. Capillary and cone voltages were changed between 2–4 kV and 3–60 V, respectively, for each of the analytes for the best signal abundance. Specific pair transitions of parent to daughter ions that were selected for individual analyte and ESI modes were summarized in our previous article.[Citation20,Citation21] These ion pairs of parent to daughter provided unambiguously distinguish all phenolic components, thus, were utilized for selective determination and evaluation of compounds using MRM mode. Transitions of ion pairs and their capillary and cone voltages gained for phenolic compounds conformed with those described earlier in the literature.[Citation5,Citation19,Citation20]
Statistical analysis
Three replicates of sample were prepared for each analysis. The results are expressed as mean values ± standard deviation (SD). Microsoft Excel 2010 (Microsoft Corporation, USA) were used for statistical analysis.
Results and discussion
Phenolic profile of turkish honeys
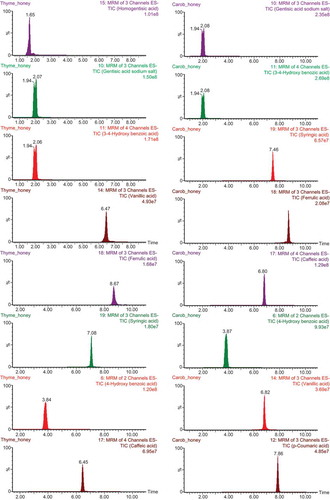
The UPLC-ESI-MS/MS was applied to analyze the individual phenolic compounds in honey samples. A total of 32 phenolic compounds were identified and 23 of them were detected in honey samples according to retention times and mass spectra of commercial standards. Total ion chromatograms (TIC) of thyme honey and carob honey are shown in as the content of phenolic compounds in these honeys are abundant.
Figure 1. Total ion chromatograms (TIC) of phenolic compounds detected in thyme honey and carob honey.
Chlorogenic acid, catechin gallate, myricetin, catechin hydrate, epicatechin, resveratrol, pyrocatechol, galantamine, and quercetin in the studied honeys were either determined or available below their limits of detection (LoDs). Genistein, pyrogallol, 4-hydroxy benzoic acid, 3,4-dihydroxy benzaldehyde, gentisic acid, 3,4-dihydroxybenzoic acid, p-coumaric acid, vanillic acid, homogentisic acid, gallic acid, caffeic acid, ferulic acid, syringic acid, chrysin, apigenin, rutin, vanillin, naringenin, kaempferol, luteolin, and hesperetin were detected in all honey samples, and the values were summarized in . Although comparable chromatographic display were observed in most of the honey samples, there was a notable variation in the content of phenolic constituents.
Table 2. Phenolic compounds content of Turkish honeys of different floral origin. Results were expressed as mg/kg ± SD.
Ferulic, homogentisic, gentisic, and protocatechuic acids were found the highest as compared to other phenolic constituents. The highest level of ferulic acid were determined in rhododendron, chestnut, and cotton honeys, the highest levels of homogentisic acid were obtained from thyme and citrus, and the highest levels of gentisic acid were in carop, eucalyptus, pine, thyme, cedar, multifloral, and the highest levels of protocatechuic acid were in carop, pine, eucalyptus honeys.
In case of rhododendron honey, ferulic acid (448.41 mg/kg) was displayed to be the richest among all honey. On the other hand syringic acid was found to be high in euphorbia, lavender, pine, carob honey samples, 344.78, 245.83, 241.03, 178.82 mg/kg, respectively. According to , phenolic compound contents of acacia honey was higher than the samples studied in the literature.[Citation6,Citation7] This indicates that there were other phenolic compounds detected using proposed UPLC-ESI-MS/MS analysis in this study, however, previous report may use HPLC-ultraviolet (UV).[Citation31] Amounts of gentisic, syringic, 3,4-dihydroxybenzoic, caffeic, and ferulic acids in pine, heather, squash blossoms honey samples were ascertained to be higher than the other studied honey samples. In the comparison of thyme and chestnut honey samples, though chestnut honey contained significant amount phenolic compounds in total 404.60 mg/kg, thyme honey ascertained to be considerably higher phenolic ingredient as it is seen in . In terms of homogentisic (384.06 mg/kg), gentisic (279.92 mg/kg), 3,4-dihydroxybenzoic (163.61 mg/kg), and vanillic acid (46.37 mg/kg) contents by more than one order of magnitude higher, 1051.58 mg/kg, than chestnut honey. In addition, hesperetin was evaluated in all the analyzed honey samples, yet it was hardly detected in other studies.[Citation6,Citation32] Rutin, which was considered to contribute to antioxidant activity,[Citation5] was found in all the analysed honeys except acacia and chestnut honeys. Quercetin was found in small quantities only in multi floral and rhododendron honeys, in accordance with earlier study by Silici et al.[Citation33] The studied honey samples vary in line with detected in total amount of phenolic compounds, and can be sorted according to total amount of phenolic compound from high to low as follows: thyme (1051.58 mg/kg), pine (994.18 mg/kg), carob (935.03 mg/kg), eucalyptus (814.46 mg/kg), rhododendron (680.71 mg/kg), heather (562.59 mg/kg), cedar (561.89 mg/kg), euphorbia (501.64 mg/kg), vitex (476.00 mg/kg), citrus (462.45 mg/kg), multi-floral (437.80 mg/kg), chestnut (404.60 mg/kg), lavender (399.25 mg/kg), clover (329.57 mg/kg), cotton (327.91 mg/kg), sunflower (321.82 mg/kg), sideritis (320.11 mg/kg), squash blossoms (267.47 mg/kg), and acacia (240.75 mg/kg). It was also shown in . It can be observed that acacia honey contained lowest phenolic ingredient among the other honey types, yet it was much still higher than values reported in the literatures.[Citation6,Citation7,Citation22] Gentisic, 3,4-dihydroxybenzoic, syringic, ferulic, caffeic, 4-hydroxy benzoic, vanillic, p-coumaric acids were found abundant quantity in carob honey samples as shown in . Carop and rhododendron honeys are considered as rare honeys, whereas their phenolic constituents were significantly high. Significant amount of ferulic, caffeic, gentisic, 4-hydroxy benzoic, vanillic, syringic, 3,4-dihydroxybenzoic, and p-coumaric acids were detected in rhododendron honeys. Silici et al.[Citation33] reported coumaric acid, quercetin and chlorogenic acid in rhododendron honey. There were compatible results due to the dominant pollen property of the honey types but, absolute similarity could not be ensured. This indicates that phenolic profile of honeys depends on several parameters not only on plant flora, but also on geographical area and production season of the year.[Citation34]
Antioxidant activity of turkish honeys
Antioxidant activity of analysis of studied honey was shown in . Honeys were displayed variation according to the ability of their extracts to scavenge free radicals due to remarkable differences in antioxidant properties.[Citation35] In this study, antioxidant capacities of honey were determined using β-carotene-linoleic acid test. It can be decided that most of the honey samples exhibited high lipid peroxidation inhibition (IC50 value). In β-carotene-linoleic acid assay, thyme, multi-floral, rhododendron, and carob honey samples revealed high activity as IC50 = 10.87, 11.46, 12.28, and 13.07 µg/mL, respectively. On the other hand, cotton honey samples (IC50 = 48.23 µg/mL) displayed lowest activity.
Table 3. Antioxidant activities of honey samples by β-carotene-linoleic acid, DPPH, and ABTS+ assays.
In case of radical scavenging activity, DPPH assay of honey samples displayed good radical scavenging inhibition, The scavenging activity of DPPH in carob, vitex, sideritis, thyme, and cedar honey samples were in the range of 54.33–59.47 µg/mL, which is in accordance with earlier studies. Sahin et al.[Citation1] reported that the DPPH values of their honey samples ranged from 0.030–0.097 g/mL Khalafi et al.[Citation27] reported that DPPH results were between 45.6 to 54.2%. The ABTS cation radical scavenging activity in sideritis, thyme, rhododendron, cedar, carob, and multi-floral honey samples revealed good activity in the range of 10.33–12.21 µg /mL. Similarly, in previous literature Sahin et al.[Citation1] reported that the scavenging activity of ABTS of their rhododendron honey samples was in the range of 0.302 to 0.918 g/mL. There was a good correlation between antioxidant activity and phenolic content according to results of antioxidant activity of analysis.
Method Validation
After optimized method conditions were settled down, determination coefficients of calibration curves also exhibit good linearity in the range of 0.05–10.00 mg/L with R2: 0.911208–0.999425. The calibration lines were built up by tree repeated injections of standard solutions. The limits of detection (LoD) and quantification (LoQ) were calculated at a signal-to-noise (S/N) ratio of 3 and 5, respectively.
The regression equations and correlation coefficients, as well as LoD values of phenolic compounds were listed in . The accuracy of sample preparation process and UPLC-ESI-MS/MS detection was validated by application of recovery test. Honey solutions (20%, m/v) were spiked at 0.2 mg/L with phenolic compound standard mixture, for that procedure section of instrumentation and conditions were followed. Data were presented in .
Table 4. LoD values, recovery, the regression equations, and correlation coefficients of phenolic compounds.
Conclusion
The report of this study contains the results of 32 phenolic compounds with antioxidant activity screening in different floral origin honeys. Characterization of the main phytochemicals in Turkish honeys is presented using a rapid, accurate, sensitive UPLC-ESI-MS/MS analysis method, applied to honey samples, and a total of 32 phenolic compounds were identified for the first time. Ferulic, homogentisic, gentisic, syringic, 3,4-dihydroxybenzoic, caffeic, vanillic, p-coumaric, 4-hydroxy benzoic, and trans-2-hydroxy cinnamic acids were determined to be the most abundant of in the studied natural compounds. The UPLC-ESI-MS/MS demonstrated to be reliable for the unambiguous detection of a large number of compounds, by enabling the determination of phenolic profiles. These phenolic compounds are naturally existed in Turkish honeys, and they are considered as among numerous antioxidant constituents. In the light of results, Turkish honeys with apitherapy potential and marvellous delicious taste can promote human life and health as rich natural antioxidants, and also may be practiced into nutrients, cosmetics, and pharmaceutical industries.
References
- Sahin, H.; Akyuz Turumtay, E.; Yildiz, O.; Kolayli S. Grayanotoxin-III Detection and Antioxidant Activity of Mad Honey. International Journal of Food Properties 2015, 18, 2665–2674.
- Ferreira, I.F.R.; Aires, E.; Barreira, J.C.M.; Estevinho, L.M. Antioxidant Activity of Portuguese Honey Samples: Different Contributions of the Entire Honey and Phenolic Extract. Food Chemistry 2009, 114, 1438–1443.
- Alvarez-Suarez, J.M.; Giampieri, F.; Battino, M. Honey as a Source of Dietary Antioxidants: Structures, Bioavailability and Evidence of Protective Effects Against Human Chronic Diseases. Current Medicinal Chemistry 2013, 20, 621–638.
- Alvarez-Suarez, J.M.; Tulipani, S.; Romandini, S.; Bertoli, E.; Battino, M. Contribution of Honey in Nutrition and Human Health: A Review. Mediterranean Journal of Nutrition and Metabolism 2010, 3, 15–23.
- Bogdanov, S.; Jurendic, T.; Sieber, R.; Gallmann, P. Honey for Nutrition and Health: A Review. American Journal of the College of Nutrition 2008, 27, 677–689.
- Sergiel, I.; Pohl, P.; Biesaga, M. Characterisation of Honeys According to Their Content of Phenolic Compounds Using High Performance Liquid Chromatography/Tandem Mass Spectrometry. Food Chemistry 2014, 145, 404–408.
- Kečkeš, S.; Gašić, U.; Veličković, T.C.; Milojković-Opsenica, D; Natić, M; Tešić, Z. The Determination of Phenolic Profiles of Serbian Unifloral Honeys Using Ultra-High-Performance Liquid Chromatography/High Resolution Accurate Mass Spectrometry. Food Chemistry 2013, 138, 32–40.
- Viuda-Martos, M.; Ruiz-Navajas, Y.; Fernández-López, J.; Pérez-Álvarez, J. Functional Properties of Honey, Propolis, and Royal Jelly. Journal of Food Science 2008, 73(9), 117–124.
- Baltrusaityte, V.; Venskutonis, P.R.; Ceksteryte, V. Radical Scavenging Activity of Different Floral Origin Honey and Beebread Phenolic Extracts. Food Chemistry 2007, 101, 502–514.
- Silici, S.; Sagdic, O.; Ekici, L. Evaluation of the Phenolic Content, Antiradical, and Antimicrobial Activity of Rhododendron Honeys. Food Chemistry 2010, 121, 238–243.
- Salem, S.N. Honey Regimen in Gastrointestinal Disorders. Bulletin of Islamic Medicine 1981, 1, 358–362.
- Postmes, T.; Van den Bogaard, A.E.; Hazen, M. Honey for Wounds, Ulcers, and Skin Graft Preservation. Lancet 1993, 341, 756–757.
- Nasuti, C.; Gabbianelli, R.; Falcioni, G.; Cantalamessa, F. Antioxidative and Gastroprotective Activities of Anti-Inflammatory Formulations Derived from Chestnut Honey in Rats. Nutrition Research 2006, 26, 130–137.
- McKibben, J.; Engeseth, N.J. Honey as a Protective Agent Against Lipid Oxidation in Ground Turkey. Journal of Agricultural and Food Chemistry 2002, 50, 592–595.
- Sorkun, K.; Dogan, C.; Başoğlu, N. Physicochemical Characteristics and Composition of Eucalypthus Camaldulensis Dehnh. Honey Produced in Turkey. Apiacta 2001, 36, 182–189.
- Küçük, M.; Kolaylı, S.; Karaoğlu, S.; Ulusoy, E.; Baltacı, C.; Candan, F. Biological Activities and Chemical Composition of Three Honeys of Different Types from Anatolia. Food Chemistry 2007, 100, 526–534.
- Ulusoy, E.; Kolaylı, S. Phenolic Composition and Antioxidant Properties of Anzer Bee Pollen. Journal of Food Biochemistry 2014, 38(1), 73–82.
- Ulusoy, E.; Kolaylı, S.; Sarıkaya, A.O. Antioxidant and Antimicrobial Activity of Different Floral Origin Honeys from Turkiye. Journal of Food Biochemistry 2010, 34(s1), 321–335.
- Stephens, J.M.; Schlothauer, R.C.; Morris, B.D.; Yang, D.; Fearnley, L.; Greenwood, D.R.; Loomes, K.M. Phenolic Compounds and Methylglyoxal in Some New Zealand Manuka and Kanuka Honeys. Food Chemistry 2010, 120(1), 78–86.
- Kıvrak, İ.; Kıvrak, Ş.; Harmandar, M.; Çetintaş, Y. Phenolic Compounds of Pinus Brutia Ten.: Chemical Investigation and Quantitative Analysis Using an Ultra-Performance Liquid Chromatography Tandem Mass Spectrometry with Electrospray Ionization Source. Records of Natural Products 2013, 7(4), 313–319.
- Kıvrak, İ. Analytical Methods Applied to Assess Chemical Composition, Nutritional Value and in Vitro Bioactivities of Terfezia Olbiensis and Terfezia Claveryi from Turkey. Food Analytical Methods 2015, 8, 1279–1293.
- Louveaux, J.; Maurizio, A.; Vorwohl, G. Methods of Melissopalynology. Bee World 1978, 59, 139–157.
- Von Der Ohe, W.; Oddo, L.P.; Piana, M.L.; Morlot, M.; Martin, P. Harmonized Methods of Melissopalynology. Apidologie 2004, 35, 18–25.
- Ahmad Nayik, G.; Dar, B.N.; Nanda, V. Optimization of the Process Parameters to Establish the Quality Attributes of DPPH Radical Scavenging Activity, Total Phenolic Content, and Total Flavonoid Content of Apple (Malus Domestica) Honey Using Response Surface Methodology. International Journal of Food Properties 2016, 19, 1738–1748.
- Acar, G.; Mercan-Doğan, N.; Duru, M.E.; Kıvrak, I. Phenolic Profiles, Antimicrobial and Antioxidant Activity of the Various Extracts of Crocus Species in Anatolia. African Journal of Microbiology Research 2010, 4(11), 1154–1161.
- Kubola, J.; Siriamornpun, S. Phenolic Contents and Antioxidant Activities of Bitter Gourd (Mamordica Charantia L.) Leaf, Steam and Fruit Fraction Extracts in Vitro. Food Chemistry 2008, 110, 881–890.
- Khalafi, R.; Goli, S.A.H.; Behjatian M. Characterization and Classification of Several Monofloral Iranian Honeys Based on Physicochemical Properties and Antioxidant Activity. International Journal of Food Properties 2016, 19, 1065–1079.
- Mensor, L.L.; Menezes, F.S.; Leitao, G.G.; Reis, A.S.; Santos, T.C. Screening of Brazilian Plant Extracts for Antioxidant Activity by the Use of DPPH Free Radical Method. Phytotherapy Research 2001, 15, 127–130.
- Thaipong, K.; Boonprakob, U.; Crosby, K.; Cisneros-Zevallos, L.; Byrne, D.H. Comparison of ABTS, DPPH, FRAP, and ORAC Assays for Estimating Antioxidant Activity from Guava Fruit Extracts. Journal of Food Composition and Analysis 2006, 19, 669–675.
- Başkan, K.S.; Tütem, E.; Özer, N.; Apak, R. Spectrophotometric and Chromatographic Assessment of Contributions of Carotenoids and Chlorophylls to the Total Antioxidant Capacities of Plant Foods. Journal of Agricultural and Food Chemistry 2013, 61, 11371–11381.
- Can, Z.; Yildiz, O.; Sahin, H.; Akyuz Turumtay, E.; Silici, S.; Kolayli S. An Investigation of Turkish Honeys: Their Physico-Chemical Properties, Antioxidant Capacities and Phenolic Profiles. Food Chemistry 2015, 180, 133–141
- Socha, R.; Juszczak, L.; Pietrzyk, S.; Galkowska, D.; Fortuna, T.; Witczak, T. Phenolic Profile and Antioxidant Properties of Polish Honey. International Journal of Ford and Technology 2011, 46, 528–534.
- Silici, S.; Sarioglu, K.; Dogan, M.; Karaman K. HPLC-DAD Analysis to Identify the Phenolic Profile of Rhododendron Honeys Collected from Different Regions in Turkey. International Journal of Food Properties 2014, 17, 1126–1135.
- Mendes, E.; Proença, E.B.; Ferreira, I.M.P.L.V.O.; Ferreira, M.A. Quality Evaluation of Portuguese Honey. Carbohydrate Polymers 1998, 37, 219–223.
- Sagdic, O.; Silici, S.; Ekici, L. Evaluation of the Phenolic Content, Antiradical, Antioxidant, and Antimicrobial Activity of Different Floral Sources of Honey. International Journal of Food Properties 2013, 16, 658–666.