
ABSTRACT
Milk protein concentrate 80 (MPC80) was prepared with different emulsifying salts (ES). The effects on particle size (D50), solubility, and surface hydrophobicity (H0) of MPC80 were then observed after production. The molecular weight and secondary structure of MPC80 protein were also investigated through sodium dodecyl sulphate-polyacrylamide gel electrophoresis (SDS-PAGE) and Fourier Transform Infrared (FTIR) spectrometry. Particle size (D50) was reduced from 31.37 to 20.67 μm following the addition of sodium phosphate (SPS). The solubility of MPC80 fortified with sodium citrate salt (SCS), SPS, and sodium pyrophosphate (SPP) was improved by 80.32, 78.23, and 55.80%, respectively. The SDS-PAGE pattern showed no significant difference between the control and single-ES-fortified samples, but major protein bands (αs-CN, β-CN, κ-CN, BSA, and β-LG) had a stronger intensity than binary-ES-fortified MPC80. The FTIR results showed that the β-sheet content of ES-fortified MPC80 was relatively higher than that in the control. Compared with analogue cheeses made by MPC80 with and without ES, SCS–SPP (92:8)-modified MPC80 presented a better fluid mass and homogeneous colour.
Introduction
Milk protein concentrate (MPC) is a high-protein milk powder commonly used in the food industry as a functional ingredient. It is valued for its nutritional quality. More than 55% (even above 80%) of the dry matter in MPC is milk protein, and the casein-to-whey-protein ratio is approximately equal to that of milk. Traditional milk protein products are produced by acidification or rennet precipitation, which involves the application of high heat or pH adjustments that denature whey protein.[Citation1] MPC powders are manufactured through ultrafiltration (UF), diafiltration (DF), and optional evaporation of the retentate prior to spray-drying, which can minimize whey protein denaturation.
MPC is used in cheese, yogurt, beverage, and confectionery processing. Analogue cheese products are described as products that look like cheese, but in which the milk fat could be partly or completely replaced by other fats.[Citation2] Rennet casein (CN) is widely used as a source of protein in analogue cheese manufacturing; however, it hydrates poorly and is effectively insoluble in water. In addition, rennet CN often associates with undesirable “casein” off-flavours.
Patent US 6183804 B1 provided a method for producing processed cheese or processed cheese-type products from MPC powders. Specifically, the invention provides a direct, rapid, and on-demand method for producing processed cheese.[Citation3] However, one disadvantage of this method is the formation of “nuggets” in the cheese. The problem can be overcome by exposure to elevated temperatures after mixing the dried MPC with the liquid ingredients, which adds an extra step to the cheese manufacturing process. Bartosz So1owiej et al.[Citation4] examined the textural and rheological properties and meltability of processed cheese analogues prepared from rennet CN or acid CN that were partially replaced by whey protein preparations. Their results showed that adding whey proteins to rennet CN samples caused greater adhesiveness compared with acid CN samples. However, the type, absolute concentrate as well as ratio of CN and whey protein should be prepared appropriately to obtain good texture. Moreover, the undesirable “casein” off-flavour is unavoidable.
In our previous study, ultrasonic technology was used to modify the process of MPC. Several types of functionalities, including solubility, emulsification, and rheology, were influenced.[Citation1] Considering that ultrasonic technology is rarely applied in the dairy industry, other MPC-modified methods with cost-effective, easy-operated, and possibly large-scale production should be explored. The objective of this work was to provide a new type of MPC and its method of production. This new type of MPC presents good functionality and is suitable for producing analogue cheese.
Three types of emulsifying salts (ES), namely sodium citrate salts (SCS), sodium pyrophosphate (SPP), and sodium phosphate (SPS), mixed in different proportions, were added into raw skim milk on a pilot scale. The effect of ES on the protein structure and functionality of MPC80 was observed. Specifically, we studied the solubility, protein molecular weight, and secondary structure of rehydrated MPC80. Furthermore, the texture of analogue cheeses produced with control and ES-modified MPC80 was compared.
Materials and methods
Materials
Pasteurized skim milk with a dry solid content of 8.61% and a total protein (TP) content of 3.22% was obtained from Bright Dairy and Food Co., Ltd. Other components of the skim milk included 0.02% fat, 4.50% lactose, and 0.73% ash. SCS (trisodium citrate dihydrate), SPS (trisodium phosphate anhydrous), and SPP (sodium pyrophosphate anhydrous) were purchased from Aldrich Chemical Co. (Sigma-Aldrich, St Louis, MO, USA)
Production of MPC80 powders
MPC80 was obtained via UF of skim milk with a stainless steel membrane tube (Hyflux L400, HyfluxFerro Cep, Singapore) equipped with spiral-wound membranes of pore size 20 nm. Pasteurized skim milk (15 s, 72°C) was cooled down to 50°C, and different types of ES were added before starting membrane filtration. A simplex-lattice mixture experimental design for a mixture with q components consists of points where the proportions assumed by each component take equally spaced values from 0 to 1.[Citation5] Aside from the addition of monomer ES, three different binary-ES mixtures (SCS–SPS, SCS–SPP, and SPS–SPP) were prepared. Two salts were combined in three different proportions (8:92, 50:50, and 92:8) (). Solutions of the single- and binary-ES mixtures, all at 20% (w/w) total solid, were added to the pasteurized skim milk to obtain a concentration of 0.3% (w/w) salt on total solid. After adding different proportions of SPS–SPP, the skim milk showed partial gelling and hence could not be used for further processes. The samples without ES were used as control.
Table 1. Ratio of different emulsifying salts.
A total of 180 kg skim milk was subjected to UF to approximately 3:1 volumetric concentration ratio (VCR) at 50 ~ 55°C for a total of 6 h. The 60 kg retentate was subjected to DF to achieve 6 × concentration (16.23% w/w final solid content) using the same membrane pilot-plant unit. The DF process lasted 4 h at 50 ~ 55°C. Membrane inlet pressure of 1.70 bar and outlet pressure of 1.05 bar were maintained throughout the operation. At the end of DF, retentates were collected and concentrated to 25.10% ~ 25.74% (w/w) of the total solid using a thin-film evaporator. The operation temperature (65°C) was kept below 70°C to avoid the denaturation of whey protein. The DF concentrates were spray-dried using a Drytec Compact Laboratory Spray Dryer (Drytec, Kent, UK) (inlet temperature 200°C, outlet temperature 95°C, feed temperature 45°C) to approximately 3.5% w/w. After all the processes, 10 different types of MPC80 were obtained and sealed in airtight bags for further analyses.
Chemical analyses
TP content was determined by the Kjeldahl method with a 6.38 conversion factor. Fat content was analysed using the Standards Australia (1995) method AS 2300.1.3,[Citation6] in which fat was extracted from the dissolved powder with diethyl ether and petroleum spirit and measured gravimetrically. Lactose content was determined enzymatically using the Enzytec lactose/D-galactose kit (R-Biopharm, Kurnell, NSW, Australia) according to method 2300.6.6 of Standards Australia (1995).[Citation6] The moisture content was determined by oven drying. Approximately 10 g of each sample was dried at 102°C for 5 h under atmospheric pressure. The ash content was analysed by incinerating the sample at 550°C until white ash was obtained. The calcium content was determined using inductively coupled plasma optical emission spectrometry after acidic digestion in a hot mixture of nitric and hydrochloric acid. All analyses were carried out in duplicate. The compositions of the MPCs are given in .
Table 2. Composition of MPC80 after spray drying.
Particle size distribution
Particle size distribution of MPC80 powder was measured using a particle size analyser (S3500, Microtrac Company, USA) with the wet method. The refractive indices for the particle and dispersant (deionized water) were 1.59 and 1.333, respectively. To classify the change in particle size during reconstitution, a 5% (w/w) MPC80 solution was prepared in distilled water at 25°C and stirred at 2000 rpm for 2 min, then stayed still. A subsample of this dispersion was added dropwise to the loading slot. The granulometric distribution was measured every 10 min during the first hour, and every 60 min until the end of the experiment. The whole measurement lasted for 1000 min. The general-purpose model for irregular particles was used to analyse the data. Particle size was reported to be D50, which represented the average particle size of the samples.
Surface hydrophobicity (H0) determination
H0 was measured using 8-anilino-1-naphthalene sulphonate (ANS) as the fluorescent probe according to the method described by Hayakawa and Nakai.[Citation7] The 5% (w/w) protein dispersions were diluted with phosphate buffer (0.1 M, pH 7) to cover a concentration range of 0.05–0.4 mg/mL. The fluorescence intensity (FI) was measured using a fluorescence spectrometer (F-2500, Hitachi, Ltd., Japan) (390 nm excitation wavelength, slit 2.5 nm; 468 nm emission wavelength, slit 2.5 nm) with a scanning speed of 5 nm/s. H0 was expressed as the initial slope of the plot of fluorescence intensity as a function of protein concentration.
Solubility determination
A 5% (w/w) solution of each MPC80 powder was prepared in distilled water at 25°C. The solubility was measured every 30 min during the prior 8 h, and every 60 or 120 min until the end of the experiment. During the soluble process, subsamples of MPC80 solutions were taken and centrifuged at 4400 g for 10 min, and supernatants were obtained. The total solid content in both the supernatant and original MPC80 solutions was determined using a drying method.[Citation8] Solubility was calculated using the following equation and the whole soluble process was kept at 25°C:
Sodium dodecyl sulphate-polyacrylamide gel electrophoresis (SDS-PAGE)
Before evaporation, all the MPC80 retentates were analysed by SDS-PAGE using EPS 301 electrophoresis apparatus (GE Healthcare Laboratories, Richmond, CA, USA) and Mini VE electrophoresis tank (Amersham Biosciences Company, USA). MPC80 retentates were diluted using a sample buffer with reductive agent 2-β-mercaptoethanol in a 4:1 volume ratio followed by immersion in boiling water for 5 min to denature all the proteins. Samples were electrophoresed with a 12% polyacrylamide resolving gel and a 5% acrylamide stacking gel. Each well of the stacking gels was loaded with 10 μL samples. Gels were run at 50 V until migration front reached the resolving gel and 150 V for the remaining of the electrophoresis. Electrophoresis typically lasted for 2 h. After electrophoresis, the gels were stained using Coomassie Brilliant Blue R-250 stain solution (GE Healthcare Laboratories). After staining for about 2 h, the gels were de-stained until a clear background was achieved. The molecular weight of each band was determined using low-molecular-weight-SDS (LMW-SDS) marker kit (17-0446-01, GE Healthcare, USA) as molecular weight standards consisting of proteins in the range of 14.4 ~ 97 ku. SDS-PAGE gels were scanned using an Alpha Ease FC gel imaging system (Alpha Inc., USA).
Fourier transform infrared (FTIR) spectroscopy
Equipment
Protein secondary structures were analysed with FTIR spectroscopy using a nitrogen-purged Shimadzu FTIR-8400S spectrometer fitted with a Pike MIRacle ATR and a triglycine sulphate detector. The spectra were obtained at a resolution of 4 cm−Citation1 by co-adding 32 interferograms. The scanning range was between 4000 and 400 cm−Citation1. The samples and KBr were mixed and rubbed in a suitable proportion. The powders were then tableted and placed on the ZnSe crystal of the optical cell. Two separate experiments were conducted for each sample.
Data treatment
All treatments were carried out using Spectrum V3.02 software. Spectra were cut between 1700 and 1600 cm−Citation1 to analyse the amide I bands. Second derivatives of the spectra were calculated using the Savitzky–Golay method with 13-point smoothing to identify individual peak positions. The treated spectra were deconvoluted using a nonlinear regression curve-fitting program, and the Gaussian peaks were superimposed to the original spectra. Integrated areas of each peak were calculated and related to secondary structural features.[Citation9]
Preparation of analogue cheeses with MPC80
Analogue cheeses (16% w/w protein, 8.4% w/w fat, and 60% w/w moisture) were produced from a mixture of 20% w/w control or SCS–SPP (92:8)-modified MPC80, 28% w/w fresh cream (40% w/w fat and 42% w/w dry matter), 10% w/w starch (purchased from Ingredion China Limited), 37% w/w distilled water, 2% w/w ES [commercial mixture JOHA S4 (sodium salts of diphosphates and polyphosphates; obtained from JOHA, Benckiser-Knapsack, Ladenburg, Germany)], and 1% w/w colour and flavour agents.
Analogue cheeses were prepared with a Stephan twin-screw cooker (Stephan Machinery, Hameln, Germany). The processed cheese cooker was preheated to 80°C for 1 min; then, control or SCS–SPP (92:8)-modified MPC80, distilled water, starch, colour and flavour agents, and ES were added to the cooker and mixed at 50 rpm for 40 s at room temperature. During mixing, a minute amount of critic acid was added to adjust the pH of the final product to approximately 6.0. After mixing, the cheese was stirred at 100 rpm and continued to heat to 95°C by direct steam injection. The holding time at 95°C was 2 min. Samples were cooled to 50°C and poured into 0.5-kg pouches. Then, the analogue cheeses were stored at 4°C.[Citation10] The images of analogue cheeses were taken after the cheeses were cooled to 50°C ( and ).
Statistical analyses
Besides preparation of analogue cheeses, all the determinations were performed in duplicate, and each value represents the mean of two measurements from two independent treatments. The effect of ES treatment on the tested parameters was determined by ANOVA using statistical analyses with SPSS for Windows version 18.0 (SPSS Inc., Chicago, IL, USA). An alpha level of 0.05 (p < 0.05) was used to determine significance. Values that are statistically different are indicated by different superscripts.
Results and discussion
Composition of MPC80 powders
summarizes the composition of the MPC80 powders. We found no differences in the compositional parameters upon the addition of ES, except for total Ca and ash contents (p > 0.05). As expected, the total Ca concentration was lower in ES-treated powders than that in the control. Moreover, the Ca content of ES blends-fortified MPCs was significantly lower than the single-ES samples (p < 0.05). Different proportions of SCS and SPS blends presented the Ca content range from 1.32 g/100 g to 1.38 g/100 g.
Eshpari H. et al.[Citation11] showed that the acidification of milk by glucono-δ-lactone (GDL) before UF can significantly decrease the Ca content of MPC80 powders. Most of the calcium ions in MPC80 solutions are bound to phosphoserine residues or colloidal calcium phosphate (CCP) complexes. The added chelator competes with the phosphoserine residues and CCP in the CN micelle for the calcium ions and then forms the soluble Ca salts, which could be removed during UF or DF processing.[Citation12]
MPCs treated with different ratios of SPP and SPS blends resulted in the rapid gelation of the milk and the infeasible production of MPC. In the previous study, Clausi[Citation13] reported that a combination of SPP and SPS can be used to create instant milk pudding. The addition of SPS acted as an accelerator for the gelation to occur within 10 min, whereas gelation of milk took several hours with the use of SPP alone. One possible explanation was the bridging of Ca pyrophosphate complexes and CN by SPS.[Citation14]
Particle size determination
During MPC80 rehydration, subsamples were taken periodically and added into the stirred vessel to measure their particle size (D50) (). After dissolving for 10 min, particle size (D50) of control MPC80 was 33 μm, which decreased to 20.67 μm for the addition of SPS. Particle swelling was observed during the first 60 min after powder dissolution. Reconstitution or dissolution of food powder generally consists of four steps or phases: wetting of powder particles, sinking, dispersing, and complete particle dissolution. The dissolution process generally occurs in the sequence as indicated above.[Citation15] Particle size increased during the wetting and sinking stages. clearly shows that during the first 60 min the particles tended to swell. We attributed this phenomenon to the wetting and sinking stages.
Figure 1a. The particle size profile of control and emulsifying salts (ES) modified milk protein concentrate 80 (MPC80) during hydration within 1000 min The error bars on experimental data represent the standard deviation between different experimental runs. Similarly hereinafter.
Figure 1b. The prior 60 min hydration of milk protein concentrate 80 (MPC80) was magnified to clearly compare the particle size changing trend.
Following swelling, the particle size (D50) of the control sample decreased from 40.12 μm to 10.36 μm. After 720 min, the particle size (D50) stabilized at 10.36 ~ 10.39 μm, signalling the end of rehydration. Adding different ES hastened the stabilization of particle size (D50). The addition of SCS shortened the process to about 360 min, and SPP or SPS shortened it to 420 min. Measurements were taken up to 1000 min after powder dissolution to confirm that the particle size (D50) remained constant during further reconstitution. The two latter stages of dispersing and dissolving were clearly the rate-limiting steps of MPC80 dissolution.
At a total ES concentration of 0.3%, as compared with the monomer ES, SCS–SPP (50:50) decreased the particle size (D50) stabilization time (). Other ratios of SCS–SPP mixtures showed the same trend (data not shown). Combining SCS with SPP or SPS had a synergistic effect in decreasing the MPC80 particles. Different kinds of ES competed with CN for CaCitation2+, which may accelerate the decrease in particle size.
For mixtures of SCS–SPP, a significant decrease in particle size (D50) was observed (p < 0.05) when a high concentration of SCS was used (). SPP had little effect on particle size (D50) compared with SCS. The MPC80 modified by SCS–SPS exhibited lower particle size (D50) than the SCS–SPP mixtures at similar proportions of SCS and total ES concentrations (0.3%, w/w).
Figure 2. Effect of binary emulsifying salts (ES) in 3 different proportions (8:92, 50:50, and 92:8) on the particle size of milk protein concentrate 80 (MPC80).
ES could easily be bound with calcium ions, which were originally associated with the phosphoserine residues or casein calcium phosphate (CCP) in the CN micelle. SCS could bind to CaCitation2+ from indigenous CCP and form soluble Ca citrate complexes, thereby decreasing the particle size (D50) of MPC80.[Citation12] Different kinds of ES have different affinities for calcium ions, which allowed them to release different amounts of CCP from the micelle. SPP is less likely to interact with CaCitation2+compared with SCS because of the charge distribution around the SPP molecule; thus, crosslinking is inhibited.
Surface hydrophobicity (H0)
Compared with the control, H0 values increased significantly with the addition of monomer ES (p <0.05) (). The H0 value of MPC80 fortified with SCS increased by 18.61%. This result was consistent with the observation by Mao et al.,[Citation16] in which H0 of the MPC80 powder treated with NaCl was significantly higher than that of the control when ANS was used as a probe. The increase in ANS-based H0 reflected the existence of suitable hydrophobic “clefts” for ANS binding, i.e., more exposed ANS-binding hydrophobic moieties. The increase in ANS-based H0 may be attributed to milk protein unfolding, which leads to changes in the protein structure and a more exposed hydrophobic protein interior.[Citation16]
Figure 3. Hydrophobicity (H0) of control and single emulsifying salts (ES) modified milk protein concentrate 80 (MPC80).
Mixtures of SCS combined with different proportions of SPP or SPS had higher H0 than both the control or single-ES-fortified MPC80 (). These results were consistent with the decrease in particle size, thereby suggesting that mixtures of SCS–SPP and SCS–SPS prevented the formation of aggregates and increased H0. Besides protein–protein hydrophobic interactions, sulfhydryl and disulphide interactions may also influence H0. However, unfolding may be followed by protein aggregation through hydrophobic or SH–SS interchange reactions.[Citation17] Intermolecular crosslinks are not necessary for gelation, but they may produce more stable gels.[Citation18] Hence, research on H0 focuses on protein aggregation/gelation because intermolecular hydrophobic interactions dominate gel network formation.
Figure 4. Effect of binary emulsifying salts (ES) in 3 different proportions (8:92, 50:50, and 92:8) on the hydrophobicity (H0) of milk protein concentrate 80 (MPC80).
Solubility determination
The protein powder needs to be dispersed and dissolved to fully function as an ingredient. Therefore, reconstitutability should be rapid and complete. ES addition had a marked effect on the solubility of MPC80 (). The solubility of MPC80 fortified with SCS, SPS, and SPP improved by 80.32, 78.23, and 55.80%, respectively (). Addition of ES mixtures (SCS–SPP and SCS–SPS) also resulted in increased solubility (), which indicated the likely dispersion of CN particles. At a total ES of 0.3%, the solubility of SCS–SPP mixtures increased from 75.14% to 83.79% with increased SCS proportion. Different proportions of SCS and SPS also improved the solubility of MPC80 powders ranging from 63.13% to 67.46%.
Figure 5a. The solubility profile of emulsifying salts (ES) modified milk protein concentrate 80 (MPC80) during hydration within 1000 min.
Figure 5b. The prior 60 min hydration of milk protein concentrate 80 (MPC80) was magnified to clearly compare the solubility changing trend.
Figure 6. Effect of binary emulsifying salts (ES) in 3 different proportions (8:92, 50:50, and 92:8) on the solubility of milk protein concentrate 80 (MPC80).
Several authors have attributed the effect of ES on the solubility of high-protein powder to changes in the structure of CN micelles. Bhaskar et al.[Citation19] reported a method to improve MPC80 solubility using a chelating agent. Schuck et al.[Citation20] also found a positive effect of citrate on solubility, but with much higher concentrations (30 g per 100 g total solids) than the present study.
Increased MPC80 solubility may also be attributed to the change in ionic environment with the addition of ES. The ionic environment influences protein–protein aggregation. High ionic strength can increase protein solubility by increasing protein hydration.[Citation21] Sikand et al.[Citation22] studied the influence of adding salt during the DF stage on the solubility and turbidity of MPC80. Their results showed that mineral types and ionic strength influence MPC solubility.
The types and concentrations of salts used in our study were chosen because they could change the equilibration of calcium and CNs between CN micelles and the serum phase to a limited extent. Mineral salts would lead to partial calcium depletion and CN dissociation from micelles into the serum phase.[Citation20] The concentration of the salts was low enough so the micelles would not flocculate or completely disintegrate.[Citation23] Thus, improved solubility was attributed to reduced micellar interaction and the increased release of non-micellar CN .[Citation24]
From , we observed that the amount of dissolved material increased with the dissolution time, which could be related to the above research on the change of particle size. Depending on the curves of solubility as a function of time, we may divide the solubility profiles of MPC80 into four stages: wetting, sinking, dispersing, and dissolving. After 1000 min, the solubility of all samples remained stable. Thus, for MPC80, poor solubility indicated a decreased reconstitution rate of the powder rather than insoluble material formation.
SDS-PAGE
SDS-PAGE was used to determine whether increased hydrophobicity and surface charge could alter the interaction between protein molecules and lead to dimer or aggregate formation. To avoid gelling behaviour for the sample with SPS–SPP, subsamples for SDS-PAGE were obtained instantly before the gelling formation. SDS-PAGE patterns for MPC80 rententates are presented in . The SDS-PAGE pattern showed no significant difference between the control and single-ES-modified samples. The intensity of major protein bands (αs-CN, β-CN, κ-CN, bovine serum albumin, α-lactalbumin, and β-lactoglobulin) in control or single-ES-modified MPC80 was stronger than that in the binary mixtures. Aggregate formation (high-molecular-weight bands, >60 kDa) decreased for the binary mixtures. This could be explained from the data in . The difference in the relative content of bovine serum albumin in the control and single-ES-modified samples was not significant (p>0.05),while binary-ES-modified MPC80 presented a lower relative protein content. In addition, the other types of proteins showed the same trend. These observations suggested that adding ES results in less complex formation, which could also be associated with the higher solubility of ES-treated MPC80. We speculated that MPC80 with binary mixtures of ES induced the solubilization of CN and whey protein. Ahmad et al.[Citation25] attributed these changes to modifications in mineral equilibrium and protein ionization, which induced structural changes in CN micelles.
Table 3. Relative content of the main protein in different ES-fortified MPC80.
Figure 7. Sodium dodecyl sulphate–polyacrylamide gel electrophoresis (SDS-PAGE) bands of milk protein concentrate 80 (MPC80). M=molecular weight standard (ku); Lanes 1-7= SPP–SPS (50:50), SCS–SPS (50:50), SCS–SPP (50:50), control, SCS, SPP and SPS, respectively.
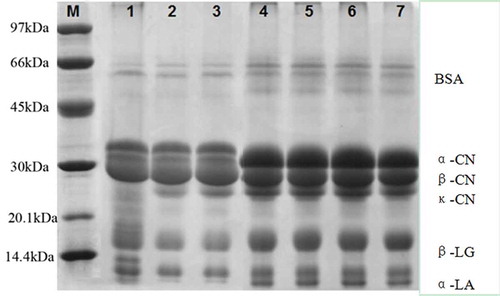
The band between κ-CN and β-LG was more disperse in the SPP–SPS mixture than that in other binary mixtures. This finding suggested that SPP and SPS bound indigenous CCP in CN particles and formed new Ca–CCP complexes with lower molecular weight. Mao et al.[Citation16] studied the SDS-PAGE patterns for MPC80 with and without NaCl addition during DF processing. The native SDS-PAGE in their research showed that the formation of aggregates (>200 kDa) decreased with NaCl addition, and aggregate intensity was the lowest with the addition of 150 mM NaCl during DF. This finding was similar to our results. The effect of ES and monovalent salts or other types of salts on MPC80 properties differed and required further research.
FTIR
Infrared spectroscopy is a useful technique that allows the monitoring of secondary structural changes in proteins. The main features of MPC were protein and sugars (1200–1000 cm−Citation1). The spectra were typical for proteins with the main features observed in the following regions: amide A (3280–3225 cm−Citation1), amide I (1700–1600 cm−Citation1), amide II (1450–1550 cm−Citation1), and amide III (1350–1200 cm−Citation1). Of these regions, the amide I region was often utilized for protein conformation analysis. The following structures were assigned: 1700–1660 cm−Citation1, β-turn; 1652–1648 cm−Citation1, α-helix; 1648–1642 cm−Citation1, unordered; and 1640–1620 cm−Citation1, β-sheet. One commonly used method to assess components present in the band envelope is second derivative spectroscopy.[Citation26]
Areas calculated from the fitted spectra were proportional to conformational elements that were assigned and are presented in . The total distribution in β-sheet and β-turn was approximately 50% for amide I, and the β-sheet content of ES-fortified MPC80 was quite higher than that of the control (p < 0.05). Single-SCS-fortified MPC presented the highest β-sheet content with a relative intensity value of 176.47. In our research, the MPC80 with a higher β-sheet content had a higher solubility. Kher et al.[Citation27] concluded that bands in the region 1640–1620 cm−Citation1 attributable to the β-sheet were correlated with changes in the solubility of MPC powders, which was consistent with our results.
Figure 8. Structural components (β-turn, α-helix, unordered and β-sheet) percentage areas obtained for milk protein concentrate 80 (MPC80) measured from amide I.
The unordered structures content of binary-ES-fortified MPC80 was significantly improved. The relative intensity values for SCS–SPP (50:50) and SCS–SPS (50:50) were 225.84 and 435.83, respectively. SCS-fortified samples presented less unordered structure content with a rather lower relative intensity value of 70. Therefore, we concluded that binary ES easily changed the secondary structures of the protein and formed more unordered structures. No significant difference in the α-helix contents was observed for all MPC80 (p>0.05). Hussain et al.[Citation28] showed that the distributions in the α-helix, β-sheet, β-turn, and unordered structures for amide I in water were approximately 22, 40, 1, and 22% at 30°C, respectively, and 20, 62, 7, and 11% at 90°C, respectively. These results were consistent with those found in the literature for globular proteins.[Citation29]
Analogue cheeses with MPC80
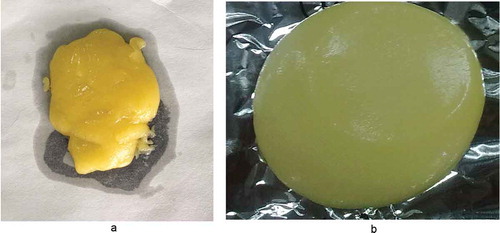
From the above result, MPC80 fortified with SCS–SPP (92:8) presents the best solubility. In our study, the analogue cheeses made with SCS–SPP (92:8)-modified MPC80 and control MPC80 were produced and the images were taken. Analogue cheeses made with SCS–SPP (92:8)-modified MPC80 presented a homogeneous smooth fluid mass and a whiter colour (). In contrast, analogue cheeses made with the control MPC80 exhibit considerable oiling-off and a rough texture. In addition, some “nuggets” were formed on the surface of the analogue cheese (). Generally, analogue cheese presented numerous small particles of fat dispersed in a uniform protein network. The fat consisted of a network of triglyceride crystals connected by primary bonds originated in strong Van der Waal interactions.[Citation30] During processing of the analogues, the stirring and heating resulted in the rupture of these bonds, and the melted fat formed particles of variable diameter, which were captured and emulsified by the milk protein.[Citation31] This oil-off of analogue cheese with control MPC80 indicated that the emulsification process was insufficient to break and disperse the mass of hydrogenated fat. The insufficient emulsification process could also lead to the rough texture. We speculated that if more amount of ES was added, prolonged the stirring time, or increased the stirring time to promote the emulsification process, the texture of analogue cheese may be improved and tend to be a smooth fluid. Therefore, further research should be continued.
Figure 9. Illustrations of the analogue cheeses made by control (a) and SCS–SPP (92:8) modified milk protein concentrate 80 (MPC80) (b) during the process of cooling to 50°C.
Conclusion
Our results demonstrated several beneficial effects of ES incorporation before the evaporation on MPC80 functionality. The increase in solubility after the addition of ES indicated the likely dispersion of CN particles. Binary-ES-fortified MPC80 induced the solubilization of CN and whey protein, which may be attributed to decreased aggregate formation (high-molecular-weight bands, >60 kDa). The band between κ-CN and β-LG was more disperse for the SPP–SPS mixture, which may help form protein aggregation or gelation. Infrared spectroscopy results showed that the secondary structure of MPC80 was modified with the addition of ES, thereby exposing the hydrophobic interior of the protein. We also chose the SCS–SPP (92:8)-modified MPC80, which presented the best solubility to produce the analogue cheese. Compared to analogue cheese made from control and SCS–SPP (92:8)-modified MPC80, the former one presented a less-homogeneous fluid mass. In addition, some “nuggets” were formed on the surface. The present study only revealed the images of the analogue cheeses. Further detailed attributes need to be evaluated, such as rheology, meltability, microstructure, sensory, and so on, which will help produce the improved quality of analogue cheeses in industrial production.
Funding
This research was financially supported by the Bright Dairy and Food Co., Ltd. through the Project “The National Science & Technology Pillar Program during the Twelfth Five-year Plan Period” (2013BAD18B02).
Additional information
Funding
Related Research Data
References
- Sun, Y.J.; Chen, J.H; Zhang, S.W.; Li, H.J.; Lv, J.P. Effect of Power Ultrasound Pre-Treatment on the Physical and Functionalproperties of Reconstituted Milk Protein Concentrate. Journal of Food Engineering 2014, 124, 11–18.
- Codex Alimentarius Commission, 1995. Codex General Standard for Food Additives, Food and Agriculture Organization of the United Nations, 192–195.
- James, W.M.; Hugh, A.D., Anthony, M.M.; Richard, S.S.; Michael, A.H. Continuous On-Demand manufacture of Process Cheese. US 6183, 804 B1, 2001
- So1owiej, B.; Cheung, I.W.Y.; Li-Chan, E.C.Y. Texture, Rheology and Meltability of Processed Cheese Analogues Prepared using Rennet or Acid Casein With or Without Added whey Proteins. International Dairy Journal 2014, 37, 87–94.
- Cornell, J.A. Experiments with Mixtures: Designs, Models and the Analysis of Mixture Data, 2nd ed; John Wiley & Sons Inc., New York, NY, 1990.
- Standards Australia 1995. Methods of chemical and physical testing for the dairying industry—Introduction and lists of methods.AS 2300.0-1995. Stand. Aust., Sydney, Australia.
- Hayakawa, S.; Nakai, S. Relationships of Hydrophobicity and Net Charge to the Solubility of Milk and Soy Proteins. Journal of Food Science 1985, 50, 486–491.
- Carr, A.J. 1999. The Functional Properties of Milk Protein Concentrate ( PhD Thesis). New Zealand: Massey University.
- Hussain, R.; Gaiani, C., Aberkane, L.; Ghanbaja, J.;Scher, J. Multiscale Characterization of Casein Micelles under NaCl Range Conditions. Food Biophys 2011, 6, 503–511.
- Shirashoji, N.; Jaeggi, J.J.; Lucey, J. A. Effect of Trisodium Citrate Concentration and Cooking Time on the Physicochemical Properties of Pasteurized Process Cheese. Journal of Dairy Science 2006, 89, 15–28.
- Eshpari, H.; Tong, P.S.; Corredig, M. Changes in the Physical Properties, Solubility, and Heat Stability of Milk Protein Concentrate Prepared from Partially Acidified Milk. Journal of Dairy Science 2014, 97(12), 7394–7401.
- Esther, K.; Minor, M.; Snoeren, T.; Hooijdonk, T.V.; Linden, E.V.D. Effect of Calcium Chelators on Physical changes in Casein Micelles in Concentrated Micellar Casein Solutions. International Dairy Journal 2011, 21, 907–913.
- Clausi, A.S. (1957). Pudding composition and process of producing the same.General Foods Corporation assignee, US Patent 2, 801–924.
- Kaliappan, S.; Lucey, J.A. Influence of Mixtures of Calcium-Chelating Salts on the Physicochemical Properties of Casein Micelles. Journal of Dairy Science 2011, 94, 4255–4263.
- Famelart, M.H.; Le Graët, Y.; Raulot K. Casein Micelle Dispersions into Water, NaCl and CaCl2: Physicochemical Characteristics of Micelles and Rennet Coagulation. International of Dairy Journal 1999, 9, 293–297.
- Mao, X.; Tong, P.; Gualco, S.; Vink, S. Effect of NaCl Addition during Diafiltration on the Solubility, Hydrophobicity, and Disulfide Bonds of 80% Milk Protein Concentrate Powder. Journal of Dairy Science 2012, 95, 3481–3488.
- Laligant, A.; Dumay, E.; Valencia, C.; Cuq, L.; Cheftel, J.C. Surface Hydrophobicity and Aggregation of β-lactoglobulin Heated under Neutral pH. Journal of Agriculture and Food Chemistry 1991, 39, 2147–2155.
- Mine, Y. Recent Advances in the Understanding of Egg White Protein Functionality. Trends in Food Science & Technology 1995, 6(7), 225–232.
- Bhaskar, G.V.; Singh, H.; Blazey, N.D. 2003. Milk protein products and processes. US Patent US 2003/0096036.
- Schuck, P.; Davanel, A.; Mariette, F.; Briard, V.; Méjean, S.; Piot, M. Rehydration of Casein Powders: Effects of Added Mineral Salts and Salt Addition Methods on Water Transfer. International Dairy Journal 2002, 12, 51–57.
- Xiong, Y.L. Influence of pH and Ionic Environment on Thermal Aggregation of whey Proteins. Journal of Agriculture Food Chemistry 1992, 40, 380–384.
- Sikand, V.; Tong, P.; Walker, J. Effect of Adding Salt during the Diafiltration Step of Milk Protein Concentrate Powder Manufacture on Mineral and Soluble Protein Composition. Dairy Science and Technology 2013, 93(4), 401–413.
- Zhang, Z.; Goff, H.D. Protein Distribution at Air Interfaces in Dairy Foams and Ice Cream as Affected by Casein Dissociation and Emulsifiers. International Dairy Journal 2004, 14, 647–657.
- Schokker, E.; Church, J.; Mata, J.; Gilbert, E.; Puvanenthiran, A.; Udabage, P. Reconstitution Properties of Micellar Casein Powder: Effect of Composition and Storage. Internal Dairy Journal 2011, 20, 877–886.
- Ahmad, S.; Plot, M.; Rousseau, F.; Grongnet, J.; Gaucheron, F. Physico-Chemical Changes in Casein Micelles of Buffalo and Cow Milk as a Function of Alkalinisation. Dairy Science and Technology 2009, 89, 387–403.
- Byler, D.M.; Susi, H. Examination of the Secondary Structure of Proteins Bydeconvolved FTIR Spectra. Biopolymers 1986, 25, 469–487.
- Kher, A.; Udabage, P.; McKinnon, I.; McNaughton, D.; Augustin, M.A. FTIR Investigation of Spray-dried Milk Protein Concentrate Powders. Vibrational Spectroscopy 2007, 44, 375–381.
- Hussain, R.; Gaiani, C.; Jeadel, C.; Ghanbaja, J.; Scher, J. Combined Effect of Heat Treatment and Ionic Strength on the Functionality of whey Protein. Journal of Dairy Science 2012, 95, 6260–6273.
- Panick, G.; Malessa, R.; Winter, R. Differences between the Pressure- and Temperature-induced Denaturation and Aggregation of β-lactoglobulin A, B, and AB Monitored by FTIR Spectroscopy and Small-angle X-ray Scattering. Biochemistry 1999, 38, 6512–6519.
- Deman, J.M.; Beers, A.M. Fat Crystal Networks: Structural and Rheological Properties. Journal of Texture Studies 1988, 18, 303–318.
- Clarissa, R.C; Dias A.I.; Walkiria H.V. Microstructure, Texture, Colour and Sensory Evaluation of a Spreadable Processed Cheese Analogue made with Vegetable Fat. Food Research International 2010, 43, 723–729.