
ABSTRACT
Freezing of water-rich materials inevitably leads to changes in volume and thermal stresses. Determining and modeling the thermal stresses require the mechanical properties of the food material to be properly measured or predicted during freezing. This paper investigated mechanical properties such as the Young’s modulus and Poisson’s ratio in chicken nugget crust and crumb samples at the different freezing temperatures (‒20, ‒30, and ‒40°C). Mechanical properties were measured by compression tests at seven nugget-center temperatures and a continuous video capturing method during the freezing process. Results showed that ice formation led to a sharp increase in the Young’s modulus of samples, however, a gradual decrease in Poisson’s ratio values was observed as the nuggets’ center temperature approached the freezing point. Therefore, the greatest changes were observed at the freezing point. Kinetic and fitting equations were used to model the Young’s modulus, and the Arrhenius equation was used to describe the temperature dependence. The predicted values by the models were found in close agreement with the experimental results.
Introduction
Freezing is an important refrigeration process widely used in food preservation.[Citation1] Depending on different factors, protein denaturation and textural defects might arise during the freezing process.[Citation2] Freezing may cause severe changes in the macroscopic properties of food products including dramatic textural changes due to cryoconcentration and mechanical stresses.[Citation3] Textural changes during freezing may ultimately lead to qualitative deterioration of food products.[Citation4]
Investigation of the mechanical properties of solid foods with large deformation is an important aspect of the food science, engineering, and technology.[Citation5] Moreover, investigation of the mechanical properties of frozen foods is a very attractive and challenging area. When foods or other biomaterials are frozen, the expansion associated with phase changes and the subsequent contraction due to further cooling create mechanical stresses that may lead to deformation, large-scale cracking, or micro-structural damages.[Citation6] Many studies have been reported on the measurement and prediction of mechanical and fracture properties of various kinds of foods.[Citation7–Citation11] One aspect that has been relatively neglected in food freezing research is the prediction of freezing-induced stresses and cracking that depend on the measurement of certain physical properties such as Young’s modulus, Poisson’s ratio, porosity, density, and water content. These factors exhibit gradual changes as a result of gradual phase changes, which make their measurement difficult due to the interactions between the mechanical properties and the ice–water transition.[Citation12] Nevertheless, any theoretical treatment of the subject needs to take into account such gradual and slight changes in the relevant mechanical properties.
McKellar et al.[Citation6] assumed that mechanical properties are a function of the frozen fraction. They used a number of theoretical equations to relate the modulus to the frozen fraction, but none showed corresponding relations with their experimental data. They, therefore, used an empirical equation which gave a good fit in the range between ‒20°C and the freezing point. By measuring the values of Young’s modulus and Poisson’s ratio of potato before and after freezing, Shi et al.[Citation13–Citation14] observed that the mechanical properties of biomaterials containing large amounts of water change significantly during freezing. When the temperature of potato (with a water content of about 75%) was reduced from 0 to ‒20°C, its modulus increased by two orders of magnitude. In their experiments, they recorded Poisson’s ratio of 0.42 and 0.33 before and after freezing, respectively.
Kim and Hung[Citation15] measured 10 physical properties for 22 different materials at room temperature and at ‒20°C. They found that not only the moisture content but also a combination of several properties contribute to changes in mechanical properties such as Poisson’s ratio and Young’s modulus. Tremeac et al.[Citation12] used the tensile test to determine the Young’s modulus, Poisson’s ratio, and bulk modulus of two different materials (chocolate and tylose) at two different temperatures above and below the freezing point. Young’s modulus was found to remain constant before freezing but increased rapidly after freezing. The unfrozen tylose had a higher Poisson’s ratio than the partially frozen one. In the case of chocolate, the variation in Poisson’s ratio with changes in temperature was observed to be negligible.
Freezing induces textural damage in foods, especially in two-component food products such as chicken nuggets. Our literature review presented above indicates that the mechanical properties such as Young’s modulus and Poisson’s ratio pose challenges to model the stresses and strains caused by freezing. To our knowledge, no previous research has been reported on the evolution and prediction of the Young’s modulus and Poisson’s ratio in two-component foods during freezing. The present study mainly focused on the effects of freezing on the mechanical properties of chicken nuggets as a two-component food. Young’s modulus and Poisson’s ratio of chicken nugget crust and crumb were evaluated at different temperatures during freezing. Also, the effects of temperature and ice formation on the Young’s modulus of chicken nugget crumb and crust were investigated. Finally, equations were developed to predict the values of Young’s modulus during the freezing of chicken nuggets.
Materials and methods
Sample preparation
The fresh pre-fried chicken nuggets were provided by a ready-to-eat products supplier (Paplos Co., Isfahan, Iran). The chicken nuggets were received in cylindrical shape, 4 × 2.2 cm in size, and 20 g in weight. Moreover, cylindrical samples of 4.35 × 1.24 cm were prepared with the same composition as that of the nugget crust. All the samples were then pre-fried at 180°C for 100 s and stored in polyethylene bags at 4 ± 1°C. Before experiments, the samples were removed from the refrigerator and allowed to warm to room temperature. Crumb samples, 3.44 × 1.67 cm in size, were obtained by separating the whole crust of each sample. presents the properties of the samples used in the experiments. The porosity of each sample was determined as the difference between its real and apparent density.
Table 1. Properties of the crumb and the crust of the chicken nuggets used.
Freezing
Crumb and crust samples were frozen in an air-blast freezer (Grouc, P500, Iran) operated at ‒20, ‒30, and ‒40°C with an air velocity of 1.5 m/s. Three replications were performed for each experiment. Seven samples were placed in the freezer and the center temperature of one sample was monitored using a K-type thermocouple (copper vs. constantan). At target temperatures of 9, 0, ‒3, ‒3.5, ‒5, ‒10, and ‒15°C for the nugget crumb and 9, 0, ‒5, ‒10, ‒15, ‒20, and ‒25°C for the nugget crust, one sample was removed from the tunnel and immediately subjected to texture analysis.
Instrumental textural analysis
Texture analysis (TA) was carried out to measure the Young’s modulus and Poisson’s ratio of the chicken nugget crumb and crust samples using a texture analyzer (model TA-XT2 Stable Microsystems, Ltd., Surrey, UK) equipped with a 500 N load cell. Compression tests were carried out using a 5 cm cylindrical probe, which compressed the samples at a rate of 20 mm/min. Poisson’s ratio was measured using a video image acquisition device (Canon, Tokyo, Japan) with a resolution of 600 dpi. An image analysis software (Image J, W. Rasband, National Institutes of Health, Bethesda, USA) was used to assess the cross-section compaction of the samples during the compression test. Axial strain was measured by the texture analyzer, and transverse strain was obtained by image analysis.
Poisson’s ratio, ν, was calculated using Eq. (1):
where εy and εz represent strains in the radial and axial directions, respectively.[Citation16] illustrates the procedure used for measuring the Poisson’s ratio of a cylindrical sample exposed to the uniaxial compression test. For each specified freezing temperature, three samples were used to measure the Young’s modulus. The mean value for each measured parameter was reported.
Figure 1. Determination of Poisson ratio using the uniaxial compression test.
Statistical analysis
The experiments were performed in a completely randomized design with three replications. Analysis of variance was carried out using the SAS statistical software, release 6.12 (SAS Institute, Cray, NC, USA). The least significant difference (LSD) test was performed on the treatment means data (p < 0.05).
Results and discussion
Temperature profile
Figure 2. Temperature profiles of nugget crumb and crust samples frozen at different temperatures.
Poisson’s ratio
Poisson’s ratio is defined as the ratio of lateral to axial strain, indicating material expansion perpendicular to the compression direction.[Citation15] In this experiment, no significant differences were observed between the nugget crumb and crust samples with respect to their Poisson’s ratio values at the freezing temperatures (‒20, ‒30, and ‒40°C). Hence, only the changes observed in the mean Poisson’s ratios of the crumb and crust samples during freezing at different temperatures are reported in first mention Based on the results, a gradual and significant decrease occurred in Poisson’s ratio as the nugget-center temperature approached the freezing point; the greatest changes were ultimately observed at the freezing point. Finally, it was observed that frozen samples have exhibited lower values of Poisson’s ratio than the non-frozen samples. This could be explained by the lower values of Poisson’s ratio in crystalline materials such as ice.[Citation17] Tremeac et al.[Citation12] observed significant differences between the values of Poisson’s ratio in tylose gel before and after freezing; however, no differences between the unfrozen and frozen zones were reported. They also demonstrated that Poisson’s ratio did not vary with temperature in chocolate. The higher Poisson ratio of crumb, compared with that of crust, may be attributed to the greater porosity of the crust. Porosity represents the percentage of the void spaces in a food material. The larger the void spaces, the greater amount of axial strain instead of lateral strain.[Citation15]
Figure 3. Mean Poisson’s ratios of nugget crumb and crust during freezing at different temperatures.
Kim and Hung[Citation15] revealed that Poisson’s ratio have a wide range of values depending on the type of food. They reported that the Poisson’s ratio of meat products was in the range of 0.05 to 0.4. Shi et al.[Citation14] used a Poisson’s ratio of 0.42 for unfrozen potato and 0.33 for its fully frozen counterpart. The values recorded in the present study for Poisson’s ratio ranged from 0.37 at 9°C to 0.11 at ‒15°C for the nugget crumb samples, while the value ranged from 0.26 at 9°C to 0.07 at ‒25°C in the case of the nugget crust samples.
Young’s modulus
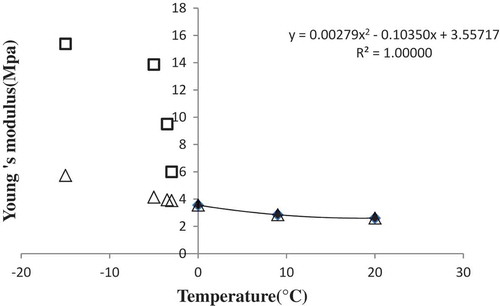
The compression tests revealed no significant differences among the freezing temperatures of ‒20, ‒30, and ‒40°C in the values of Young’s modulus measured in either chicken nugget crumb or crust samples. Thus, and 4b first mention present only the mean values of Young’s modulus for both samples during the freezing process. As can be seen, the measured values of Young’s modulus increased with reducing the nugget center temperature.
Figure 4. Mean values of Young’s modulus for (a) nugget crumb, and (b) nugget crust during freezing at different temperatures.
There were no significant differences in the crust and crumb samples at nugget center temperatures above the freezing point; beyond the freezing point, however, the differences became significant. and also indicate that the values of Young’s modulus in the frozen samples rose sharply by 2 to 3 orders of magnitude compared with those for the non-frozen samples after ice crystal formation beyond the freezing point. This finding is in agreement with those reported by other researchers.[Citation12,Citation19,Citation20] Young’s modulus shows a negative trend with increasing the moisture content, which may explain the higher value of Young’s modulus observed for the nugget crust.[Citation21]
It seems that both the temperature decline and ice formation are responsible for enhancements in Young’s modulus. The enhancement observed after the ice crystals’ formation might be due to the fact that ice dendrites start to fuse into a lattice at sub-freezing temperatures.[Citation19] In the present work, the freezing point depression equation proposed by Schwatzberg[Citation22] was used to calculate the mass fraction of the ice below the freezing point.
where T and x were temperature (K) and mass fraction (kg/kg product), respectively, and subscripts i, tw, b, and f were ice, total water, bound water (unfrozen at –40°C), and freezing point, respectively. In a recent study, Young’s modulus was modeled as a function of storage time for persimmon’s cultivars.[Citation23] In this research, the Young’s modulus values were calculated for the nugget crumb samples as a function of the temperature and the mass fraction of ice as described in the following lines. In the first procedure, since the Young’s modulus is a function of both temperature and the ice fraction, the experimental values of Young’s modulus above the freezing point were fitted to a second-order polynomial Eq. (3):
where a = 0.003, b = 0.100, and c = 3.560.
The effect of the ice fraction was then determined by subtracting the extrapolated values using Eq. (3) below the freezing point from experimental values of the Young’s modulus. shows the effects of the ice fraction and temperature on Young’s modulus. The influence of the ice fraction on Young’s modulus was described using the following equation:
Figure 5. Effect of the ice fraction and temperature on the Young’s modulus of nugget crumb (: Amounts of Young’s modulus above the freezing point;: amounts of Young’s modulus below the freezing point;: amounts of extrapolated Young’s modulus;: fitted values of Young’s modulus by second-order polynomial equation).
where k = 8.55 and Emax = 9.7. Finally, the total values of the Young’s modulus containing the effects of the temperature and the ice fraction could be calculated using the following equation:
In the second procedure, an equation was developed by fitting the experimental data in MATLAB surface fitting tool software, as shown in Eqs. (6) and (7) for the nugget crumb and crust samples, respectively:
The temperature dependence of the mean values of Young’s modulus at each freezing temperature (i.e., ‒20, ‒30, and ‒40°C) was modeled using the Arrhenius equation as follows:
where Ea (activation energy, kJ/mol) was equal to 4729.25 for the nugget crumb samples and 3160.98 for the nugget crust ones, E0 (the pre-exponential factor) was equal to 0.66 for the nugget crumb samples and 17.29 for the nugget crust ones, R was the universal gas constant (8.314 J/mol K), and finally T was the absolute temperature (K). compares the theoretical values of Young’s modulus obtained from Eq. (8) with the experimental results during freezing of nugget crumb. As can be seen, the predicted values of Young’s modulus were in agreement with experimental data.
Figure 6. Comparison of theoretical and experimental values of Young’s modulus during freezing of nugget crumb.
Conclusion
In this paper, the compression test was employed to characterize the mechanical properties of the chicken nugget crumb and crust samples during freezing at different temperatures (‒20, ‒30, and ‒40°C). It was found that: (i) the effects of phase transition on the rigidity and Poisson’s ratio were significant in both types of samples; (ii) Young’s modulus increased sharply below the freezing point while Poisson’s ratio decreased gradually with reducing temperature, with the greatest decrease observed below the freezing point, and (iii) the nugget crust samples exhibited a higher Young’s modulus but a lower Poisson’s ratio because of its lower moisture content and higher porosity. Finally, the data were fitted to the appropriate equations to represent the effects of the ice fraction and temperature on the Young’s modulus. The findings of this study may be used in modeling the mechanical phenomena during the freezing of two-component foods.
Acknowledgments
Dr. E. Roustazadeh from IUT deserves our gratitude for editing the final English manuscript.
Funding
Isfahan University of Technology (IUT) is acknowledged for its financial support.
Additional information
Funding
References
- Hamdami, N.; Monteau, J.Y.; Le-Bail, A. Thermophysical Properties Evolution of French Partly Baked Bread During Freezing. Food Research International 2004, 37, 703–713.
- Diaz-Tenorio, L.M.; Garcia-Carreno, F.L.; Pacheco-Aguilar, R. Comparison of Freezing and Thawing Treatments on Muscle Properties of Whiteleg Shrimp (Litopenaeus vannamei). Journal of Food Biochemistry 2007, 31, 563–576.
- Talens, P.; Martinez-Navarrete, N.; Fito, P.; Chiralt, A. Changes in Optical and Mechanical Properties During Osmo Dehydrofreezing of Kiwi Fruit. Innovative Food Science and Emerging Technologies 2001, 3,191–199.
- Kuo, M.I.; Gunasekaran, S. Effect of Freezing and Frozen Storage on Microstructure of Mozzarella and Pizza Cheeses. LWT-Food Science and Technology 2009, 42, 9–16.
- Xu, X.; Jeronimidis, G.; Atkins, A.G. On the Yield Stress of Frozen Sucrose Solutions. Journal of Materials Science 2003, 38, 245–25.
- McKellar, A.; Paterson, J.; Pham, Q.T. A Comparison of Two Models for Stresses and Strains During Food Freezing. Journal of Food Engineering 2009, 95, 142–150.
- Dobraszczy, B.J.; Atkins, A.G.; Jeronimidis, G.; Purslow, P.P. Fracture Toughness of Frozen Meat. Meat Science 1987, 21, 25–49.
- Konstance, R.P. Axial Compression Properties of Kamaboko. Journal of Food Science 1991, 56, 1287–1291.
- Luyten, H.; Van Vliet, T. Fracture Properties of Starch Gels and their Rate Dependency. Journal of Texture Studies 1995, 26, 281–298.
- Raj, A.S.; Jayaram, R.; Dev, S.; Ravikumar, S. A Review on Recent Advances in Meat Processing. International Journal of Current Microbiology and Applied Sciences 2013, 2, 169–176.
- Ayati, S.-V.; Hamdami, N.; Le-Bail, A. Frozen Sangak Dough and Bread Properties: Impact of Pre-fermentation and Freezing Rate. International Journal of Food Properties 2016. DOI:10.1080/10942912.2016.1180535.
- Tremeac, B.; Hayert, M.; Le-Bail, A. Mechanical Properties of Tylose Gel and Chocolate in the Freezing Range. International Journal of Refrigeration 2008, 31, 867–873.
- Shi, X.; Datta, A.K.; Mukherjee, Y. Thermal Stresses from Large Volumetric Expansion During Freezing of Biomaterials. Journal of Biomechanical Engineering 1998a, 120, 720–726.
- Shi, X.; Datta, A.K.; Throops, J.A. Mechanical Property Changes During Freezing of a Biomaterial. Transactions of the American Society of Agricaltural Engineers 1998b, 41, 1407–1414.
- Kim, N.K.; Hung, Y.C. Freeze-Cracking in Foods as Affected by Physical Properties. Journal of Food Science 1994, 59, 669–674.
- Steffe, J.F. Rheological Methods in Food Process Engineering; Second edition, Freeman Press: East Lansing, MI, 1996; 418 pp.
- Pounder, E.R. The Physics of Ice; Pergamon Press: Oxford, England, 1965; 151 pp.
- Rabin, Y.; Steif, P.S. Thermal Sresses in a Freezing Sphere and Its Application to Cryobiology. Journal of Applied Machanics 1998, 65, 328–333..
- Pham, Q.T.; Le-Bail, A.; Hayert, M.; Tremeac, B. Stresses and Cracking in Freezing Spherical Foods: A Numerical Model. Journal of Food Engineering 2005, 71, 408–418.
- Shi, X.; Datta, A.K.; Mukherjee, S. Thermal Fracture in a Biomaterial During Rapid Freezing. Journal of Thermal Stresses 1999, 22, 275–292.
- Burubai, W.; Amula, E.; Davies, R.M.; Etekpe, G.W.W.; Daworiye, S.P. Determination of Poisson’s Ratio and Elastic Modulus of African Nutmeg (Monodora myristica). International Agrophysics 2008, 22, 99–102.
- Schwatzberg, H. Effective Heat Capacities for the Freezing and Thawing of Foods. Journal of Food Science 1976, 41, 152–156.
- Ashtiani, S.-H.M.; Salarikia, A.; Golzarian, M.R.; Emadi, B. Non-Destructive Estimation of Mechanical and Chemical Properties of Persimmons by Ultrasonic Spectroscopy. International Journal of Food Properties 2016, 16, 1522–1534.