
ABSTRACT
Glucosinolates are anti-nutritional factors present abundantly in the seed meal fraction of oilseed Brassica species. They are found in varying levels among different genotypes. Those genotypes containing less than 30 µmol/g are considered low/zero glucosinolate type and are preferred for edible purposes due to low pungency. Twenty two different genotypes were taken for the analysis of glucosinolates by spectrophotometry. A regression model was obtained using Ordinary Least Square technique which predicted a formula. Total glucosinolates (µmol/g) = 1.40 + 118.86 × A425, where A425 is the absorbance at 425 nm. The total glucosinolate content obtained by the prediction formula when compared with HPLC data showed a correlation coefficient of 0.942. This high correlation between the two data sets validated the developed methodology. This method also simplifies the estimation of total glucosinolates by excluding the use of HPLC or other sophisticated instruments.
Introduction
Plants belonging to Brassicaceae family are rich in secondary metabolites called glucosinolates. In oilseed Brassica, the de-oiled cake is a rich source of glucosinolates. Upon disruption of tissue, the glucosinolates come in contact with the myrosinase enzyme to break down into isothiocyanates producing its characteristic pungency. In order to reduce the pungency, breeding programmes worldwide are aiming to eliminate glucosinolates in oilseed Brassica. Glucosinolate diversity depends upon the R group which can be an alkyl or alkenyl side group[Citation1] (). The hydrolysis product of glucosinolates has gained much importance for industries and agricultural sectors as it can serve as antifungal and antibacterial bio fumigant for pest control.[Citation2] Also, it has anti-cancerous properties with enough evidence to substantiate its health benefits.[Citation3] Its antioxidant properties have also been well documented and can have use in food fortification.[Citation4] Apart from this, its pungency and hot flavour adds to the taste, thereby making it a favourite ingredient in cuisines from across the world as oil as well as sauce. On the other hand, its presence in seed meal is considered antinutritional for animals’ feed.[Citation5] Hence, reducing the glucosinolate content in seed meal has been a prime objective of rapeseed-mustard quality improvement programmes worldwide.
Figure 1. General structure of glucosinolates. ‘R’ represents the side chain.
Screening for low glucosinolate genotypes in mustard growing countries has been going on in conjunction with the efforts to lower erucic acid content in oil below 2% to produce ‘double low’ varieties. Therefore, development of simple and economical methods for faster screening is the need of the hour. Various screening methods have been documented and used extensively for glucosinolate estimation such as thymol method,[Citation6] Palladium method,[Citation7,Citation8] Enzymatic release of glucose,[Citation9] ELISA method,[Citation10] tes tape method,[Citation11] thiourea-UV assay.[Citation12] Trubluglu meter method,[Citation13] C-II test method,[Citation14] and HPLC[Citation15–Citation17] are non-destructive methods by using X‐ray fluorescence (X‐RF method)[Citation18] NIR[Citation19] and FT-NIR.[Citation20] In most of the spectrophotometric methods, sample preparation includes desulfation steps which require ion exchange chromatography[Citation21] and incubation steps at 80°C.[Citation10] HPLC method, which is the most accurate technique as far as estimation of individual glucosinolates is concerned,[Citation15–Citation17] is very expensive due to requirements of huge amount of solvents. In rapeseed-mustard breeding programmes, breeders often estimate total glucosinolates content in large number of genotypes from the germplasm. Considering these facts, the present investigation was planned to develop a simple and low-cost method for total glucosinolate estimation. Also, many a times, we need to estimate only total glucosinolates in place of individual glucosinolates which can be done using simple spectrophotometric method. Keeping this in mind, we have simplified the spectrophotometric method for faster and economical estimation of total glucosinolates in oilseed Brassica.
Materials and methods
Seeds of 22 genotypes of Brassica juncea (Indian Mustard) were defatted by Soxhlet apparatus using n-hexane as solvent. The defatted seed meal was dried, and total glucosinolate estimation was done as described below. The genotypes analysed are known to have a wide range of glucosinolate content. The varieties Varuna and Hyola are already known for high and low glucosinolate content, respectively (All India Coordinated research project in Rapeseed Mustard (AICRP-RM) reports 2002–2016). HPLC data were obtained as secondary data from AICRP-RM report 2016 as the analysis was done elsewhere using the same biological samples. Spectrophotometric analysis was done in our lab at ICAR-Directorate of Rapeseed-Mustard Research for the same samples/genotypes.
Estimation of total glucosinolate content by spectrophotometric method
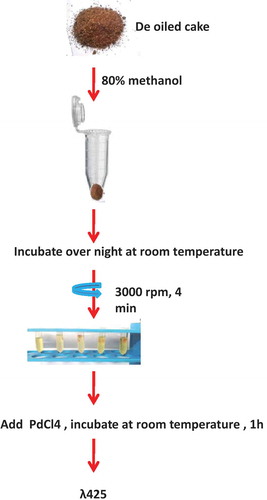
Total glucosinolate content data of 22 genotypes as estimated by HPLC method of Kraling et al.[Citation22] was obtained from AICRP-RM report (2016). Spectrophotometric estimation was done using methanolic extract prepared from the same genotypes by homogenizing 0.1 g defatted seed meal in a 2 ml vial with 80% methanol. This homogenate was centrifuged at 3000 rpm for 4 min after keeping overnight at room temperature. The supernatant was collected after centrifugation and made up to 2 ml with 80% methanol. 100 µl of this extract was used for estimation. 0.3 ml double distilled water and 3 ml of 2 mM sodium tetrachloropalladate (58.8 mg Sodium tetrachloropalladate + 170 µl concentrated HCl +100 ml double distilled water) were added to it. After incubation at room temperature for 1 h, absorbance was measured at 425 nm using a spectrophotometer (Labomed UV-VIS Double beam UVD-3500). A brief overview of the procedure is shown in . A blank was set following the same procedure without the extract. Total glucosinolates was calculated by putting the OD of each sample taken at 425 nm into the predicted formula y = 1.40 + 118.86 × A425.
Figure 2. Overview of spectrophotometric method for estimating total glucosinolate content in rapeseed-mustard seed meal.
Statistical analysis
The data obtained was analysed using Regression technique using SAS software at Indian Council of Agricultural Research-Indian Agricultural Statistics Research Institute (ICAR-IASRI), New Delhi.
Result and discussion
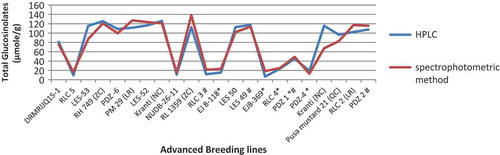
Twenty two genotypes were extracted with 80% methanol, and the absorbance was measured at 425 nm after colour development with sodium tetrachloropalladate. Total glucosinolate content estimated by Spectrophotometric method was used to compare with that obtained by HPLC method. To obtain a predicted equation, we applied the simple method of Ishida et al.[Citation24]. Regression models were generated between the absorbance obtained at 425 nm and total glucosinolate content obtained by HPLC (). A linear regression was obtained with equation Y = 1.40 + 118.86 × A425 (); where ‘Y’ is the total glucosinolate (µmol/g) and ‘X’ is the Abs425. Using the predicted formula Y = 1.40 + 118.86 × A425, 22 advanced breeding lines were evaluated. Total glucosinolate content obtained by the predicted formula was compared with the HPLC results (). A graphical representation is also shown in and .
Table 1. Comparison of total glucosinolate content obtained by HPLC and spectrophotometric method after using the predicted formula.
Figure 3. Regression models using Ordinary Least Square techniques, total glucosinolates (µmol/g) was assumed to depend on only one predictor variable A425, where A425 is the absorbance at 425 nm. It was seen that total glucosinolates (µmol/g) was statistically significantly dependent on A425. Further, the predicted value and observed value of total glucosinolates (µmol/g) was almost overlapping graphically, which validated the relationship obtained using regression analysis.
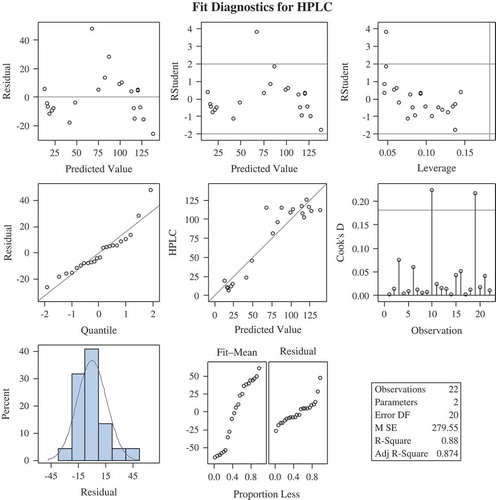
Figure 4. Regression models for prediction formula were obtained by using the HPLC data and their corresponding wet lab (spectrophotometric) data taken at absorbance 425.
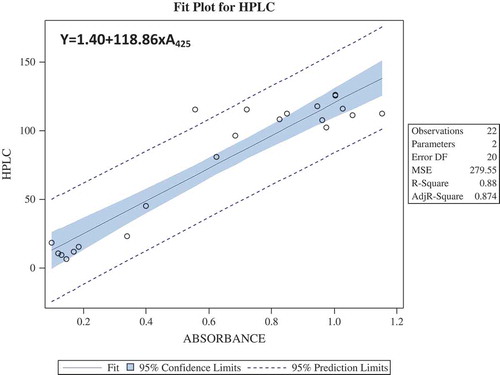
Figure 5. (a) Graphical representation of estimated total glucosinolates using HPLC and spectrophotometric method after calculating with the predicted formula y = 1.40 + 118.86 × A425. (b) Regression analysis between total glucosinolate content obtained by HPLC and spectrophotometric methods showed a strong correlation of 0.942.
In our study, it was observed that absorbance is the most crucial parameter for obtaining a realistic result because individual glucosinolates have different wavelength maxima. In previous reports, absorbance was measured at 405 nm[Citation10] and 520 nm.[Citation23] According to Thies[Citation7] sensitivity of the method was better with a decreased wavelength of 405 nm. Many of the methods were based on this wavelength maximum.[Citation8,Citation10] According to Thies[Citation7] at 405 nm only the alkenyl glucosinolates like gluconapin, glucobrassicanapin, progoitrin, and gluconapoleiferin are determined; but sodium tetrachloropalladate reacts with all glucoinolates particularly with the indolyl glucosinolates.[Citation7] This could be the reason why we could not, during this study, get values closer to the HPLC data using absorbance at 405 nm. But with 425 nm, the estimation showed better accuracy, and glucosinolate content came closer to HPLC results ( and ).
Sodium tetrachloropalladate reagent was used to develop colour as it is known to form a complex with glucosinolates causing a transitional hyperchromic shift in the visible region. Pd belonging to the group 10 of transition metals of the periodic table is known to have a strong affinity towards sulphur.[Citation7] The glucosinolates upon reaction with Sodium tetrachloropalladate reagent shifts from light brown to dark brown depending upon the presence of glucosinolate molecules. 2 mM concentration of sodium tetrachloropalladate was found to be ideal ( and ). The graphical representation () shows that the estimated total glucosinolates obtained through the predicted equation and the observed data from HPLC are at par. The line runs in similar fashion without much deviation. With this we can say that the developed methodology works satisfactorily. The predicted formula was further confirmed by analysing another set of 23 advanced breeding lines ().
Table 2. Predicted formula was further confirmed and compared with HPLC data.
As it has been reported by Thies[Citation7] that one palladium will form complex with one glucosinolate molecule, the volume of aliquot taken for estimation is an important factor to determine the success of the method. Ishida et al.[Citation24] and Kumar et al.[Citation10] took different volumes of extract for the estimation. It was found that 100 µl of concentrated methanolic extract gives readings closer to HPLC data ( and ). Also, most of the previous methods used for glucosinolate estimation required conditioning steps such as desulfation[Citation8] or heat treatments.[Citation10] It is realized that the amount of methanolic extract taken is the most important factor as in this protocol other conditioning steps were not required.
The total glucosinolate content obtained by HPLC and that obtained using the predicted equation was compared (). A linear regression Y = 1.0251x − 1.00830 was obtained with a correlation coefficient of 0.942 (). The regression models ( and ) validate this methodology as an efficient technique for estimating total glucosinolates. Further, the regression coefficient obtained using OLS is also found to be significant, which was tested using the standard errors coefficient value. Also, the residuals seem to follow random patterns, which satisfy the assumption on which regression equation is based. Further, the histogram of the residuals follows normality pattern, which also satisfies the other important assumptions of regression model. An overview of the protocol is presented in . As mentioned earlier, the extract preparation is very crucial, and therefore utmost care is needed before quantification, such as avoiding excessive shaking and vortexting of the extract. A brief centrifuge would suffice for good results.
Conclusion
The method described here utilizes the complex forming property of glucosinolates and can be used for initial screening of high and low glucosinolate rapeseed mustard lines. The formula predicted using the regression model could be used to estimate glucosinolate content as it was found to be on par with the estimation done with HPLC. Hence, this method can be used by individuals who do not have access to HPLC for estimating total glucosinolate content in rapeseed-mustard meal. Also, the faster screening of genotypes will help in breeding programmes aiming to lower glucosinolate content in oilseed Brassica.
Acknowledgement
The authors would like to thank the plant breeders for sharing seeds of genotypes used in this study. The authors have no conflict of interest.
Funding
The authors would like to thank the Indian Council of Agricultural Research for funding the work.
Additional information
Funding
References
- Fahey, J.W.; Zalcmann, A.T.; Talalay, P. The Chemical Diversity and Distribution of Glucosinolates and Isothiocyanates among Plants. Phytochemistry 2001, 56, 5–51.
- Matthiessen, J.N.; Kirkegaard, J.A. Biofumigation and Enhanced Biodegradation: Opportunity and Challenge in Soilborne Pest and Disease Management. Critical Reviews in Plant Sciences 2006, 25, 235–265.
- Higdon, J.V.; Delage, B.; Williams, D.E.; Dashwood, R.H. Cruciferous Vegetables and Human Cancer Risk: Epidemiologic Evidence and Mechanistic Basis. Pharmacological Research 2007, 55, 224–236.
- Cabello-Hurtado, F.; Gicquel, M.; Esnault, M.A. Evaluation of the Antioxidant Potential of Cauliflower (Brassica oleracea) from a Glucosinolate Content Perspective. Food Chemistry 2012, 13, 1003–1009.
- Mithen, R.F.; Dekker, M.; Verkerk, R.; Rabot, S.; Johnson, I.T. The Nutritional Significance, Biosynthesis and Bioavailability of Glucosinolates in Human Foods. Journal of the Science of Food and Agriculture 2000, 80, 967–984
- Brzezinski, W.; Mendelewski, P. Determination of Total Glucosinolate Content in Rapeseed Meal with Thymol Reagent. Zeitschrift für Pflanzenzüchtung 1984, 93, 177–183.
- Thies, W. Complex‐Formation between Glucosinolates and Tetrachloropalladate (II) and Its Utilization in Plant Breeding. Fette, Seifen, Anstrichmittel 1982, 84, 338–342.
- Møller, P.; Plöger, A.; Sørensen, H.; Sørenson, H. Quantitative Analysis of Total Glucosinolate Content in Concentrated Extracts from Double Low Rapeseed by the Pd-Glucosinolate Complex Method. Advances in the Production and Utilization of Cruciferous Crops 1985, 97–110
- VanEtten, C.H.; McGrew, C.E.; Dazenbichler, M.E. Glucosinolate Determination in Cruciferous Seeds and Meals by Measurement of Enzymically Released Glucose. Journal of Agricultural and Food Chemistry 1974, 22, 483–487.
- Kumar, S.; Yadav, S.K.; Chauhan, J.S.; Singh, A.K.; Khan, N.A.; Kumar, P.R. Total Glucosinolate Estimation by Complex Formation between Glucosinolates and Tetrachloropalladate (II) Using ELISA Reader. Journal of Food Science and Technology-Mysore 2004, 41, 63–65.
- McGregor, D.I.; Downey, R.K. A Rapid and Simple Assay for Identifying Low Glucosinolate Rapeseed. Canadian Journal of Plant Science 1975, 55, 191–196.
- Wetter, L.R.; Youngs, C.G. A Thiourea-UV Assay for Total Glucosinolate Content in Rapeseed Meals. Journal of the American Oil Chemists’ Society 1976, 53, 162–164.
- Tholen, J.T.; Buzza, G.; McGregor, D.I.; Truscoir, R.J.W. Measurement of the Glucosinolate Content in Rapeseed Using the Trubluglu Meter. Plant Breeding 1993, 110, 137–143.
- Ishida, M.; Takahata, Y.; Kaizuma, N. Simple and Rapid Method for the Selection of Individual Rapeseed Plants Low in Glucosinolates. Breeding Science 2003, 53, 291–296.
- Bjerg, B.; Sørensen, H. Quantitative Analysis of Glucosinolates in Oilseed Rape based on HPLC of Desulfoglucosinolates and HPLC of Intact Glucosinolates. In Glucosinolates in Rapeseeds: Analytical Aspects; Springer: Netherlands; 1987; 125–150.
- Björkqvist, B.; Hase, A. Separation and Determination of Intact Glucosinolates in Rapeseed by High-Performance Liquid Chromatography. Journal of Chromatography A 1988, 435, 501–507.
- Bennett, RN; Mellon FA; Kroon PA. Screening Crucifer Seeds as Sources of Specific Intact Glucosinolates Using Ion-Pair High-Performance Liquid Chromatography Negative Ion Electrospray Mass Spectrometry. Journal of Agricultural and Food Chemistry 2004, 11, 428–438.
- Schnug, E.; Haneklaus, S. Theoretical Principles for the Indirect Determination of the Total Glucosinolate Content in Rapeseed and Meal Quantifying the Sulphur Concentration via X‐Ray Fluorescence (X‐RF Method). Journal of the Science of Food and Agriculture 1988, 45, 243–254.
- Chen, J.; Li, L.; Wang, S.; Tao, X.; Wang, Y.; Sun, A.; He, H. Assessment of Glucosinolates in Chinese Kale by Near-Infrared Spectroscopy. International Journal of Food Properties 2014, 17, 1668–1679.
- Kumar, S.; Chauhan, J.S.; Kumar, A. Screening for Erucic Acid and Glucosinolate Content in Rapeseed-Mustard Seeds Using Near Infrared Reflectance Spectroscopy. Journal of Food Science and Technology 2010, 47, 690–692.
- Gallaher, C.M.; Gallaher, D.D.; Peterson, S. Development and Validation of a Spectrophotometric Method for Quantification of Total Glucosinolates in Cruciferous Vegetables. Journal of Agricultural and Food Chemistry 2012, 60, 1358–1362.
- Kräling, K.; Röbbelen, G.; Thies, W.; Herrmann, M.; Ahmadi, M.R. Variation of Seed Glucosinolates in Lines of Brassica napus. Plant Breeding 1990, 105, 33–39.
- Hu, Y.; Liang, H.; Yuan, Q.; Hong, Y. Determination of Glucosinolates in 19 Chinese Medicinal Plants with Spectrophotometry and High-Pressure Liquid Chromatography. Natural Product Research 2010, 24, 1195–1205.
- Ishida, M.; Nagata, M.; Ohara, T.; Kakizaki, T.; Hatakeyama, K.; Nishio, T. Small Variation of Glucosinolate Composition in Japanese Cultivars of Radish (Raphanus sativus L.) Requires Simple Quantitative Analysis for Breeding of Glucosinolate Component. Breeding Science 2012, 62, 63–70.