
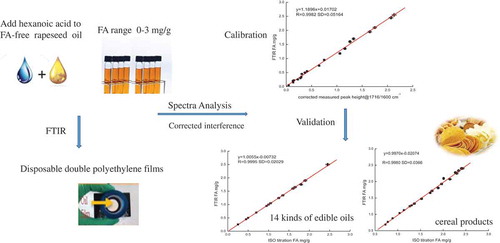
ABSTRACT
A novel method based on Fourier transform infrared spectroscopy was developed to determine fat acidity (FA) in cereal products. Disposable double polyethylene films were used as a spectral acquisition accessory. Oil was extracted from cereal products using a solvent followed by ultrasonication. The calibration curve of peak height (1716/1600 cm−1) and FA was developed by using hexanoic acid added to rapeseed oil and solvent solution. The oil-dependent absorption of the calibration at a peak of 1716/1600 cm−1 was corrected by the first overtone of ester at 3479/3518 cm−1. Subsequently, different types of blind samples were used to validate the calibration. An excellent linear relationship was determined between the FA determined using the proposed method and the ISO 7305:1998 method, with a correlation coefficient of 0.9980. Therefore, the proposed procedure can be used as an alternative to the standard method in determining the FA of cereal products.
Introduction
Cereal and its products, including noodles, flour, oatmeal, and corn grain, contain a certain amount of lipids. However, the lipids in these products are susceptible to oxidisation and decomposition because of inappropriate temperature, light, and oxygen during storage.[Citation1] In addition, the initial decomposition products may subsequently break down into acidic low-molecular-weight compounds, which reduce food nutritional value and even cause negative health effect. Fat acidity (FA) content is an important parameter of the quality of cereal products, and it is a measure of the extent to which hydrolysis has liberated fatty acid from the triglyceride esters.[Citation2] The standard method recommended by the ISO 7305:1998 involves titrating a solution with a strong base to a phenolphthalein end point. Extraction and titration procedures are simple but tedious, and they consume substantial amounts of reagents. Determination of FA value is prone to titration error in case of strongly coloured samples and requires large sample sizes and solvent volumes. Thus, several alternative techniques, including flow injection,[Citation3–Citation5] pH-metry,[Citation6] gas chromatography, and high-performance liquid chromatography,[Citation7–Citation9] have been employed in recent years to avoid these drawbacks. Most methods for lipid extraction from food are labour intensive, and large amounts of hexane are needed.[Citation10–Citation13] Hexane removal is important, but this process produces artefacts that can cause misleading analytic results.[Citation14] In addition, methods for the quantitative extraction of fat from chocolates require large amounts of solvent and time.[Citation15] Thus, microwave extraction and supercritical fluid extraction have been applied for fat extraction from foodstuffs.[Citation16] However, these methods complicate analyses. In specific, the traditional method for determining FA from milled products requires a rotary stirrer for 1 h centrifugation at 2000 × g for 5 min.
The use of Fourier transform infrared (FTIR) spectroscopy as an alternative to titrimetric methods in the quantitative determination of FA value in edible oil has been pursued extensively in the last two decades.[Citation17,Citation18] Many researchers used direct methods to determine carboxyl ν (C = O) absorption at approximately 1711 cm−1, which generally appears as a shoulder on the very strong triacylglycerol ester ν (C = O) absorption at approximately 1746 cm−1.[Citation19] Carboxyl absorption only becomes a measurable peak at high FA values. Peak overlapping, which is oil dependent, interferes with the accurate determination of FA value; therefore, either establishing a ratio of the spectra against that of an FA-free reference oil of the same oil type or developing oil-specific calibrations is necessary.[Citation20] This method overcomes oil-dependent limitations but requires many organic reagents. To avoid the time-consuming sample preparation in direct methods, spectral reconstitution was developed; in this technique, edible oils are diluted with a diluent to reduce their viscosity before their FTIR spectra are recorded, and the oil sample spectra are reconstituted using a spectral marker.[Citation19,Citation21–Citation23] A detection liquid flow cell is used in this process. However, this technique suffers from complex operation and cross-contamination issues. Subsequently, our research group used polyethylene (PE) films to analyse the FA value of edible oils through FTIR spectroscopy. The spectra of the oil films were collected and corrected by subtracting the background spectrum of the PE film.[Citation2] To the best of our knowledge, limited information is available regarding the determination of FA value in cereal products using FTIR.
The use of ultrasonic conditions for lipid extraction from hempseeds and ultrasonic extraction (UE) requires a short extraction time and thus minimises solvent consumption.[Citation24] In the present study, UE was employed to speed up the lipid extraction of cereal products. A novel method of spectral acquisition using double PE films was also developed. A general model of FA detection was established and corrected by using different contents of saponification value samples to eliminate the substrate effect. Finally, the FA values in different cereal product samples were measured, validated, and compared with those measured by the ISO method.
Materials and methods
Materials and reagents
Various edible oils and cereal products were obtained from local retail outlets at Yangling, Shaanxi, China. Among these products, refined rapeseed and coconut oils were used as the base to prepare calibration standards and calibration-corrected samples. The rapeseed and coconut oils were passed through a column of activated silica gel to remove any FA and were confirmed to be FA free by titration. Triphenylphosphine oxide (TPPO), petroleum ether, anhydrous ethanol, phenolphthalein, ether, hexanoic acid, and potassium hydroxide were purchased from Tianjin Chemical Company, Ltd. All reagents and chemicals used were of analytical grade. Transparent PE films at a thickness of ~0.025 mm were obtained from local markets.
Instrumentation
FTIR spectra were acquired with a Bruker VERTEX 70 series FTIR spectrometer equipped with a deuterated triglycine sulfate detector. The ultrasonic device used was KQ-700DE of Jiangsu Kunshan Ultrasound Instrument Co., Ltd.
Determination of physically improved conditions
UE was performed to speed up the lipid extraction from cereal products. The extraction time was 30 min, temperature was 40°C, ultrasonic power was 560 W, and material-to-liquid ratio was 1:6 (lipid in food).
Double PE film pathlength determination
A pathlength calibration was devised by recording the spectra of rapeseed oils containing 1% (w/w) TPPO in the transmission cells of known pathlength (0.015–1.00 mm) to obtain a calibration equation. The unique benzene ring in TPPO absorption peak at 542 cm−1 was the marker.
To avoid adding such a marker to every sample, we found an oil characteristic peak (4334/4300 cm−1) that is invariant from the standpoint of oxidation and is fairly constant in intensity irrespective of the type of oil being analysed. Then, the relationship between TPPO absorption peak (542/534 cm−1) and oil characteristic peak (4334/4300 cm−1) was analysed by relevant spectroscopy. Hence, the pathlength can be calibrated using the peak at 4334/4300 cm−1, and then a novel method of FTIR determination using double PE films was developed. This method can solve the practical limitations of the cumbersome operation of adding each internal standard. The effective pathlengths of solution film spectra were normalised to a fixed value of 0.25 mm. The spectrum of the solution was obtained on the basis of the background spectrum using these double PE films. This effective pathlength can be used to quantitatively compare the results obtained from different films or different sample loadings. Spectral data processing and statistical analysis were performed using TQ Analyst 7.2 (Thermo Electron Inc., Madison, WI) and OriginPro7.5 (Originlab, Northampton, MA).
Preparation of double PE film
Approximately 300 µL of solution was dripped onto the side surface of the film. The other film was attached onto it to form a closed oil film and avoid solvent volatilisation.
FA calibration
The calibration samples were mixed uniformly using a vortex. The samples were then placed in a refrigerator at 4°C for further analysis. Rapeseed oil was divided into 21 parts, and each 5 g of oil was weighed accurately on an analytical balance with four decimal points. Then, 30 mL petroleum ether was added to oil samples. Hexanoic acid was added to obtain the FA of 0–3 mg/g oil as standard samples. These samples were scanned using the double PE film procedure.
Correction for oil-dependent absorption interference
FA determination is largely based on the overlap of the ester (C = O) absorption (centred at approximately 1744 cm−1), which causes oil-dependent absorbance.[Citation21] This spectral interference deviates the analysis results and warrants correction. Different oils have different quantities of ester linkages per mole of triglyceride. Thus, the absorbance at approximately 1744 cm−1 was dependent on the nature of the oil and its saponification number (SN), that is, fatty acid chain length. These two oils were prepared as FA-free rapeseed and FA-free coconut oils to a span of coconut oil from 0% to 100% because of their different SN values. Approximately 5 g of each oil sample was weighed accurately on an analytical balance with four decimal points. The spectra of the mix oil samples were obtained by the double PE film procedure. The correct relationship was established by the absorption at 1716/1600 cm−1 and at the first overtone of ester at 3479/3518 cm−1. Thus, the interference caused by oil-dependent absorption in the FA measurement can be accounted by correlation with the first overtone of ester (C = O) at 3479/3518 cm−1 absorption.
Validation
Approximately 5 g of different edible oils, such as rapeseed, peanut, soybean, palm, flaxseed, sunflower, coconut, and corn, was weighed accurately on an analytical balance with four decimal points. Some oil samples were mixed with each other, and petroleum ether was added at a ratio of 1:6 to obtain validation samples. The spectra of the validation samples were obtained. FA was determined by using the calibration corrected by the first overtone of ester at 3479/3518 cm−1 absorbance. Meanwhile, FA results of the proposed method were compared with those of the ISO 7305:1998 method.
Blind sample validation
Twenty-one cereal products (fried instant noodles, cannabis, rice crust, and shrimp slices) were used as blind samples purchased from the local market to validate the performance of the double PE film procedure based on FTIR. Lipid extraction was used by UE. The solutions were analysed using the double PE film procedure based on FTIR and the ISO method, and the results were compared.
Results
Double PE film pathlength determination
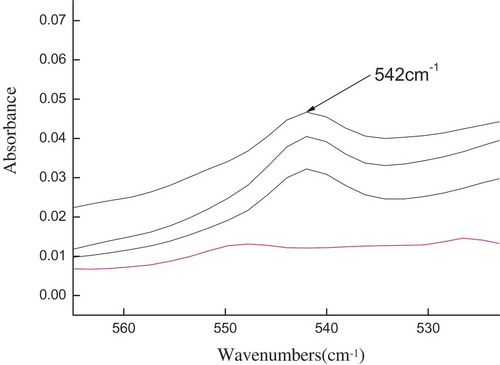
TPPO wavenumber at 542 cm−1 exhibited a strong characteristic absorption peak as TPPO content was increased (). Our research group established an equation (y = 0.089 + 2.7862x; R = 0.9975; SD = 0.0792) that relates pathlength to the peak height of the strong TPPO absorption at 542 cm−1.[Citation2] The equation indicates that the effective pathlength can be determined accurately if the sample is gravimetrically spiked with a TPPO marker.
Figure 1. Double PE film-based FTIR spectral response at 542 cm−1 obtained with different TPPO contents in oils.
shows the mixed oil sample relationship of peak height between the peaks at 542/534 and 4334/4300 cm−1. and Eq. (1) also demonstrates that the peaks at 542/534 and 4334/4300 cm−1 have acceptable correlation. This condition showed that the pathlength can be calibrated by using the peak at 4334/4300 cm−1.
Figure 2. Fitting relation curve of peak height between the peak at 542/534 and 4334/4300 cm−1.
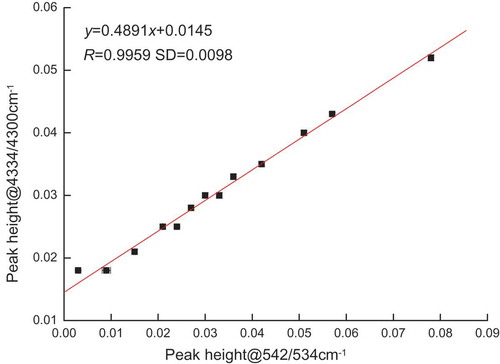
where y is the peak height at 4334/4300 cm−1 and x is the peak height at 542/534 cm−1. The pathlength calibration was devised by recording the mixture samples in the transmission cell of known pathlength (0.015–1.00 mm) to obtain a calibration equation. The necessity of using a marker can be avoided if this condition worked. Equation (2) determines the effective pathlengths of the mixture sample of the double PE films.
where y is the pathlength and x is the peak height at 4334/4300 cm−1.
Calibration
The calibration samples consisted of FA-free oil spiked with varying amounts of hexanoic acid, representing an FA range of 0–3 mg/g. The FA was plotted against its absorbance at 1716/1600 cm−1. illustrates that the peak height at 1716/1600 cm−1 and the FA shows good correlation.
Figure 3. Fitting relation curve between FA value and the peak height at 1716/1600 cm−1.
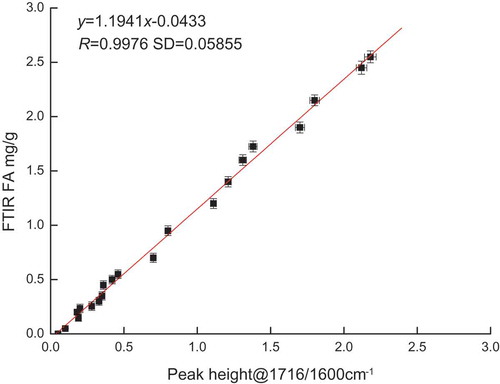
where y is the absorbance of FA and x is measured at 1716/1600 cm−1. The above relationship can predict the FA value; however, this model was only available for rapeseed oil because it had oil-dependent absorbance and needed to be further corrected.
Correction for interference from oil-dependent absorbance
FA-free rapeseed and coconut oils at SN values of 182 and 265 mg/g, respectively, were mixed at varying proportions to produce a series of samples covering a broad range of SN values. The spectra of the samples at 1716/1600 and 3479/3518 cm−1 absorbance were acquired.[Citation21] illustrates the relationship correlation. R was more than 0.99. Equation (4) is presented as follows:
Figure 4. Relationship of peak height between the peaks at 3479/3518 and 1716/1600 cm−1.
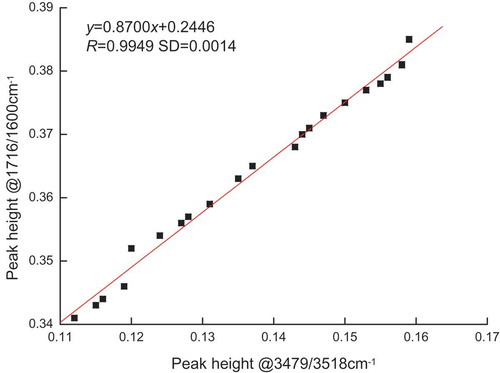
shows that the intensity of the first overtone of ester ν (C = O) absorption is directly proportional to the absorbance at the wave number typically used in FA analysis. This finding confirmed that the ester (C = O) band is the sole source of spectral interference in the FA region. The quantitative relationship [Eq. (4)] allows for the measured FA absorption in the spectrum of an oil sample to be corrected for the interference from inherent ester absorbance. However, such a correction is not valid when other factors in the oil sample perturb the absorbance due to the overtone at 3479 cm−1. Notwithstanding the limitation of this method, the resulting correlation obtained from the corrected calibration standards presented in Eq. (5) can be used to quantitate FA in all types of edible oils without loss of accuracy due to oil-dependent interference in the absorbance. This effect is only possible when the relation in Eq. (4) is applied to the calibration curve displayed in [Eq. (3)]. presents the final corrected calibration standard, which yields the following relationship:
Figure 5. Relationship between the FA value and the corrected measured peak height at 1716/1600 cm−1.
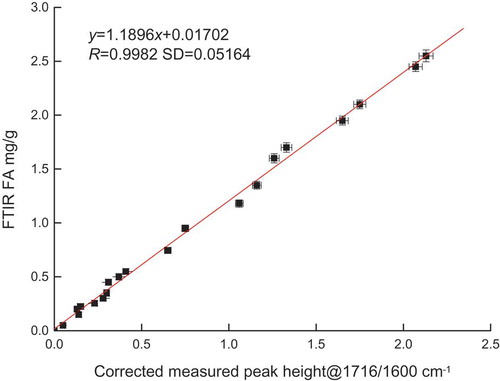
where y is the FA absorbance and x is the peak height at 1716/1600 cm−1.
Validation
Validation samples were collected by the double PE film procedure. The FA values of the validation samples were analysed using a peak absorbance at 1716/1600 cm−1 based on Eq. (5). FA was also independently determined by the ISO method. Comparison of the results obtained from the two methods showed a slope close to unity with an R value of 0.9995 (Eq. 6) as shown in the following equation:
where y is the result obtained from the double PE film procedure based on FTIR spectroscopy and x is the result obtained through the ISO titrimetric FA method. Equation (6) shows that the equation slope is close to 1 and the intercept is close to 0, indicating that the results of the two methods were very close. The measurement results of the double PE film procedure and ISO method were not significantly different. The results indicated that the FA analysis of the double PE films was not affected by the type and nature of the oil.
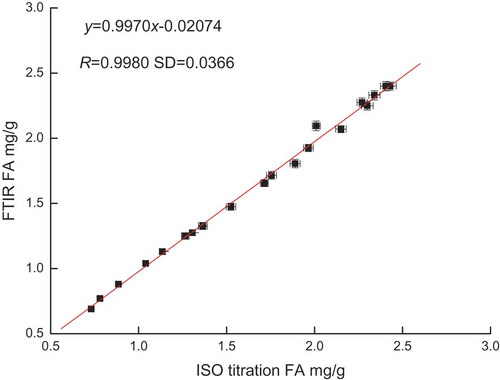
Blind sample validation
Twenty-one different cereal products were analysed using the double PE film procedure and ISO method to validate further the proposed procedure. The obtained results are presented in . further clarifies that the double PE film procedure tracked each other quite well with an R value of 0.9980 and a slope close to 1. The procedure yielded accurate and reproducible FA quantification independent of the type of oil used for analysis. Thus, this process can be used as an alternative to the ISO method.
Figure 6. Comparison and analysis of ISO values vs. FTIR values.
Measurement accuracy
The relative error of all validation samples was determined, and it ranged from 0.12% to 5.17% in the validation standards. The error was less than 6%, indicating that the procedure exhibited high accuracy. Four samples were randomly selected and measured five times in parallel, with relative standard deviation values of 1.06%, 4.04%, 1.04%, and 2.73%. These results indicated that the procedure showed high precision. The relative error ranged from 0.56% to 6.01% compared with the double PE film procedure based on FTIR spectroscopy and the ISO method in blind sample validation at the former SD of 0.0366. The R value of the double PE film procedure based on FTIR spectroscopy was more than 0.99. These results showed the high accuracy of the proposed procedure.
Discussion
The primary objective of the current study is to simplify FA analyses in cereal products by application of the double PE film procedure based on FTIR spectroscopy. Although this direct FTIR spectroscopy for FA determination is not as sensitive or accurate as some indirect FTIR spectroscopic methods (the relative error was no more than 0.04%), [Citation25,Citation26] the results from the proposed procedure are comparable with those from the ISO method in terms of accuracy and precision. The procedure for determining the FA value of cereal products was optimised, and lipid extraction was improved. Thus, the optimum conditions were obtained. The proposed procedure is faster and easier to execute compared with the conventional ISO method. Thus, this process can be an alternative method for determining the FA value of cereal products.
The proposed method used double PE films, which are transparent and cheap. The films were stretched to remove wrinkles during the procedure. The excellent linear relationship between the measured FA and those measured using the conventional ISO method at a correlation coefficient (R) of 0.9980 and SD value of 0.0366 shows a relative error of less than 6% and a relative standard deviation of less than 5%. This result indicates that this procedure has high accuracy and precision. This procedure is particularly well suited in processing control in laboratories where routine high-volume analysis of cereal products for FA value analysis is required.
Conclusion
A novel FTIR-based method using double PE films was developed to simplify FA analyses in cereal products. The model has a good correlation coefficient (R) of 0.9980 in the experiment. Results indicated that the proposed procedure can be used as an alternative to the standard method in determining the FA value of cereal products.
Additional information
Funding
References
- Kaddour, A. A.; Grand, E.; Barouh, N.; Baréa, B.; Villeneuve, P.; Cuq, B. Near-Infrared Spectroscopy for the Determination of Lipid Oxidation in Cereal Food Products. Eur. J. Lipid Sci. Technol. 2006, 108, 1037–1046. DOI: 10.1002/(ISSN)1438-9312.
- Dong, X.; Li, Q.; Sun, D.; Chen, X.; Yu, X. Direct FTIR Analysis of Free Fatty Acids in Edible Oils Using Disposable. Food Anal. Meth. 2015, 8, 857–863. DOI: 10.1007/s12161-014-9963-y.
- Nouros, P. G.; Georgiou, C. A.; Polissiou, M. G. Automated Flow Injection Spectrophotometric Non-Aqueous Titrimetric Determination of the Free Fatty Acid Content of Olive Oil. Anal. Chim. Acta. 1997, 351, 291–297. DOI: 10.1016/S0003-2670(97)00370-X.
- Takamura, K.; Fuse, T.; Arai, K.; Kusu, F. A Review of A New Voltammetric Method for Determining Acids. J. Electroanalytical Chem. 1999, 468, 53–63. DOI: 10.1016/S0022-0728(99)00049-2.
- Mariotti, E.; Mascini, M. Determination of Extra Virgin Olive Oil Acidity by FIA-titration. Food Chem. 2001, 73, 235–238. DOI: 10.1016/S0308-8146(00)00323-X.
- Yi, T.; Kuselman, I.; Shenhar, A.; Oy, B. Determination of Acid Values in Vegetable Oils without Titration. J. Am. Oil Chemists’ Soc. 1996, 73, 295–301. DOI: 10.1007/BF02523422.
- Wan, P. J.; Dowd, M. K.; Thomas, A. E.; Butler, B. H. Trimethylsilyl Derivatization/Gas Chromatography as a Method to Determine the Free Fatty Acid Content of Vegetable Oils. J. Am. Oil Chemists’ Soc. 2007, 84, 701–708. DOI: 10.1007/s11746-007-1101-1.
- Li, G.; You, J.; Suo, Y.; Song, C.; Sun, Z.; Xia, L.; Zhao, X.; Shi, J. A Developed Pre-Column Derivatization Method for the Determination of Free Fatty Acids in Edible Oils by Reversed-Phase HPLC with Fluorescence Detection and Its Application to Lycium Barbarum Seed Oil. Food Chem. 2011, 125, 1365–1372. DOI: 10.1016/j.foodchem.2010.10.007.
- Tarvainen, M.; Suomela, J. P.; Kallio, H. Ultra High Performance Liquid Chromatography-Mass Spectrometric Analysis of Oxidized Free Fatty Acids and Acylglycerols. Eur. J. Lipid Sci. Technol. 2011, 113, 409–422. DOI: 10.1002/ejlt.201000454.
- Granata, G.; Lane, R. H. Crude Oil Content of Selected Oilseeds and Flours: A Comparison of Solvents. J. Assoc. Off. Anal. Chemists. 1991, 74, 692–694.
- Di, G. L.; Solinas, M.; Miccoli, M. Polyethylene Films Effect of Extraction Systems on the Quality of Virgin Olive Oil. J. Am. Oil Chemists’ Soc. 1994, 71, 1189–1194. DOI: 10.1007/BF02540535.
- Koutsaftakis, A.; Kotsifaki, F.; Stefanoudaki, E. Effect of Extraction System, Stage of Ripeness, and Kneading Temperature on the Sterol Composition of Virgin Olive Oils. J. Am. Oil Chemists’ Soc. 1999, 76, 1477–1481. DOI: 10.1007/s11746-999-0188-y.
- Ranalli, A.; Ferrante, M. L.; De, M. G.; Costantini, N. Analytical Evaluation of Virgin Olive Oil of First and Second Extraction. J. Agric. Food Chem. 1999, 47, 417–424. DOI: 10.1021/jf9800256.
- Neff, W. E.; Fred, E.; Kathleen, W. Composition of Oils Extracted from Potato Chips by Supercritical Fluid Extraction. Eur. J. Lipid Sci. Technol. 2002, 104, 785–791. DOI: 10.1002/1438-9312(200212)104:12<785::AID-EJLT785>3.0.CO;2-3.
- Perret, D.; Gentili, A.; Marchese, S.; Sergi, M.; Caporossi, L. Determination of Free Fatty Acids in Chocolate by Liquid Chromatography with Tandem Mass Spectrometry. Rapid Commun. Mass. Spectro. 2004, 18, 1989–1994. DOI: 10.1002/(ISSN)1097-0231.
- Simoneau, C.; Naudin, C.; Hannaert, P.; Anklam, E. Comparison of Classical and Alternative Extraction Methods for the Quantitative Extraction of Fat from Plain Chocolate and the Subsequent Application to the Detection of Added Foreign Fats to Plain Chocolate Formulations. Food Res. Int. 2000, 33, 733–741. DOI: 10.1016/S0963-9969(00)00063-6.
- Bertran, E.; Blanco, M.; Coello, J.; Iturriaga, H.; Maspoch, S.; Montoliu, I. Determination of Olive Oil Free Fatty Acid by Fourier Transform Infrared Spectroscopy. J. Am. Oil Chemists’ Soc. 1999, 76, 611–616. DOI: 10.1007/s11746-999-0011-9.
- Iñón, F. A.; Garrigues, J. M.; Garrigues, S.; Molina, A.; Guardia, M. D. L. Selection of Calibration Set Samples in Determination of Olive Oil Acidity by Partial Least Squares-Attenuated Total reflectance-Fourier Transform Infrared Spectroscopy. Anal. Chim. Acta. 2003, 489, 59–75. DOI: 10.1016/S0003-2670(03)00711-6.
- Sherazi, T.; Mahesar, S. A.; Bhanger, M. I.; van de Voort, F. R.; Sedman, J. Rapid Determination of Free Fatty Acids in Poultry Feed Lipid Extracts by SB-ATR FTIR Spectroscopy. J. Agric. Food Chem. 2007, 55, 4928–4932. DOI: 10.1021/jf063554f.
- Ismail, A. A.; van de Voort, F. R.; Sedman, J. Rapid Quantitative-Determination of Free Fatty-Acids in Fats and Oils by Fourier Transform Infrared-Spectroscopy. J. Am. Oil Chemists’ Soc. 1993, 70, 335–341. DOI: 10.1007/BF02552703.
- Yu, X.; Van De Voort, F. R.; Sedman, J.; Gao, J. A New Direct Fourier Transform Infrared Analysis of Free Fatty Acids in Edible Oils Using Spectral Reconstitution. Anal. Bioanal. Chem. 2011, 401, 315–324. DOI: 10.1007/s00216-011-5036-x.
- Yu, X.; van de Voort, F. R.; Sedman, J. Determination of Peroxide Value of Edible Oils by FTIR Spectroscopy with the Use of the Spectral Reconstitution Technique. Talanta 2007, 74, 241–246. DOI: 10.1016/j.talanta.2007.06.004.
- García-González, D. L.; Sedman, J.; van de Voort, F. R. Principles, Performance, and Applications of Spectral Reconstitution (SR) in Quantitative Analysis of Oils by Fourier Transform Infrared Spectroscopy (FTIR). Appl. Spectrosc. 2013, 67, 448–456. DOI: 10.1366/12-06798.
- Lin, J.; Zeng, Q.; An, Q. I.; Zeng, Q.; Jian, L.; Zhu, Z. Ultrasonic Extraction of Hempseed Oil. J. Food Process Eng. 2012, 35, 76–90. DOI: 10.1111/jfpe.2012.35.issue-1.
- Man, Y. B. C.; Moh, M. H.; van de Voort, F. R. Determination of Free Fatty Acids in Crude Palm Oil and Refined-Bleached-Deodorized Palm Olein Using Fourier Transform Infrared Spectroscopy. J. Am. Oil Chemists’ Soc. 1999, 76, 485–490. DOI: 10.1007/s11746-999-0029-z.
- Rosenfeld, J. M.;. Application of Analytical Derivatizations to the Quantitative and Qualitative Determination of Fatty Acids. Anal. Chim. Acta. 2002, 465, 93–100. DOI: 10.1016/S0003-2670(02)00467-1.