
 ?Mathematical formulae have been encoded as MathML and are displayed in this HTML version using MathJax in order to improve their display. Uncheck the box to turn MathJax off. This feature requires Javascript. Click on a formula to zoom.
ABSTRACT
Mandarin fish that have been prepared and chilled have a shelf life of 4 days at 4°C storage, according to the total volatile basic nitrogen values. During the storage process, we observed that the texture characteristics of these fish significantly deteriorated. Certain low-abundance proteins were degraded during the shelf life, which resulted in changes in protein conformation and protein–water interaction patterns. The water-holding capacity of the fish decreased during 4°C storage; nuclear magnetic resonance analysis showed that the binding of water in fish was weakened as shelf storage prolonged and a portion of the free water was also “squeezed” to the surface of the fish in the later stages of storage. A correlation analysis showed that a decrease in the immobilized water content and mobility was associated with quality deterioration of the fish, which may be a result of increase in hydrophobic interaction and disulfide bonds in the fish during storage.
Introduction
With the acceleration of the pace of life and improvements in the quality of life during modern times, the market for chilled prepared foods is developing rapidly. In recent times, chilled prepared fish has become a popular product in supermarkets in China. However, the shelf life of chilled prepared fish during chilled storage is short due to its high water activity, neutral pH, high amino acid content, bacteria, and autolytic enzymes.[Citation1] The postmortem changes that occur in fish muscle result in a deterioration in quality of chilled prepared fish during their shelf life.[Citation2]
Generally, during the postmortem period, fish muscles are prone to becoming soft, which further affects their textural quality.[Citation3] Texture is one of the primary qualities that affect consumer acceptability. Furthermore, texture is frequently employed to examine and evaluate fish quality. During chilled storage, the texture index for fish muscle has typically shown a decreasing trend[Citation4] or increasing first and then decreasing during chilled or frozen storage at least 15 days.[Citation5] Previous research has hypothesized that the change in these indices is related to the proteolysis of myofibrillar proteins during storage. Sánchezvalencia et al.[Citation6] reported that the conformational transitions of proteins and the change in the interaction between myofibrillar proteins and water during storage influenced the textural quality of fish. Therefore, the mechanism of fish texture change should be studied primarily by examining protein degradation and the interaction between proteins and water.
In general, the shelf life of chilled prepared fish in the supermarket is up to 5 days. Li et al.[Citation7] reported that the hardness and elasticity of dark and white muscle in common carp (Cyprinus carpio) have a tendency to increase and then decrease within 72 h of chilled storage after slaughter; these findings indicate that the texture quality can deteriorate during chilled storage. Nevertheless, there has been no specific study of the change in texture quality and the mechanism of this change during the shelf life of chilled fish.
In China, the Mandarin fish (Siniperca chuatsi) is a type of freshwater fish that has a relatively high market value and is often sold chilled and prepared in supermarkets. The aim of this study is to investigate the texture quality change in Mandarin fish and the mechanism of this change during shelf life storage at 4°C.
Materials and methods
Fish samples
Live Mandarin fish (S. chuatsi) weighing 600.0 ± 50.0 g and 20.0 ± 5.0 cm in length were purchased from a local supermarket in Chongqing, China, and transported to the laboratory. The fish were killed by a blow to the head, scaled, eviscerated, and washed with running water. The treated fish were placed in a box covered by a plastic film, and the box was placed in a refrigerator at 4°C. The day of killing fish was set as first day.
Determination of total volatile basic nitrogen (TVBN)
The measurement method used to determine TVBN was similar to that described in Mousakhani-Ganjeh et al.,[Citation8] with slight modification. The TVBN content of the fish samples was determined in boric acid solution (1%, w/v) after steam distillation. Approximately 10 g of a fish sample was mixed with 90 ml of 0.6 M perchloric acid solution, homogenized for 2 min (JYL-C012 Joyoung food processer, Shandong, China) at high speed and then filtered through a filter paper. Next, 5 ml of the filtrate was loaded into a Kjeldahl-type distillation tube, followed by the addition of 5 ml of 0.75 M aqueous NaOH solution. Steam distillation was performed using a vertical steam distillation unit; the distillate was received into a beaker containing 10 ml of 30 g/L aqueous boric acid solution and phenolphthalein indicator, and incubated for 5 min. The volatile base nitrogen contained in the distillate solution was determined by titration with 0.01 M HCl and calculated with the formula
where V0 is the volume of hydrochloric acid used in the blank titration, V1 is the volume of hydrochloric acid used in the sample titration, and W is the weight of the fish sample in grams. All the analyses were performed in duplicate three times.
Textural parameters
The measurement method used to determine textural quality was similar to that described in Gao et al.,[Citation9] with slight modification. Texture measurements were determined using a TC3 Texture Analyzer (Brookfield, Massachusetts, USA). Mandarin fish (dorsal muscle) fillets were cut into small cubes (3.0 × 2.0 × 1.0 cm3) and kept on ice prior to texture analysis. Each sample was compressed using a flat-ended aluminum cylindrical plunger (50 mm diameter, type TA25) at a constant test speed of 1 mm/s until it reached 30% deformation and a trigger point of 5 g. The compressive force was perpendicular to the muscle fiber orientation. This was repeated 15 times in parallel to the muscle fiber orientation for each sample. Hardness was defined as the maximum force detected during first compression, expressed in grams. Cohesiveness was measured as the ratio of the positive force during the second compression to the positive force during the first compression.[Citation10] Gumminess was defined as the product of hardness × cohesiveness. Springiness was defined as the ratio of the time or distance from the start of the second area to the second probe reversal over the distance or the time between the start of the first area and the first probe reversal. Chewiness was defined as the product of hardness × cohesiveness × springiness.[Citation11] Cohesiveness and springiness are dimensionless.
Sodium dodecyl sulfate polyacrylamide gel electrophoresis (SDS–PAGE)
SDS–PAGE was performed according to Shi et al.[Citation12] with some modifications. Three grams of fish muscle was blended with 27 ml of dissolving solution (2% SDS, 8 mol/L urea, pH 8.8) using a JYL-C012 food processer (Joyoung, Shandong, China). The homogenates were incubated at 80°C for 1 h to allow maximal protein solubilization and extraction, and subsequently centrifuged at 3000g for 15 min, as the supernatant was kept diluted to a 0.2% protein concentration with water.[Citation13]
Treated protein samples (0.2% protein concentration) were mixed (at a 1:1 v/v ratio) with SDS–PAGE sample buffer (4% SDS, 20% glycerol, 10% b-mercaptoethanol, 0.125 M Tris, pH 6.8) and dissolved by heating in boiling water for 5 min. For SDS–PAGE, 10 μL of the sample per well was loaded onto a polyacrylamide gel made of 4% stacking gel and 10% separating gel, then subjected to electrophoresis at 15 mA until the bromophenol blue band reached the separation gel of the adhesive interface, at which point, the current was switched to 25 mA. After electrophoresis, the gels were stained using 0.05% (w/v) Coomassie Brilliant Blue G-250 in 50% (v/v) methanol and 9.2% (v/v) glacial acetic acid, then destained using 7.5% (v/v) glacial acetic acid and 5% (v/v) methanol.
Moisture content, centrifugation loss, and cooking loss (CL)
The moisture content was measured according to Marimuthu et al.[Citation14] with slight modification. Approximately 5 g of minced muscle was mixed with sand in a ceramic bowl for 4 h at 103 ± 2°C. The moisture content was recorded based on the weight differences before and after the drying of four replicates for each sample.
Centrifugation loss was measured according to the method in Etemadian et al.,[Citation15] with slight modification. Approximately 5 g of each fish sample was centrifuged at 4000g for 15 min at 4°C onto a filter paper pad placed at the bottom of the centrifugal tube. Then, the water was poured out of the centrifuge tubes and the remaining fish samples were weighed. The centrifugation loss was expressed as a percentage of weight loss of the initial sample weight.
In accordance with the method of Bouton et al.,[Citation11] 10 g of each sample was heated by water vapor for 5 min, then cooled and stored at 4°C until analysis. CL was determined with the following equation:
where m1 is the weight of the fish muscle before cooking, and m2 is the weight of the fish muscle after cooking.
Low-field nuclear magnetic resonance (LF-NMR)
Relaxation time was analyzed using low-field 1H NMR. Over 40 samples (approximately 3-cm long and 2 × 1 cm in cross-sectional area, weighing approximately 10 g) were cut along the fibers using a scalpel. Four pieces of a cooked sample were randomly selected and heated for 5 min at 100°C. Once the temperature returned to 32°C, each sample was placed in a cylindrical glass tube with the fiber direction perpendicular to the tube wall. Transverse relaxation times (T2) were measured on a Niumag Benchtop Pulsed NMR analyzer (MesoQMR23-060H; Niumag Electric Corporation, Shanghai, China) operating at 21.7673 MHz. The T2 was measured using the Carr–Purcell–Meiboom–Gill sequence with the test parameters: SFO1 (MHz) = 21.7673, P1 (us) = 10.4, P2 (us) = 21.4, SW (KHz) = 100, TW (ms) = 3000, TE (ms) = 0.3, RG1 = 20, DRG1 = 3, PRG = 1, NECH = 8000, and NS = 8.[Citation16,Citation17] The LF-NMR relaxation curve was fitted to a multi-exponential curve using Multi Exp Inv Analysis software (Niumag Electric Corporation, Shanghai, China), which uses the inverse Laplace transformation algorithm. The following parameters were presented: T21, T22, and T23 as the relaxation components; and A21, A22, and A23 as the corresponding area fractions. The relaxation time acts as an indicator for water mobility, while the area under the curve can indicate the amount of water within each component.[Citation18]
Determination of the presence of intermolecular bonds
Selective solubility of the proteins was determined as described by Dan et al.[Citation19] Chopped fish muscle (2 g) was homogenized in 10 ml of various solvents including SA (0.05 M NaCl), SB (0.6 M NaCl), SC (0.6 M NaCl + 1.5 M urea), SD (0.6 M NaCl + 8 M urea), and SE (0.6 M NaCl + 8 M urea + 2-β-mercaptoethanol), and kept at 4°C for 1 h, followed by centrifugation at 10,000g for 15 min using an Eppendorf centrifuge (5810R, Hamburg, Germany). Protein contents of the supernatants were measured by the Lowry method to determine the existence of ionic bonds (difference between protein dissolved in SB and SA), hydrogen bonds (difference between protein dissolved in SC and SB), hydrophobic interactions (difference between protein dissolved in SD and in SC), and disulfide bonds (difference between protein dissolved in SD and SE).[Citation20–Citation22] The results were expressed as grams of soluble protein per liter of homogenate.
Results and discussion
Total volatile basic nitrogen
The putrefaction of fish represents severe proteolysis in which fish are degraded by both microorganisms and autolytic enzymes.[Citation23–Citation26] TVBN represents the quantity of nonprotein nitrogen, such as nucleotides, sulfur containing amino acids, and trimethylamine oxide, converted to volatile basic nitrogenous substances such as trimethylamine, methylmercaptan, and ammonia. Therefore, the accumulation of TVBN is usually used as a reliable freshness index for fishery products.[Citation27] As expected, the TVBN of Mandarin fish increased gradually as storage time was prolonged. In , the TVBN value (mg/100 g muscle) increased from 10.47 ± 0.88 to 20.49 ± 0.55 at 4°C within 5 days of storage. According to the official standards of China (G B 2733–2015), the TVBN value of freshwater fish and shrimp during the storage should be less than or equal to 20 mg/100 g. Some articles in the literature have also reported the limit level of TVBN. Alparslan et al.[Citation28] and Arfat et al.[Citation29] found that TVBN content of 30–35 mg of N per 100 g is usually regarded as the limit of acceptability for fish. Smichi et al.[Citation30] found that the limit authorized of TVBN for human consumption is set at 30 mg N/100 g. Huang et al.[Citation31] reported that the limit of acceptability for TVBN in fresh fish is 20 mg/100 g fish muscle. In general, the TVBN limit of freshwater fish should be less than that of marine fish. Therefore, 20 mg/100 g was chosen as the limit, and within these parameters, the shelf life of Mandarin fish was 4 days at 4°C.
Figure 1. Total volatile basic nitrogen (TVBN) (mg /100 g fish muscle) of fish during cold storage at 4°C.
Texture profile analysis (TPA)
A TPA was used to measure factors such as hardness, cohesiveness, springiness, gumminess, and chewiness. These factors were the primary variables used to describe the tissue properties.[Citation15,Citation32] shows that the changing trends of all factors in raw fish fillet resembled those of cooked fish, which indicates that changes to texture characteristics in raw fish are similar in effect to those of cooked fillets.
Table 1. Texture changes in raw and cooked fish during cold storage at 4°C.
During shelf life, some indices of raw and cooked fish fillet showed decreasing trends, such as in hardness, springiness, gumminess, and chewiness. The cohesiveness of raw fish fillet did not show a significant change throughout the storage period. Conversely, the cohesiveness of cooked fish fillet increased in the first 2 days and then decreased gradually during shelf life. The results are in accordance with previous studies. Liu et al.[Citation33] found that the hardness of grass carp fillets stored at −3°C and 0°C both decreased sharply within the first 3 days. Hassoun and Karoui[Citation34] reported that the cohesiveness of whiting fillets showed no significant change at 4°C over 15 days. Gao et al.[Citation9] discovered that the average values for hardness, gumminess, chewiness, and springiness of pompano fillets displayed significant decreases throughout 15 days of storage at 4 ± 1°C. Zhao et al.[Citation35] found that the springiness of large Yellow Croaker fillets under vacuum conditions at 0°C showed a significant decreasing trend over a period of 20 days. Compared with other references in the literature, textural changes determined by mouthfeel decreased, and quality deteriorated with extended storage times.
The decrease in texture quality of fish stored at 4°C may be due to protein changes during the storage process. Ayala et al.[Citation36] found deterioration of sea bream quality during 22 days of storage at 4°C, which may have been due to the degradation of collagen and cytoskeletal proteins by the action of endogenous enzymes during storage. In addition, Ishiwatari et al.[Citation37] discovered that protein denaturation further affected the change in the state of water. In summary, the texture quality decrease may be due to the degradation of proteins by the action of endogenous enzymes and the interaction between proteins and water during storage. As a result, the acceptable storage time exceeded shelf life in the previous studies. There has not been a systematic study of the deterioration of fish quality during the early stages of storage.
Trichloroacetic acid (TCA) soluble peptide content and SDS-PAGE
The value of TCA soluble peptides during storage is illustrated in ; TCA soluble peptides gradually increased with storage time. This could be due to protein degradation by endogenous enzymes or microorganisms in the fish that produce exogenous enzymes during the storage process.[Citation38]
Figure 2. Changes in TCA-soluble peptide contents of fish during cold storage at 4°C.
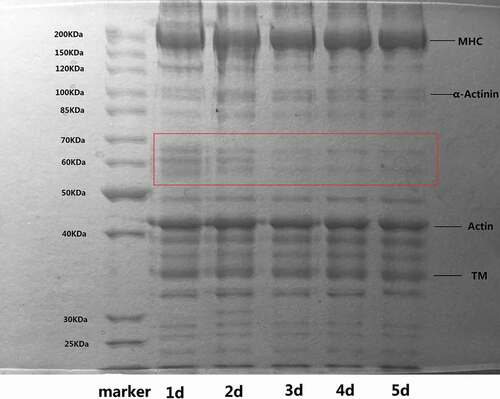
The protein changes in Mandarin fish during cold storage (4°C) are shown in . The characteristic bands for myosin heavy chain (MHC), actin, tropomyosin, and α-actinin were present in the gels. Myosin and actin are the major proteins that contribute to most of the functional properties of myofibrillar proteins.[Citation39] As shown in , there were no obvious changes in MHC and actin over the shelf life period. This result is inconsistent with previous research. Ramirez-Suarez et al.[Citation13] found that MHC decreased over the 15 days of ice storage with a concomitant appearance of a protein band at 153 kDa in jumbo squid. Yang et al.[Citation40] reported a slight decrease in MHC and actin content in salmon during 12 days of storage at 4°C. Because of the shorter storage time in our study, differences existed between these previous studies and this paper. A decrease in the intensity of the 50–80 kDa bands was discovered in the early stages of storage, which may include some effects of protein degradation. A possible reason for the above situation is a weakening of Z-disks and release of sarcomeres via the action of calpains.[Citation41] Previous studies showed that degradation of myosin and actin was primarily associated with cathepsin, but cathepsin was not activated during early storage.[Citation42] Through the weakening of Z-disks, release of costameres, breakdown of desmin and dystrophin, loss of α-actinin, and proteolysis of nebulin, titin and troponin-T, calpains play a leading role in early storage.[Citation41,Citation43] Therefore, the quality deterioration of Mandarin fish during their shelf life at 4°C is mainly due to the degradation of low-abundance proteins, including desmin, dystrophin, and α-actinin.
Figure 3. SDS-PAGE patterns of fish during cold storage at 4°C. Numbers designate the storage time (days). Marker: molecular weight marker.
Moisture content, CL and centrifugal loss
The interaction of water and protein was measured (). Fish muscle was shown to be a high-moisture-content food. The moisture content was volatile between 82.20 ± 0.44% and 83.48 ± 0.22%, which did not change regularly. CL appeared to slightly increase from 9.58 ± 2.35% to 11.83 ± 0.66%. Centrifugation loss showed a trend of significant increase from 11.41 ± 1.50% to 16.53 ± 1.11%. The trends of these three indicators illustrate that the water-holding capacity of the fish decreased. Association with changes in protein structure could explain the above trend.[Citation44,Citation45] During storage, the degradation of some low-abundance proteins can expose hydrophobic groups and alter protein conformation, which can change the pattern of protein–water interaction.[Citation46,Citation47] For validation, the effect of protein and water was further analyzed by LF-NMR.
Table 2. Moisture content, cooking loss, and centrifugal loss of fish during cold storage at 4°C.
Low-field nuclear magnetic resonance
A typical NMR T2 curve showing the T2 transverse relaxation time distribution of Mandarin fish fillets stored at 4°C is presented in . Based on previous studies,[Citation48] the first peak (P1), with a relaxation time (T21) ranging from 0.1 to 10 ms, is considered to be bound water. The second peak (P2), with a relaxation time (T22) of approximately 50 ms, is considered immobilized water. The last peak (P3), with a relaxation time (T23) ranging from 100 to 1000 ms, is free water. The relaxation time (T2) represents the mobility of water, the drop in T2 represents the decrease in the mobility of water, the peak area (A2) represents the amount of water, and the drop in A2 represents the decrease in the amount of water.[Citation49]
Figure 4. Typical NMR T2 curve of fish during cold storage at 4°C. P1, bound water; P2, immobilized water; P3, free water.
The changes in the peak area (A2) and relaxation time (T2) of raw fish during storage is shown in . In the first 3 days of storage, the A21 decreased, indicating that the amount of bound water decreased. The A22 increased slightly during the first 2 days and significantly decreased on the third day, which directly indicated that the content of immobilized water also increased slightly and then decreased significantly. The A23 showed a trend of increase in the first 3 days, which indicated that the volume of free water increased in the first 3 days. Combined with the above observations, a conclusion could be drawn that the state of water changed in the first 3 days of shelf life. A portion of the bound water was transformed into immobilized water, and some of the immobilized water was transformed into free water, which brought about the increase in the amount of free water. In the fourth day, the content of bound water had almost no change. Conversely, both the immobilized water and the free water decreased significantly. According to the results from the total peak area, the total amount of water decreased as the shelf life was extended. These conclusions are not consistent with previous results (). As protein conformation changes during storage, a portion of the free water undetected by NMR can be “squeezed” to the surface of fish.[Citation48] However, this would have been measurable via the drying method. Therefore, the content of free water decreased even though some immobilized water was converted to free water in the fourth day. In the fifth day, the three types of water did not change significantly (p < 0.05), which indicates that the state of water was unchanged.
Figure 5. The changes in A2(a) and T2(b) of fish during cold storage at 4°C.
The changing tendencies in the mobility of water are shown in . T21 had no significant change over the course of storage. The T22 values indicate that the mobility of immobilized water increased in the first day and then decreased. As usual, the higher the water content, the stronger the water mobility.[Citation50,Citation51] The trend in the immobilized water mobility and content was consistent with previous reports. However, the mobility and content of free water showed a different trend; T23 decreased significantly during the first 3 days and then had no change during additional days of storage. Because part of the immobilized water transferred to free water and a portion of the free water with higher mobility was “squeezed” out to the surface of the fish, the mobility of free water was decreased, even though its content increased over the first 3 days; additionally, free water mobility did not decrease along with its content over the last 2 days.
The Pearson product-moment correlation coefficient (PPMCC) has been widely used to measure the degree of correlation between two variables.[Citation52,Citation53] The PPMCC of NMR and texture (hardness, springiness, cohesiveness, gumminess, and chewiness) is shown in . The immobilized water was strongly related to the texture index. This meant that the decrease in the immobilized water volume and mobility was associated with the quality deterioration of fish during shelf life. The immobilized water was also the most abundant part of the water content in fish muscle. Thus, the change in the immobilized water was dependent on the change in the pattern of protein–water interaction. According to earlier studies, the pattern of protein–water interaction was related to intermolecular bonds in protein.[Citation54,Citation55] As a result, the diversification of intermolecular bonds was further analyzed to clarify the reasons for the change in the immobilized water.
Table 3. PPMCCs of NMR (A21, A22, A23, T21, T22, T23) and texture (hardness, springiness, cohesiveness, gumminess, and chewiness).
Intermolecular bonds
The changes in intermolecular bonds as storage proceeds are shown in . Ionic bonds did not obviously change, while the primary changes were in the hydrogen bonds, hydrophobic interactions, and disulfide bonds. Hydrophobic interaction increased rapidly, and the strength of hydrogen bonds was decreased. The reason for this phenomenon may be due to protein conformation changes during storage, leading to the exposure of hydrophobic groups.[Citation21,Citation56] Disulfide bonds in the storage process showed an upward trend, which was likely due to oxidation of sulfhydryl groups to disulfide bonds.[Citation57,Citation58]
Figure 6. Intermolecular bonds changes of fish during cold storage at 4°C.
Combined with the LF-NMR data, the PPMCCs of the immobilized water and intermolecular bonds (hydrophobic interactions and disulfide bonds) are illustrated in . The change in the immobilized water could primarily be related to hydrophobic interaction and disulfide bonds. Hydrophobic interaction and disulfide bonds both revealed increasing trends, which suggest that the protein network was growing larger and closer. On the second day, new protein networks had formed, leading to a peak in the water volume and the relaxation time of immobilized water. With the enhancement of hydrophobic interactions and disulfide bonds, the protein network became tighter. A portion of the immobilized water was “squeezed,” causing the water volume and the relaxation time of the immobilized water to drop during the later stage.
Table 4. PPMCCs of immobilized water and intermolecular bonds (hydrophobic interactions and disulfide bonds).
Conclusions
According to the TVBN value of chilled prepared Mandarin fish during 4°C storage, the shelf life was determined to be 4 days. The texture quality of raw and cooked fish fillet showed deterioration tendency over prolonged shelf storage times. The TCA soluble peptide content analysis showed the protein in fish degrades gradually as the storage time increased. SDS–PAGE showed that there were no obvious changes in MHC and actin, and some low-abundance proteins were degraded during storage. Loss of fish during cooking and centrifugation showed an increasing trend, which indicated that the water-holding capacity of the fish decreased as the storage time increased. NMR analysis showed that the binding of water in fish was weakened as shelf storage prolonged and some of the free water was also “squeezed” to the surface of the fish in the later stages of storage, which also indicated that the water-holding capacity of the fish had decreased. The mobility of the immobilized water largely showed a decreasing trend, during storage due to its transformation into free water. Correlation analysis showed that the immobilized water was strongly related to the texture index, which implied that the decrease in the immobilized water content and mobility is associated with the quality deterioration of fish during shelf life. Analysis of intermolecular bonds within the fish showed that the increase in hydrophobic interactions and disulfide bonds resulted in the decrease in the immobilized water content and mobility during storage.
Considering these results, we conclude that the degradation of low-abundance proteins can alter protein conformation in fish during storage throughout its shelf life and that the increase in hydrophobic interactions and disulfide bonds can decrease both the immobilized water content and mobility, which results in the deterioration of fish texture quality.
Additional information
Funding
References
- Jeyasekaran, G.; Ganesan, P.; Anandaraj, R.; Shakila, R. J. Effect of Pre-Chilling on the Shelf-Life and Quality of Silver Pomfret (Pampus argenteus) Stored in Dry Ice and Wet Ice. Am. J. Food Technol.. 2006, 1.
- Ocano-Higuera, V. M.; Maeda-Martinez, A. N.; Marquez-Rios, E.; Canizales-Rodriguez, D. F.; Castillo-Yanez, F. J.; Ruiz-Bustos, E.; Graciano-Verdugo, A. Z.; Plascencia-Jatomea, M. Freshness Assessment of Ray Fish Stored in Ice by Biochemical, Chemical and Physical Methods. Food Chem. 2011, 125, 49–54. DOI: 10.1016/j.foodchem.2010.08.034.
- Cheng, J.-H.; Sun, D.-W.; Han, Z.; Zeng, X.-A. Texture and Structure Measurements and Analyses for Evaluation of Fish and Fillet Freshness Quality: A Review. Compr. Rev. Food Sci. Food Saf. 2014, 13, 52–61. DOI: 10.1111/crf3.2014.13.issue-1.
- Yu, D.; Xu, Y.; Jiang, Q.; Yang, F.; Xia, W. Freshness Assessment of Grass Carp (Ctenopharyngodon idellus) Fillets during Storage at 4°C by Physicochemical, Microbiological and Sensorial Evaluations. J Food Saf. 2017, 37, e12305. DOI: 10.1111/jfs.2017.37.issue-2.
- Li,; Luo,; Shen. Postmortem Changes of Crucian Carp (Carassius auratus) during Storage in Ice. Int. J. Food Properties. 2015, 18, 205–212. DOI: 10.1080/10942912.2011.614986.
- Sánchezvalencia, J.; Sánchezalonso, I.; Martinez, I.; Careche, M. Estimation of Frozen Storage Time or Temperature by Kinetic Modeling of the Kramer Shear Resistance and Water Holding Capacity (WHC) of Hake (Merluccius merluccius, L.) Muscle. J. Food Eng. 2014, 120, 37–43. DOI: 10.1016/j.jfoodeng.2013.07.012.
- Li, Q.; Zhang, L.; Lu, H.; Song, S.; Luo, Y. Comparison of Postmortem Changes in ATP-related Compounds, Protein Degradation and Endogenous Enzyme Activity of White Muscle and Dark Muscle from Common Carp (Cyprinus Carpio) Stored at 4°C. LWT Food Sci. Technol. 2017, 78, 317–324. DOI: 10.1016/j.lwt.2016.12.035.
- Mousakhani-Ganjeh, A.; Hamdami, N.; Soltanizadeh, N. Impact of High Voltage Electric Field Thawing on the Quality of Frozen Tuna Fish (Thunnus albacares). J. Food Eng. 2015, 156, 39–44. DOI: 10.1016/j.jfoodeng.2015.02.004.
- Gao, M.; Feng, L.; Jiang, T.; Zhu, J.; Fu, L.; Yuan, D.; Li, J. The Use of Rosemary Extract in Combination with Nisin to Extend the Shelf Life of Pompano (Trachinotus ovatus) Fillet during Chilled Storage. Food Control. 2014, 37, 1–8. DOI: 10.1016/j.foodcont.2013.09.010.
- Lerfall, J.; Roth, B.; Skare, E. F.; Henriksen, A.; Betten, T.; Dziatkowiak-Stefaniak, M. A.; Rotabakk, B. T. Pre-Mortem Stress and the Subsequent Effect on Flesh Quality of Pre-Rigor Filleted Atlantic Salmon (Salmo salar L.) During Ice Storage. Food Chem. 2015, 175, 157–165. DOI: 10.1016/j.foodchem.2014.11.111.
- Bouton, P. E.; Harris, P. V.; Shorthose, W. R. The Effects of Ultimate pH on Ovine Muscle: Water Holding Capacity. J. Food Sci. 2010, 37, 351–355. DOI: 10.1111/j.1365-2621.1972.tb02635.x.
- Shi, Y.; Li, R.-Y.; Tu, Z.-C.; Ma, D.; Wang, H.; Huang, X.-Q.; He, N. Effect of γ-irradiation on the Physicochemical Properties and Structure of Fish Myofibrillar Proteins. Radiat. Phys. Chem. 2015, 109, 70–72. DOI: 10.1016/j.radphyschem.2014.12.016.
- Ramirez-Suarez, J. C.; Ibarra-León, L. R.; Pacheco-Aguilar, R.; Lugo-Sánchez, M. E.; García-Sánchez, G.; Carvallo-Ruiz, G. Physicochemical and Functional Changes in Jumbo Squid (Dosidicus gigas) Mantle Muscle during Ice Storage. Food Chem. 2008, 111, 586–591. DOI: 10.1016/j.foodchem.2008.04.024.
- Marimuthu, K.; Geraldine, A. D.; Kathiresan, S.; Xavier, R.; Arockiaraj, J.; Sreeramanan, S. Effect of Three Different Cooking Methods on Proximate and Mineral Composition of Asian Sea Bass (Lates calcarifer, Bloch). J. Aquatic Food Prod. Technol. 2014, 23, 468–474. DOI: 10.1080/10498850.2012.727133.
- Etemadian, Y.; Shabanpour, B.; Sadeghi Mahoonak, A. R.; Shabani, A.; Alami, M. Cryoprotective Effects of Polyphosphates on Rutilus frisii Kutum Fillets during Ice Storage. Food Chem. 2012, 129, 1544–1551. DOI: 10.1016/j.foodchem.2011.06.005.
- Carr, H. Y.; Purcell, E. M. Effects of Diffusion on Free Precession in Nuclear Magnetic Resonance Experiments. Phys. Rev. 1954, 94, 630–638. DOI: 10.1103/PhysRev.94.630.
- Meiboom, S.; Gill, D. Modified Spin‐Echo Method for Measuring Nuclear Relaxation Times. Rev. Sci. Inst. 1958, 29, 688–691. DOI: 10.1063/1.1716296.
- Andersen, R. H.; Andersen, H. J.; Bertram, H. C. Curing-Induced Water Mobility and Distribution within Intra- and Extra-Myofibrillar Spaces of Three Pork Qualities. Int. J. Food Sci. Technol. 2007, 42, 1059–1066. DOI: 10.1111/ifs.2007.42.issue-9.
- Dan, J.; Huang, Q.; Xiong, S. Chemical Interactions and Gel Properties of Black Carp Actomyosin Affected by MTGase and Their Relationships. Food Chem. 2016, 196, 1180. DOI: 10.1016/j.foodchem.2015.10.030.
- Ni, N.; Wang, Z.; He, F.; Wang, L.; Pan, H.; Li, X.; Wang, Q.; Zhang, D. Gel Properties and Molecular Forces of Lamb Myofibrillar Protein during Heat Induction at Different pH Values. Process. Biochem. 2014, 49, 631–636. DOI: 10.1016/j.procbio.2014.01.017.
- Xu, Y. S.; Xia, W. S.; Yang, F.; Nie, X. H. Protein Molecular Interactions Involved in the Gel Network Formation of Fermented Silver Carp Mince Inoculated with Pediococcus pentosaceus. Food Chem. 2010, 120, 717–723. DOI: 10.1016/j.foodchem.2009.10.068.
- Zhang, L.; Yong, X.; Jie, X.; Li, Z.; Xue, C. Effects of High-Temperature Treatment (≥100°C) on Alaska Pollock (Theragra chalcogramma) Surimi Gels. J. Food Eng. 2013, 115, 115–120. DOI: 10.1016/j.jfoodeng.2012.10.006.
- Castro, P.; Padrón, J. C. P.; Ma, J. C. C.; Velázquez, E. S.; Larriva, R. M. D. Total Volatile Base Nitrogen and Its Use to Assess Freshness in European Sea Bass Stored in Ice. Food Control. 2006, 17, 245–248. DOI: 10.1016/j.foodcont.2004.10.015.
- Dondero, M.; Cisternas, F.; Carvajal, L.; Simpson, R. Changes in Quality of Vacuum-Packed Cold-Smoked Salmon (Salmo salar) as a Function of Storage Temperature. Food Chem. 2004, 87, 543–550. DOI: 10.1016/j.foodchem.2004.01.005.
- Kyrana, V. R.; Lougovois, V. P. Sensory, Chemical and Microbiological Assessment of Farm-Raised European Sea Bass (Dicentrarchus labrax) Stored in Melting Ice. Int. J. Food Sci. Technol. 2002, 37, 319–328. DOI: 10.1046/j.1365-2621.2002.00572.x.
- Lougovois, V. P.; Kyranas, E. R.; Kyrana, V. R. Comparison of Selected Methods of Assessing Freshness Quality and Remaining Storage Life of Iced Gilthead Sea Bream (Sparus aurata). Food Res. Int. 2003, 36, 551–560. DOI: 10.1016/S0963-9969(02)00220-X.
- Chang, H.; Rx, W. Textural and Biochemical Properties of Cobia (Rachycentron canadum) Sashimi Tenderised with the Ultrasonic Water Bath. Food Chem. 2012, 132, 1340–1345. DOI: 10.1016/j.foodchem.2011.11.116.
- Alparslan, Y.; Baygar, T.; Baygar, T.; Hasanhocaoglu, H.; Metin, C.; Alparslan, Y.; Baygar, T.; Baygar, T.; Hasanhocaoglu, H. Effects of Gelatin-Based Edible Films Enriched with Laurel Essential Oil on the Quality of Rainbow Trout (Oncorhynchus mykiss) Fillets during Refrigerated Storage. Food Technol. Biotechnol. 2014, 52, 325–333.
- Arfat, Y. A.; Benjakul, S.; Vongkamjan, K.; Sumpavapol, P.; Yarnpakdee, S. Shelf-Life Extension of Refrigerated Sea Bass Slices Wrapped with Fish Protein Isolate/Fish Skin gelatin-ZnO Nanocomposite Film Incorporated with Basil Leaf Essential Oil. J. Food Sci. Technol. 2015, 52, 6182–6193. DOI: 10.1007/s13197-014-1706-y.
- Smichi, N.; Abdelmalek, B. E.; Kharrat, N.; Sila, A.; Bougatef, A.; Gargouri, Y.; Fendri, A. The Effects of Storage on Quality and Nutritional Aspects of Farmed and Wild Sea Bass (Dicentrachus labrax) Muscle: In Vitro Oils Digestibility Evaluation. Fish. Res. 2017, 188, 74–83. DOI: 10.1016/j.fishres.2016.12.003.
- Huang, X.; Lv, R.; Yao, L.; Guan, C.; Han, F.; Teye, E. Non-Destructive Evaluation of Total Volatile Basic Nitrogen (TVB-N) and K-Values in Fish Using Colorimetric Sensor Array. Anal. Methods. 2014, 7, 1615–1621. DOI: 10.1039/C4AY02623C.
- Casas, C.; Martinez, O.; Guillen, M. D.; Pin, C.; Salmeron, J. Textural Properties of Raw Atlantic Salmon (Salmo salar) at Three Points along the Fillet, Determined by Different Methods. Food Control. 2006, 17, 511–515. DOI: 10.1016/j.foodcont.2005.02.013.
- Liu, D.; Liang, L.; Xia, W.; Regenstein, J. M.; Zhou, P. Biochemical and Physical Changes of Grass Carp (Ctenopharyngodon idella) Fillets Stored at −3 and 0°C. Food Chem. 2013, 140, 105–114. DOI: 10.1016/j.foodchem.2013.02.034.
- Hassoun, A.; Karoui, R. Monitoring Changes in Whiting (Merlangius merlangus) Fillets Stored under Modified Atmosphere Packaging by Front Face Fluorescence Spectroscopy and Instrumental Techniques. Food Chem. 2016, 200, 343–353. DOI: 10.1016/j.foodchem.2016.01.028.
- Zhao, J.; Li, J.; Wang, J.; Lv, W. Applying Different Methods to Evaluate the Freshness of Large Yellow Croacker (Pseudosciaena crocea) Fillets during Chilled Storage. J. Agric. Food Chem. 2012, 60, 11387–11394. DOI: 10.1021/jf303439p.
- Ayala, M. D.; Abdel, I.; Santaella, M.; Martínez, C.; Periago, M. J.; Gil, F.; Blanco, A.; Albors, O. L. Muscle Tissue Structural Changes and Texture Development in Sea Bream, Sparus aurata L., During Post-Mortem Storage. LWT Food Sci. Technol. 2010, 43, 465–475. DOI: 10.1016/j.lwt.2009.08.023.
- Ishiwatari, N.; Fukuoka, M.; Sakai, N. Effect of Protein Denaturation Degree on Texture and Water State of Cooked Meat. J Food Eng. 2013, 117, 361–369. DOI: 10.1016/j.jfoodeng.2013.03.013.
- Pacheco-Aguilar, R.; Lugo-Sánchez, M. E.; Robles-Burgueño, M. R. Postmortem Biochemical and Functional Characteristic of Monterey Sardine Muscle Stored at 0°C. J. Food Sci. 2010, 65, 40–47. DOI: 10.1111/j.1365-2621.2000.tb15953.x.
- Mohan, M.; Ramachandran, D.; Sankar, T. V.; Anandan, R. Physicochemical Characterization of Muscle Proteins from Different Regions of Mackerel (Rastrelliger kanagurta). Food Chem. 2008, 106, 451–457. DOI: 10.1016/j.foodchem.2007.05.024.
- Yang, Z.; Wang, H.; Wang, W.; Qi, W.; Yue, L.; Ye, Q. Effect of 10 MeV E-Beam Irradiation Combined with Vacuum-Packaging on the Shelf Life of Atlantic Salmon Fillets during Storage at 4°C. Food Chem. 2014, 145, 535–541. DOI: 10.1016/j.foodchem.2013.08.095.
- Ahmed, Z.; Donkor, O.; Street, W. A.; Vasiljevic, T. Calpains- and Cathepsins-Induced Myofibrillar Changes in Post-Mortem Fish: Impact on Structural Softening and Release of Bioactive Peptides. Trends Food Sci. Technol. 2015, 45, 130–146. DOI: 10.1016/j.tifs.2015.04.002.
- Delbarre-Ladrat, C.; Verrez-Bagnis, V.; Noël, J.; Fleurence, J. Relative Contribution of Calpain and Cathepsins to Protein Degradation in Muscle of Sea Bass (Dicentrarchus labrax L.). Food Chem. 2004, 88, 389–395. DOI: 10.1016/j.foodchem.2004.01.053.
- Delbarreladrat, C.; Chéret, R.; Taylor, R.; Verrezbagnis, V. Trends in Postmortem Aging in Fish: Understanding of Proteolysis and Disorganization of the Myofibrillar Structure. Crit Rev Food Sci Nutr. 2006, 46, 409–421. DOI: 10.1080/10408390591000929.
- Kristensen, L.; Purslow, P. P. The Effect of Ageing on the Water-Holding Capacity of Pork: Role of Cytoskeletal Proteins. Meat Sci. 2001, 58, 17–23. DOI: 10.1016/S0309-1740(00)00125-X.
- M, Å.; Ofstad, R.; Böcker, U.; Jessen, F.; Einen, O.; Mørkøre, T. Effect of Sodium Bicarbonate and Varying Concentrations of Sodium Chloride in Brine on the Liquid Retention of Fish (Pollachius virens L.) Muscle. J. Sci. Food Agric. 2015, 96, 1252–1259.
- Riebroy, S.; Benjakul, S.; Visessanguan, W.; Erikson, U.; Rustad, T. Acid-Induced Gelation of Natural Actomyosin from Atlantic Cod (Gadus morhua) and Burbot (Lota Lota). Food Hydrocoll. 2009, 23, 26–39. DOI: 10.1016/j.foodhyd.2007.11.010.
- Yuan, C.; Kleinhammes, A.; Yue, W. Protein Dynamics and Thermodynamics Crossover at 10°C: Different Roles of Hydration at Hydrophilic and Hydrophobic Groups. Chem. Phys. Lett. 2016, 664, 108–113. DOI: 10.1016/j.cplett.2016.10.024.
- Sánchezalonso, I.; Moreno, P.; Careche, M. Low Field Nuclear Magnetic Resonance (LF-NMR) Relaxometry in Hake (Merluccius merluccius, L.) Muscle after Different Freezing and Storage Conditions. Food Chem. 2014, 153, 250–257. DOI: 10.1016/j.foodchem.2013.12.060.
- Bertram, H. C.; Stagsted, J.; Young, J. F.; Andersen, H. J. Elucidation of Membrane Destabilization in Post-Mortem Muscles Using an Extracellular Paramagnetic Agent (Gd-Dtpa): An NMR Study. J. Agric. Food Chem. 2004, 52, 6320–6325. DOI: 10.1021/jf049452b.
- Li, C.; Liu, D.; Zhou, G.; Xu, X.; Qi, J.; Shi, P.; Xia, T. Meat Quality and Cooking Attributes of Thawed Pork with Different Low Field NMR T 21. Meat Sci. 2012, 92, 79–83. DOI: 10.1016/j.meatsci.2011.11.015.
- Sánchez-Alonso, I.; Martinez, I.; Sánchez-Valencia, J.; Careche, M. Estimation of Freezing Storage Time and Quality Changes in Hake (Merluccius merluccius, L.) By Low Field NMR. Food Chem. 2012, 135, 1626–1634. DOI: 10.1016/j.foodchem.2012.06.038.
- Xu, W.; Ma, R.; Zhou, Y.; Peng, S.; Hou, Y. Asymptotic Properties of Pearson’s Rank-Variate Correlation Coefficient in Bivariate Normal Model. Signal Processing. 2016, 119, 190–202. DOI: 10.1016/j.sigpro.2015.08.010.
- Mukaka, M. M.;. Statistics Corner: A Guide to Appropriate Use of Correlation Coefficient in Medical Research. Malawi Med. J. J. Med. Assoc. Malawi. 2012, 24, 69.
- Mcdonnell, C. K.; Allen, P.; Morin, C.; Lyng, J. G. The Effect of Ultrasonic Salting on Protein and Water-Protein Interactions in Meat. Food Chem. 2014, 147, 245–251. DOI: 10.1016/j.foodchem.2013.09.125.
- Sánchez-Valencia, J.; Sánchez-Alonso, I.; Martinez, I.; Careche, M. Low-Field Nuclear Magnetic Resonance of Proton (1 H LF NMR) Relaxometry for Monitoring the Time and Temperature History of Frozen Hake (Merluccius merluccius L.) Muscle. Food Bioprocess Technol. 2015, 8, 1–9. DOI: 10.1007/s11947-015-1569-x.
- Hamaguchi, P. Y.; Weng, W.; Tanaka, M. Effect of pH on the Formation of Edible Films Made from the Muscle Proteins of Blue Marlin (Makaira mazara). Food Chem. 2007, 100, 914–920. DOI: 10.1016/j.foodchem.2005.10.045.
- Benjakul, S.; Visessanguan, W. C.; Tanaka, M. Comparative Study on Physicochemical Changes of Muscle Proteins from Some Tropical Fish during Frozen Storage. Food Res. Int. 2003, 36, 787–795. DOI: 10.1016/S0963-9969(03)00073-5.
- Nguyen, M. V.; Thorarinsdottir, K. A.; Gudmundsdottir, A.; Thorkelsson, G.; Arason, S. The Effects of Salt Concentration on Conformational Changes in Cod (Gadus morhua) Proteins during Brine Salting. Food Chem. 2011, 125, 1013–1019. DOI: 10.1016/j.foodchem.2010.09.109.