
 ?Mathematical formulae have been encoded as MathML and are displayed in this HTML version using MathJax in order to improve their display. Uncheck the box to turn MathJax off. This feature requires Javascript. Click on a formula to zoom.
ABSTRACT
Due to its health benefits, resistant starch (RS) has received increasing attention from the public, and there is a need to develop methods to measure the amylose and RS concentration in pea (Pisum sativum L.) flour. The aim of this study was to develop a visible and near-infrared reflectance (vis–NIR) model for the simultaneous determination of amylose, RS, and digestible starch (DS) in pea flour. A total of 123 dry pea samples consisting of different pea varieties grown in different environments were collected, and ground to flour, and then the vis–NIR spectra were scanned. The amylose, RS, and DS contents of the pea flours were also measured by an enzymatic colorimetric assay. The spectra data were calibrated with the enzymatic colorimetric-assayed values. Results showed that amylose, RS, and DS in the pea flours can be simultaneously estimated using the vis–NIR spectra. Instead of using the full spectrum (300–2300 nm), we found the most efficient wave bands lying in the visible region between 370 and 560 nm and the NIR spectra in the range of 1600–1800 nm. Using the stepwise regression with backward elimination method, the multiple linear regression (MLR) models were developed from the most efficient wavelengths. The MLR models had the determination coefficients R2 of 0.95, 0.76, 0.80, and 0.88 for amylose, RS, DS, and total starch, respectively. The correlation coefficients between model estimated and the enzymatic colorimetric assayed values were 0.97, 0.80, 0.85, and 0.93 for amylose, RS, DS, and total starch, respectively.
Introduction
Pea (Pisum sativum) is one of the major legumes in the world used for food and feedstuff. In the Northern Great Plains (NGP) of the United States, pea production has increased rapidly during the last decade; Montana alone planted 247,000 ha of pea in 2016.[Citation1] A great portion of the dry peas produced in the NGP is exported to Asian countries to be fractionated into protein, starch, and fiber. With 46% starch, 20% (W/W) protein, and 20% fiber contents,[Citation2] dry pea is not considered a major starch source compared to rice (Oryza sativa L.), wheat (Triticum aestivum L.), corn (Zea mays L), and potato (Solanum tuberosum L.). Nevertheless, pea starch is widely processed into noodles in food industries,[Citation3] and pea starch is considered the second best material (after mung bean) among all grain legumes for processing starch noodles.[Citation4]
Pea starch, like starch from other crops, consists of amylose and amylopectin. Based on its digestibility, pea starch can be classified into digestible starch (DS) and resistant starch (RS). RS is the starch that is resistant to digestion in the small intestine,[Citation5] and it can be fermented in the colon and large intestine to produce short-chain fatty acids,[Citation6–Citation9] which may lead to various health benefits such as improving the insulin response, increasing satiety,[Citation10–Citation12] and reducing the risk for colon cancer, obesity, diabetes, and inflammatory bowel disease.[Citation13–Citation17]
Research has shown that higher amylose content is correlated with elevated levels of RS; higher levels of RS contents were found in maize and barley that had higher amylose contents.[Citation18–Citation20] High amylose, or RS, can result in reduced digestibility and low glucose release,[Citation21] which contributes to low glycemic indices. The content of amylose or RS in the grains depends on the growth conditions and timing of harvest of the crops, and it varies considerably between plant species and varieties. Variable RS contents have been reported among different genotypes of rice and wheat.[Citation22,Citation23] Strydhorst et al.[Citation24] found winter pea (cv. Windham) had lower total starch content but higher RS and protein content than spring pea cultivars. Wrinkled peas have a very high amylose content of 63–70% compared to around 31% in the normal pea varieties.[Citation25,Citation26] Tao et al.[Citation27] analyzed nine common pea varieties grown in different environments in Montana and found RS contents varied from 0.5% to 5.3% and RS content is influenced by both genetics and growing environment.
Because of the benefits of RS to human health, there has been an increasing interest in knowing the content of amylose or RS in our daily diets. Grain industries are also interested in segregating commodities with different amylose and RS contents for different food processing purposes. Various methods have been developed for the determination of amylose or RS contents in grain,[Citation28–Citation32] but those laboratory methods are complicated, requiring sample preparation and chemical manipulations making them laborious, costly, and time consuming. There is a need to develop a quick measuring method to screen amylose and RS in grains and flours.
The visible and near-infrared reflectance spectroscopy (vis–NIRS) technique may provide an alternative rapid, nondestructive, and cost-effective method for starch measurement. Several researchers have developed NIRS methods to determine amylose and total starch in wheat, rice, and bean,[Citation33–Citation36] but we have not found NIRS or vis–NIRs models being developed to determine amylose and RS in peas. Furthermore, it is not clear if a model can be developed to determine amylose, RS, and DS simultaneously. The objective of this study was to explore the potential of using the NIRS models to predict the contents of starch composition in pea flours.
Materials and methods
Materials
A total of 123 pea seed samples consisting of different varieties grown in different environments were collected from Montana. These were expected to have a wide range of total and RS, as well as amylose contents. Pea seeds were ground into flour by passing through a 1-mm mesh screen using an Udy Cyclone Sample Mill (Udy Corporation, Fort Collins, Co).
Enzymatic colorimetric assay
Petroleum ether was used to remove fatty acids from pea flours. After removing the fatty acids, amylose was determined according to the colorimetric method of Williams et al.[Citation37] using potato amylose as a standard. RS and DS were analyzed using the Megazyme resistant kit using glucose solution (1.0 mg/ml) as a standard. Total starch was calculated as the sum of RS and DS. Each sample of pea flours was analyzed in triplicates.
Vis–NIR measurement
The vis and NIR reflectance of the pea flours were measured with a miniature fiber-optic spectrometer (StellarNet Inc., USA), which measures spectral reflectance between the wavelength of 200 and 1080 nm in the BLACK-Comet Series (C-SR), and between 900 and 2300 nm in the RED-Wave NIR InGaAs Series. A RS50 white reflectance standard was used to optimize the instrument prior to taking the reflectance measurements. Samples were scanned over the spectra range of 300–900 and 900–2300 nm separately. After the scanning, the two wavelength ranges of spectra for each sample were combined into one spectrum ().
Figure 1. Visible and near infrared reflectance spectra from scanning pea flour samples by using a miniature fiber optic spectrometer (StellarNet Inc., USA). The X-axis is wavelength (nm) and Y-axis is the reflectance (%).

Data analysis
To enhance signal-to-noise ratio and to reduce baseline and background shifts, the spectral data were preprocessed with the Unscrambler 9.7 software (CAMO Software AS, Oslo, Norway) using different mathematical transformation methods, including vector normalization, multiplicative scattering correction (MSC), Savitzky–Golay first derivative (S.G. 1st derivative), and standard normal variate (SNV).
After preprocessing the data, the partial least squares (PLS) regression was used to get the fundamental relation between the spectral data and the enzymatic colorimetric assayed values of the starch components. The accuracy of the estimation models was tested by leave-one-out cross validation. The coefficient of determination (RCitation2) and the root mean square error (RMSE) were calculated and used as the criteria for the goodness of fit of the models. A good PLS model should have a high value of RCitation2 and a low value of RMSE.[Citation38] Based on these criteria, the PLS models that used different data preprocessing methods were compared.
Since the PLS model with the full spectrum (300–2300 nm) is difficult to use, we tried to build a multiple linear regression (MLR) model with reduced most effective wavelengths. First, the data set was divided into calibration and validation subsets. To ensure that the selected data points for the calibration and validation subsets can cover the whole data range, cluster analysis was employed to explore the data distribution using the SPSS 19.0 (IBM, USA) software.[Citation39,Citation40] The dendrite form cluster graphs were plotted from all data points, and then the calibration and validation subsets data were randomly selected from each cluster at a proportion of 3:2. Finally, a total of 86 samples were selected for the calibration subset and 37 samples for the validation subset.
A correlation analysis was conducted between the enzymatic colorimetric assayed values of starch components (i.e., amylose, RS, DS, and total starch) and the spectral values at each wavelength in the range of 300–2300 nm at 1.0 nm intervals. Based on the values of the correlation coefficient, the highly correlated wavebands were determined and selected. After selection of the highly correlated wavebands, MLR models were built for amylose, RS, DS, and total starch. A stepwise regression with backward elimination procedure was employed using the SPSS 19.0 software (IBM Corp., Armonk, NY) and only the most correlated wavelengths were retained in the MLR models. Coefficients of determination (R2) were used to estimate the amount of explained variance in each model and to provide a measure of goodness of fit. The accuracy of each calibration model was subsequently validated using the validation subset of data, based on the correlation coefficient of the model estimated values versus laboratory measured values.
Results and discussion
Statistical description of the data sets for amylose, RS, DS, and total starch
The range, mean, standard deviation, and coefficient of variation (CV) of the data sets are presented in for amylose, RS, DS, and total starch. The contents of amylose and RS displayed large variations in concentrations with CV of 51.94% and 50.03%, respectively. The total starch and DS data sets showed smaller variations (CV = 19.55% and 20.14%, respectively). According to Brunet et al.,[Citation41] an accurate model calibration could be achieved if a data set covered a wide range. The data range for the pea starch components in this study was considered suitable for developing the spectral calibrations, and more accurate estimation models will be expected to be developed for amylose and total starch due to the wider data ranges.
Table 1. Descriptive statistics of the data sets for amylose, resistant starch, digestible starch, and total starch determined by enzymatic colorimetric assay.
Comparison of spectral data preprocessing procedures
presents the PLS regression models for estimation of amylose and RS. Comparing the model built on the unprocessed spectral data, the models built on the data that were preprocessed by normalization, MSC, SNV, and S.G. 1st derivative showed different degrees of reduced RMSE and improved R2. We found that the S.G. 1st derivative procedure is the suitable procedure for both amylose and RS spectral data. This is based on the RMSEP, , RMSECV,
calculated for each model. The best data preprocessing procedure must result in the smallest root mean square error of cross validation (RMSECV), the smallest root mean square error of prediction (RMSEP), and the highest coefficient of determination (
and
). Although the SNV procedure resulted in the lowest RMSEP and RMSECV, and the highest
and
for the amylose, this procedure did not result in significant reduction in RMSEP and RMSECV or improvement in
and
for the RS (). The S.G. 1st derivative procedure had a better estimation of both amylose and RS. Therefore, this method was selected to preprocess the spectral data in this study.
Table 2. Comparison of the PLS models using different data preprocessing procedures.
Determination of efficient wavebands and construction of MLR models
Since there are many redundant wavebands when modeling with the whole spectrum (300–2300 nm with 1 nm intervals),[Citation42] we conducted the correlation analyses to determine the highly correlated wavebands. displays the highly correlated wavebands and the values of their correlation coefficients for amylose, RS, DS, and total starch.
Table 3. Highly correlated wavebands and corresponding correlation coefficients (in parentheses) for estimating amylose, resistant starch, digestible starch, and total starch.
Results in indicated that all the starch components had strong correlations with some visible spectral wavebands (r2 > 0.5) and were negatively correlated with certain NIR spectra wavebands. The strong correlations with visible spectral wavebands in this study were likely due to the color of pea flours. In this study, the pea samples had color variations.
Amylose appeared to have the highest coefficient of correlation (r2 up to 0.91) with the selected wavebands, followed by total starch (r2 up to 0.816). The efficient wavebands for amylose and RS lay in the spectra regions of 384–534, 1066–1093, 1243–1426, and 1600–1654 nm, while the efficient wavebands for total starch were 390–540, 1348–1420, 1618–1641, and 1762–1837 nm. The highly correlated wavebands for DS were similar to that for total starch.
After determination of the efficient wavebands, a stepwise MLR with the backward elimination method was employed to build the linear regression models for amylose, RS, DS, and total starch (). Results in indicated that all models were well fitted, which explained 95.2%, 75.6%, 80.3%, and 88.1% of the variations in the calibration data sets for amylose, RS, DS, and total starch, respectively, with the corresponding adjusted R2 of 0.952, 0.756, 0.803, and 0.881. Compared to the full PLS models that used the whole spectrum (300–2300 nm), the numbers of wavelengths in the reduced MLR models were between 8 and 13, and only the most significant wavebands were used ().
Table 4. The multiple linear regression models (MLR) and adjusted coefficients of determination (adj. R2) for amylose, resistant starch, digestible starch, and total starch estimation using the most significant vis–NIRS wavebands.
Validation of MLR regression models
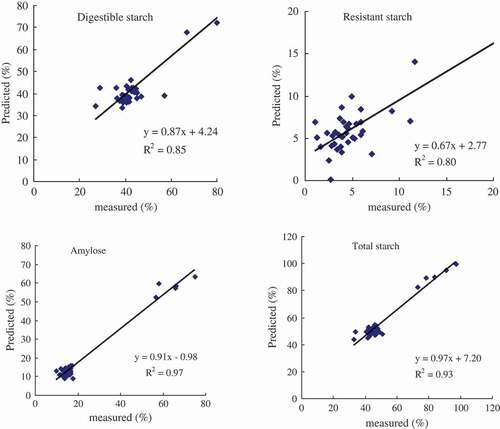
To validate the estimation ability of the MLR models built with the most significant wavelengths, we input the reflectance values in the validation data set (n = 37) to estimate the concentration of amylose, RS, DS, and total starch. Then, the model estimated values were compared with the actual measured values. Scatter plots and the correlation coefficient R2 values between the estimated and actual measured are shown in . All MLR models performed very well in estimating starch components; the R2 values were ranged from 0.80 to 0.97, indicating a very good fit. Vis–NIR spectra models performed the best in estimating amylose and total starch (R2 = 0.97 and 0.93, respectively) followed by RS and DS (R2 = 0.80 and 0.85, respectively).
Figure 2. Comparison of the laboratory-measured resistant starch, digestible starch, amylose, and total starch with the vis–NIRS model estimated values.
Correlations among amylose, RS, DS, and total starch
Results from the correlation analyses showed strong correlations (P < 0.001) among the starch components (), except for DS and RS. Amylose was significantly correlated with total starch, RS, and DS (P < 0.001). The correlations between pea amylose and RS in this study were in agreement with the previous studies on maize.[Citation20] No significant correlations between the resistant and DS in this study were likely due to the small percentage of the RS (0.9–11.7%) compared to the DS (25–86%). The total starch had more influence in the DS than the RS, because the variations of the RS were relatively small ().
Table 5. Correlation matrix among resistant starch, digestible starch, amylose, and total starch determined by chemical methods.
Conclusion
This study demonstrates that the vis–NIR reflectance spectroscopy technology can be used to estimate the starch components in dry pea flours. We successfully developed MLR models to simultaneously estimate amylose, RS, DS, and total starch. The MLR models used 8–13 most correlated wavelengths that are simple and easy to use compared to the PLS regression models that used the full spectra (300–2300 nm). The MLR models had coefficients of determination R2 from 0.76 to 0.95 and showed good correlations between the model estimated and laboratory measured values, with the correlation coefficients from 0.80 to 0.97.
Additional information
Funding
References
- USDA-NASS, Dry edible pea planted acres in Montana. (2016). https://quickstats.nass.usda.gov/results/41E673DB-6C0D-3D39-A47D-1651538F5531
- Tzitzikas, E. N.; Vincken, J. P.; DeGroot, J. Genetic Variation in Pea Seed Globulin Composition. Journal of Agricultural and Food Chemistry 2006, 54, 425–433. DOI: 10.1021/jf0519008.
- Ratnayake, W. S.; Hoover, R.; Warkentin, T. Pea Starch: Composition, Structure and Properties—A Review. Starch–Starke 2002, 54, 217–234. DOI: 10.1002/1521-379X(200206)54:6<217::AID-STAR217>3.0.CO;2-R.
- Tan, H. Z.; Li, Z. G.; Tan, B. Starch Noodles: History, Classification, Materials, Processing, Structure, Nutrition, Quality Evaluating and Improving. Food Research International 2009, 42, 551–576. DOI: 10.1016/j.foodres.2009.02.015.
- Rahman, S.; Bird, A.; Regina, A.; Li, Z.; Philippe Ral, J.; McMaugh, S.; Topping, D.; Morell, M. Resistant Starch in Cereals: Exploiting Genetic Engineering and Genetic Variation. Journal of Cereal Science 2007, 46, 251–260. DOI: 10.1016/j.jcs.2007.05.001.
- Berry, C. S.;. Resistant Starch: Formation and Measurement of Starch that Survives Exhaustive Digestion with Amylolytic Enzymes during Determination of Dietary Fiber. Journal of Cereal Science 1986, 4, 301–314. DOI: 10.1016/S0733-5210(86)80034-0.
- Baghurst, P. A.; Baghurst, K. I.; Record, S. J. Dietary Fiber, Non-Starch Polysaccharides and Resistant Starch: A Review. Food Australia 1996, 48, 3–35.
- Premavalli, K. S.; Roopa, S.; Bawa, A. S. Resistant Starch – A Functional Dietary Fibre. Indian Food Industry 2006, 25, 40–45.
- Sharma, A.; Yadav, B. S.; Ritika, B. Y. Resistant Starch: Physiological Roles and Food Applications. Food Review International 2008, 24, 193–234. DOI: 10.1080/87559120801926237.
- Robertson, M. D.; Bickerton, A. S.; Dennis, A. L.; Vidal, H.; Frayn, K. N. Insulin Sensitizing Effects of Dietary Resistant Starch and Effects on Skeletal Muscle and Adipose Tissue Metabolism. American Journal Clinical Nutrition 2005, 82, 559–567. DOI: 10.1093/ajcn/82.3.559.
- Willis, H. J.; Eldridge, A. L.; Beiseigel, J.; Thomas, W.; Slavin, L. Greater Satiety Response with Resistant Starch and Corn Bran in Human Subjects. Nutrition Research 2009, 29, 100–105. DOI: 10.1016/j.nutres.2009.01.004.
- Johnston, K.; Thomas, E.; Bell, J.; Frost, G.; Robertson, M. Resistant Starch Improves Insulin Sensitivity in Metabolic Syndrome. Diabetic Medicine 2010, 27, 391–397. DOI: 10.1111/dme.2010.27.issue-4.
- Higgins, J. A.;. Resistant Starch: Metabolic Effects and Potential Health Benefits. Journal AOAC International 2004, 87, 761–768.
- Wong, J. M. W.; De Souza, R.; Kendall, C. W. C.; Emam, A.; Jenkins, D. J. A. Colonic Health: Fermentation and Short Chain Fatty Acids. Journal of Clinical Gastroenterology 2006, 40, 235–243. DOI: 10.1097/00004836-200603000-00015.
- Bird, A. R.; Vuaran, M. S.; King, R. A.; Noakes, M.; Keogh, J.; Morell, M. K.; Topping, D. L. Whole Grain Foods Made from a Novel High-Amylose Barley Variety (Himalaya 292) Improve Indices of Bowel Health in Human Subjects. British Journal of Nutrition 2008, 99, 1032–1040. DOI: 10.1017/S000711450783902X.
- Flegal, K. M.; Carroll, M. D.; Ogden, C. L.; Curtin, L. R. Prevalence Trends in Obesity among US Adults, 1999–2008. The Journal of American Medicine Association 2010, 303, 235–241. DOI: 10.1001/jama.2009.2014.
- Hendrich, S.;. Battling Obesity with Resistant Starch. Food Technology 2010, 64, 22–30.
- Horchers, R.;. A Note on the Digestibility of the Starch of High-Amylose Corn by Rats. Cereal Chemistry 1962, 39, 145–146.
- Sievert, D.; Pomeranz, Y.; Enzyme-Resistant Starch, I. Characterization and Evaluation by Enzymatic, Thermoanalytical, and Microscopic Methods. Cereal Chemistry 1989, 66, 342–347.
- Evans, A.; Thompson, D. B. Resistance to Alpha-Amylase Digestion in Four Native High-Amylose Maize Starches. Cereal Chemistry 2004, 81, 31–37. DOI: 10.1094/CCHEM.2004.81.1.31.
- Lehmann, U.; Robin, F. Slowly Digestible Starch-Its Structure and Health Implications: A Review. Trends in Food Science and Technology 2007, 18, 346–355. DOI: 10.1016/j.tifs.2007.02.009.
- Chiu, Y. T.; Stewart, M. L. Effect of Cultivar and Cooking Method on Resistant Starch Content of White Rice and Subsequent Postprandial Glucose Response and Appetite in Humans. Asia Pacific Journal of Clinical Nutrition 2012, 22, 372–379.
- Hazard, B.; Zhang, X.; Colasuonno, P.; Uauy, C.; Beckles, D. M.; Dubcovsky, J. Induced Mutations in the Genes Increase Amylose and Resistant Starch Content in Durum Wheat. Crop Science 2012, 52, 1754–1766.
- Strydhorst, S.; Olson, M.; Vasanthan, T.; McPhee, K. E.; McKenzie, R. H., . B.; Henriquez, B.; Tieulie, J.; Middleton, A.; Dunn, R.; Pfiffner, P.; et al. Adpatability and Quality of Winter Pea and Lentil in Alberta. Agronomy Journal 2015, 107, 2431–2448. DOI: 10.2134/agronj15-0092.
- Banks, W.; Greenwood, C. T.; Muir, D. D. Studies on the Biosynthesis of Starch Granules. Part 9. The Starch Granules from Wrinkled-Seeded Peas. Starke 1974, 26, 46–50. DOI: 10.1002/star.19740260204.
- Rosin, P. M.; Lajolo, F. M.; Menezes, E. W. Measurement and Characterization of Dietary Starches. Journal of Food Composition and Analysis 2002, 15, 367–377. DOI: 10.1006/jfca.2002.1084.
- A F, T.; Keshavarz Afshar, R.; Huang, J.; Mohammed, Y. A.; Chen, C. Variation in Yield, Starch, and Protein of Dry Peas Grown across Montana. Agronomy Journal 2017, 109, 1491–1501. DOI: 10.2134/agronj2016.07.0401.
- Englyst, H. N.; Kingman, S. M.; Cummings, J. H. Classification and Measurement of Nutritionally Important Starch Fractions. European Journal of Clinical Nutrition 1992, 46, 33–50.
- Goni, L.; Garcia-Dia Manas, E.; Saura-Calixto, F. Analysis of Resistant Starch: A Method for Foods and Food Products. Food Chemistry 1996, 56, 455–459. DOI: 10.1016/0308-8146(95)00222-7.
- Mahmood, T.; Turner, M. A.; Stoddard, F. L. Comparison of Methods for Colorimetric Amylose Determination in Cereal Grains. Starch-Strake 2007, 59, 357–365. DOI: 10.1002/star.200700612.
- Fitzgerald, M. A.; Bergman, C. J.; Resurreccion, A. P.; Möller, J.; Jimenez, R.; Reinke, R. F.; Martin, M.; Blanco, P.; Molina, F.; Chen, M. H.; et al. Addressing the Dilemmas of Measuring Amylose in Rice. Cereal Chemistry 2009, 86, 492–498. DOI: 10.1094/CCHEM-86-5-0492.
- Chiaramonte, E.; Rhazi, L.; Aussenac, T.; White, R. D. Amylose and Amylopectin in Starch by Asymmetric Flow Field-Flow Fractionation with Multi-Angle Light Scattering and Refractive Index Detection (AF4–MALS–RI). Journal of Cereal Science 2012, 56, 457–463. DOI: 10.1016/j.jcs.2012.04.006.
- Hong, J. H.; Ikeda, K.; Kref, I.; Yasumoto, K. Near-Infrared Diffuse Reflectance Spectroscopic Analysis of the Amounts of Moisture, Protein, Starch, Amylose, and Tannin in Buckwheat Flours. Journal of Nutrition Science Vitaminology 1996, 42, 359–366. DOI: 10.3177/jnsv.42.359.
- Bao, J.; Wang, Y.; Shen, Y. Determination of Apparent Amylose Content, Pasting Properties and Gel Texture of Rice Starch by Near‐Infrared Spectroscopy. Journal of Science Food and Agriculture 2007, 87, 2040–2048. DOI: 10.1002/jsfa.2960.
- Owens, B.; McCann, M. E.; McCracken, K. J.; Park, R. S. Prediction of Wheat Chemical and Physical Characteristics and Nutritive Value by Near-Infrared Reflectance Spectroscopy. British Poultry Science 2009, 50, 103–122. DOI: 10.1080/00071660802635347.
- Wang, J.; Liu, H.; Ren, G. Near-Infrared Spectroscopy (NIRS) Evaluation and Regional Analysis of Chinese Faba Bean (Vicia Faba L.). The Crop Journal 2014, 2, 28–37. DOI: 10.1016/j.cj.2013.10.001.
- Williams, P. C.; Kuzina, F. D.; Hlynka, I. A Rapid Colorimetric Procedure for Estimating the Amylose Content of Starches and Flours. Cereal Chemistry 1970, 47, 411–420.
- Bala, M.; Singh, M. Non-Destructive Estimation of Total Phenol and Crude Fiber Content in Intact Seeds of Rapeseed-Mustard Using FTNIR. Industrial Crop Productivity 2013, 42, 357–362. DOI: 10.1016/j.indcrop.2012.06.014.
- Dunbar, J. B., Jr.;. Cluster-Based Selection, Perspect. Drug Discovery and Design 1997, 7, 851.
- Brown, R. D.; Martin, Y. C. Use of Structure–Activity Data to Compare Structure-Based Clustering Methods and Descriptors for Use in Compound Selection. Journal of Chemical Information and Computer Sciences 1996, 36, 572–584. DOI: 10.1021/ci9501047.
- Brunet, D.; Barthes, B. G.; Chotte, J. L.; Feller, C. Determination of Carbon and Nitrogen Contents in Alfisols, Oxisols and Ultisols from Africa and Brazil Using NIRS Analysis: Effects of Sample Grinding and Set Heterogeneity. Geoderma 2007, 139, 106–117. DOI: 10.1016/j.geoderma.2007.01.007.
- Kawamura, K.; Watanabe, N.; Sakanoue, S.; Inoue, Y. Estimating Forage Biomass and Quality in a Mixed Sown Pasture Based on Partial Least Squares Regression with Waveband Selection. Grassland Science 2008, 54, 131–145. DOI: 10.1111/grs.2008.54.issue-3.