
 ?Mathematical formulae have been encoded as MathML and are displayed in this HTML version using MathJax in order to improve their display. Uncheck the box to turn MathJax off. This feature requires Javascript. Click on a formula to zoom.
ABSTRACT
Cow ghee is very used in some regions of Iran, such as Kermanshah province. Cow ghee is a natural source that contains high-quality nutrients which are needed for the human body. Adulteration in dairy products is not only a serious threat to human health but also it causes economic losses. Diagnosis of foodstuff cheating and its estimation is one of the key concerns in recent years. The aim of this study was the detection of the adulteration in cow ghee by olfactory machine system. Therefore, an electronic nose system was used for the different levels of sunflower oil and cow body fat mixed with pure cow ghee (10%, 20%, 30%, 40%, and 50%). The principal components analysis (PCA) and artificial neural networks (ANNs) methods were used to achieve this goal. Based on the results, the accuracy of the principal components analysis of sunflower oil and cow body fat were 96% and 97% of the data variance, respectively. According to the results, artificial neural networks identified the adulteration with sunflower oil and cow body fat with an accuracy of 91.3% and 82.5%, respectively.
Introduction
Cow ghee or clarified butter is very used in some regions of Iran, such as Kermanshah province.[Citation1] Cow ghee is prepared by both traditional and industrial methods. In Iran, the traditional method is more common in villages. In the traditional way, firstly milk is converted to yogurt. Butter and yogurt drink are produced from the yogurt. After separating the butter from the yogurt drink, it is processed to produce ghee.[Citation2] Ghee is an effective material enhancing memory power, grasping power, and power to control senses and to make these stronger.[Citation3–Citation5] However, because of the shortage of ghee, and comparatively more demand, it is very expensive (costing 7 to 10 times more than edible vegetable oils). Therefore, ghee is prone to adulteration by the traders in the market. The commonly used adulterants are vegetable oils, animal body fats, mineral oils, starchy material, and so on.[Citation3]
Adulteration is defined as the process by which the quality or the nature of a given substance is reduced through the addition of a foreign or an inferior substance and the removal of vital elements.[Citation6] The adulteration is a very serious problem. In recent years, more attention is being paid for developing biological olfactory machines which use biosensors for detection and discrimination of specific odorants.[Citation7] Utilizing sensitive elements, biosensors are able to detect odorants as well as providing a new platform to investigate the performance of the olfactory system. Excellent properties of smell and taste receptors are generally recognized in the development of biomimetic smell receptors-based biosensors.[Citation7–Citation9]
Electronic noses (e-noses) are instruments, which mimic the sense of smell. These devices are typically used an array of sensors to detect and distinguish odors precisely in complex samples and at low cost.[Citation10] These features make e-noses very useful for diverse applications in the food, cosmetic and pharmaceutical industry as well as in environmental control or clinical diagnostics.[Citation11] In the recent years, different research have been done about using of e-nose in the field of food control such as meat[Citation12,Citation13], fish[Citation14], milk[Citation15], oils[Citation16,Citation17], Saffron[Citation18,Citation19], Chinese pecan[Citation20], honey[Citation21], rapeseed[Citation22] and orange juice[Citation23] and soil.[Citation24]
Several methods have been developed for the detection of the adulteration in cow ghee. These methods were mostly based on chemical parameters like the fatty acid composition and the physicochemical analysis.[Citation3] According to a survey of the literature, a special machine or system for the detection of pure cow ghee has never been studied. So, in this research, an electronic nose system was considered for detecting pure cow ghee from the adulterated samples. To achieve this goal, an olfactory machine was evaluated by different samples of pure and faked samples (including sunflower oil and cow body fat).
Materials and methods
All experiments were done in the department of mechanical engineering of Biosystems, Razi University, Kermanshah, Iran.
Structure of the e-nose
In order to detect the amount of adulteration in cow ghee, an olfactory machine was used (). This system mainly includes sampling unit, detection unit, and a control unit. The sampling unit includes a cylindrical container with a capacity of 100 g, a mass flow controller, three two-way valves, a micro-vacuum pump, and power supply. The detection unit includes a sensor array, air pump, air filter, and a data acquisition card (DAC, USB), which is used to convert odor information to electrical signal. The control unit consists of a computer equipped with software that was designed specifically for the e-nose system in Lab VIEW 2012 environment.
Figure 1. The used e-nose system.
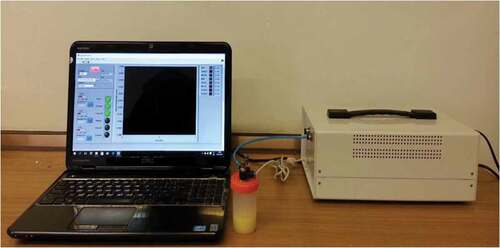
The system is equipped with a 12-V micro-vacuum pump to transfer the sample smell (headspace) to the sensor chamber. In the present research, the sensor array was composed of eight different gas sensors. MOS gas sensors, as a typical commercial sensor, are extensively used in e-nose.[Citation25] These sensors are widely used in olfactory machines due to their high chemical stability, long life, low response to moisture, and reasonable prices. These eight sensors are circulated on an electronic screen. By entering the gas around the sample into the sensor chamber, the change in the output voltage of each sensor is proportional to the type of sensor and its sensitivity. Specification of the selected gas sensors has been listed in . The odor stimulus patterns from known odors are then utilized to generate a database that is subjected to multivariate analysis so that unknown odors can, therefore, be identified and classified.[Citation26,Citation27]
Table 1. The used sensors in electronic nose.
Preparation of adulterated ghee samples
In this study, the quality of the used pure cow ghee samples was guaranteed since they were obtained directly from the producers. Sunflower oil and fat (from cow body) were used as a common cheating in cow ghee. For the preparation of adulterated ghee samples, sunflower oil and cow body fat were heated to 40–50°C for 10 min before mixing. To prepare specimens with various adulteration levels, cow ghee was mixed with sunflower oil and cow body fat to prepare five concentration levels in proportions of 10%, 20%, 30%, 40%, and 50% (w/w). Also, 15 replications were considered for each adulteration level.
The tests were done after filling the cylindrical container by an oil sample and tying the container cap. The interval time between each of the two tests was about 30 min for mixing the air inside the compartment with the volatiles from the sample and filling the space above the sample. In each test, the electronic nose dealt with baseline correction, injecting the sample smell and clearing the sensors chamber. After filling the sample container, in the baseline correction step (200 s) the clean air was passed through sensors to reach the steady state. At the injection stage (180 s), the sample smell as a gas is entered in the sensor chamber and causes to change the output voltage of each sensor that is proportional to the type of sample, sensor and its sensitivity. At the stage of clearing the sensors and the container, clean air was entered into the sensor chamber to reach the steady state. At this stage, the pump also removed the odor remaining inside the sample container. This stage also lasted for 120 s. Sensor voltage response was collected in 500 s by the data acquisition system.
Data analysis
The signals obtained from the sensors were first recorded as raw data. In the next step, sensor signals were pre-processed consisted of three stages of baseline correction, compression, and normalization of data. The purpose of the correction of the baseline is to compensate the drift and increase the quality of the response of the sensors. In this study, the deficit method was used to correct the baseline by Equation 1. This method is widely used in semiconducting metal oxide sensors[Citation18,Citation28]:
where Xs(0) is the sensor response before the test, XS(t) is the sensor response at time t and Ys(t) is the normalized response of the sensor.
In this research, data were analyzed using principal component analysis (PCA) and artificial neural networks (ANN) methods. PCA is a projection method that allows an easy visualization of all the information contained in a data set.[Citation28] This method helps to understand how a sample varies from other samples (score plot) and which variables mostly contribute the distinction (loading plot).[Citation29]
Artificial neural networks (ANN) can be defined as a set of very simple calculation units (nodes) that start out from a data set and transform it into a set of response values. An ANN is a technique with great potential for the treatment of the signals generated by electronic noses based on sensors that afford non-linear responses. For classification purposes, the network builds a model based on a set of input objects (the training set) with known outputs, adjusting the weights associated with each connection so that output values as similar as possible to the real values are generated.[Citation28] Pre-processed data were used as input matrix to the analytical method. All calculations and analysis were performed using the Unscrambler x10.4 and MATLAB R2013a software.
Results and discussion
Sensor selection
The sensor's response was normalized using the fractional method and, their radar graph was drawn. , shows the radar graph corresponding to the sensors’ responses for pure cow ghee (a), pure sunflower oil (b) and pure cow body fat (c).
Figure 2. Radar graph response of the sensors for pure cow ghee (a), pure sunflower oil (b) and pure cow body fat (c).
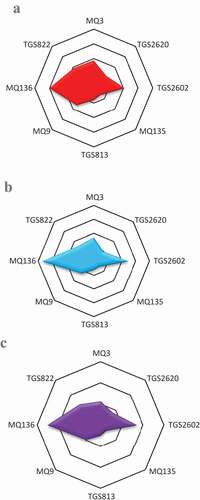
The radar graph shows that the odor of pure cow ghee, pure sunflower oil and pure cow body fat has the most and least effect on the MQ136 and MQ135 sensors, respectively. The MQ136 sensor is sensitive to sulfur dioxide odor, and MQ135 sensor is sensitive to ammonia, benzene and sulfide vapor. According to the results obtained from the radar graph, it can be concluded that the MQ136 sensor has the most role in classification among other sensors.
PCA results for the combination of cow ghee and sunflower oil
PCA was used to reduce the dimension and for primary evaluation of the similarity of classes. Based on the results of the PCA analysis, the two main components, PC1 and PC2, showed 70% and 26% variance between the pure and adulterated cow ghee samples, respectively. To understand the effect of each sensor in pattern identification analyzes, the sensors were depicted in a plot called a loading plot with special value coefficients ()).
Figure 3. Loading plot (a) and score plot (b) of PCA analysis in the diagnosis of cow ghee mixed with sunflower oil.
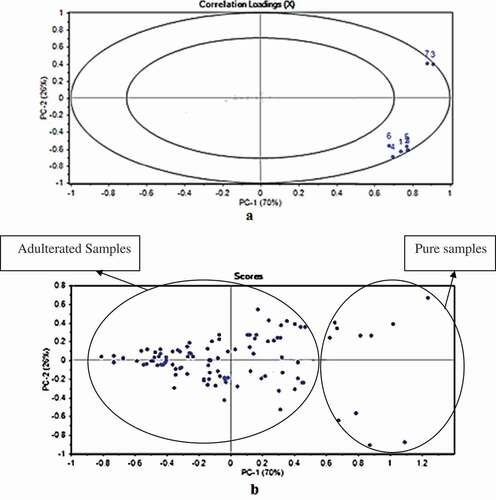
Loading plot demonstrates the sensors role in systems. Therefore, we can select the correct sensors to detect particular components in cow ghee and sensors that produce similar results can be removed to reduce the cost of making the olfactory machine.[Citation18] Based on ), it was observed that sensors No. 1 and 4 and sensors No. 2 and 8 have a similar loading coefficient. So we can select or remove one of them in the next step (construction of the apparatus).
The score plot, which describes the first and second components (PC1 and PC2) expresses the variance between the data obtained from the tests. Score plot is used to determine the existence of separate data clusters for pattern recognition. In ), the score plot diagram is shown for the two main components. This plot is used to detect the distinction between the sample groups for the pattern recognition process. As shown in the figure, there is a difference between pure cow ghee samples and adulterated ones.
In a research, the capability of e-nose machine for detecting formalin, hydrogen peroxide and sodium hypochlorite in raw milk was investigated. According to the results, principal component analysis (PCA) showed that PC1 and PC2 have 97%, 87% and 83% of variance within data for formalin, hydrogen peroxide, and sodium hypochlorite, respectively.[Citation15]
PCA results for the combination of cow ghee and cow body fat
Loading plot was used to determine the role of sensors in separating groups. Loading plot for the detection of pure cow ghee from animal fat is shown in . As seen, sensors that have the highest values for the main component are sensors 2 (TGS822), 3 (MQ136), 4 (MQ9) and 8 (TGS2620). The score plot which describes the first and second components (PC1 and PC2) expresses the variance between the data obtained from the tests. As shown in ), sensors 6 (MQ135) and 7 (TGS2602) among the other sensors, have the least role in classification. Also, it was observed that sensors No. 1 and 4 and sensors No. 2, 5 and 8 have a loading coefficient. So we can select or remove one of them in the next step.
Figure 4. Loading plot (a) and score plot (b) of PCA analysis in the diagnosis of cow ghee mixed with cow body fat.
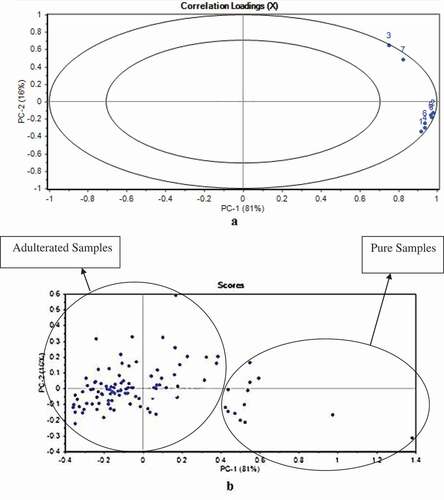
Based on the results of PCA analysis, for the combination of pure cow ghee with animal fat, two main components of PC1 and PC2 were 81% and 16%, respectively, and the variance between samples was 97% of the total data. In ), a score plot diagram is shown for the two main components. As shown in the figure, there is a distinct distinction between pure cow ghee samples and adulterated samples (combination cow ghee with cow body fat). In similar research, an electronic nose was applied to the detection of adulteration of virgin coconut oil. Principal component analysis (PCA) was used to differentiate between pure and adulterated samples. Based on the results, the PCA provided a good differentiation of samples.[Citation30] Also, in another research, PCA analysis was used for detection pig body fat in pure ghee by total reflectance Fourier transform infrared spectroscopy (ATR–FTIR) method, and for detection of goat body fat adulteration in pure ghee using ATR-FTIR spectroscopy coupled with chemometric strategy.[Citation31]
ANN results
In this research, an artificial neural network with multilayer perceptron structure was used for better performance than other types of artificial neural network with error propagation learning algorithm. In the structure of the artificial neural network, three layers are also used, since, according to Kolmogorov, three layers are suitable for the separation of any type of space.[Citation32] The structure of artificial neural network consists of three different layers, including the input layer, the middle layers (hidden) and the output layer. Within each layer, there are a number of neurons that are related to the weighted connections that the number of these neurons depends on the number of input and output variables of the model, but the selection of the number of neurons in the middle layer is determined by trial and error. The last layer or output layer contains the predicted values by the network and introduces the output of the model and the middle layers formed by the processor nodes.[Citation33]
In this study, the feed forward neural network with the Lewenberg-Markowart post-propagation training function was used. The performance evaluation of the designed networks was evaluated using the mean squared error (MSE) and correlation coefficient (r). The transfer function of the network was the hyperbolic tangent sigmoid function. In this study, 20% of the data was randomly for testing, 20% for cross-validation and 60% of the data was used for the network training. The number of neurons of the hidden layer was changed to reach the minimum mean squared error and maximum correlation coefficient. ANN has eight inputs (eight data achieved from each sensor's signal) and the output layer has 7 neurons for classifying cow ghee and adulterated oils.
Based on the results, the network with the final structure of 8–15-7 (8 neurons in the input layer, 15 neurons in the hidden layer, and 7 neurons in the output layer) was the best structure with the correct classification rate of 91.3% ( and ). Also, the mean squared error (MSE) and correlation coefficient (r) were 0.086222 and 0.87747, respectively, for the best structure.
Table 2. Confusion matrix obtained to identify cow ghee from adulterated with sunflower oil.
Table 3. Artificial neural network results for adulteration with sunflower oil.
According to the results for classification of different groups of adulterated cow ghee (with cow body fat), the network with the final structure of 8–17-7, was the best model with the correct classification rate of 82.5% (). Also, the mean squared error (MSE) and correlation coefficient (r) were obtained by the best network as 0.094352 and 0.81238, respectively ().
Table 4. Confusion matrix obtained to identify cow ghee from adulterated with cow body fat.
Table 5. Artificial neural network results for adulteration with cow body fat.
Similar research was conducted by Oliveros et al.[Citation34] They concluded that ANN can difference between adulterations of virgin olive oil. Also, an electronic nose was used for the detection of maize oil adulteration in camellia seed oil and sesame oil. The artificial neural network (ANN) model was used to detect the percentage of adulteration in camellia seed oil and sesame oil. The results showed that, based on ANN as its pattern recognition technique, the electronic nose cannot predict the percentage of adulteration in camellia seed oil, but can be used in the quantitative determination of adulteration in sesame oil.[Citation28]
Conclusion
The e-nose machines are designed to detect and distinguish various odors. In this research, an electronic nose based on 8 metal oxide semiconductor sensors was used for detection of the pure cow ghee from adulterated ones (mixed with sunflower oil and cow body fat). Principal component analysis (PCA) and artificial neural network (ANN) methods were used to classify different amounts of adulteration in cow ghee. Based on the results, the used system successfully detected pure cow ghee and the adulterated one by pattern recognition method. To classify cow ghee with different percentages of sunflower oil and cow body fat using the olfactory machine, the PCA results indicated the 96% and 97% variance of total data for sunflower oil and cow body fat, respectively. Also, the correct classification rate by ANN method was 91.3, 82.5% for sunflower oil and cow body fat, respectively.
Acknowledgments
The financial support provided by Razi University is duly gratefully acknowledged.
Additional information
Funding
Related Research Data
References
- Najafi, T.; Eghtsadi, S.; Rezaei, M.; Daneshvar, K. Effect of Kermanshah Animal Oil on Serum Fat in Healthy Men. Journal of Kermanshah University of Medical Sciences 2010, 14, 4. In Persian.
- Bahrami, G. R.; Rahi, H.; Pyravi-Vanak, Z. Change in Fatty Acids Composition of Milk Products during the Traditional Ghee-Making Process. Journal of Kerman University of Medical Sciences 2000, 7, 1, 14–19.
- Kumar, A.; 2008. Detection of Adulterants in ghee. Thesis doctor of philosophy in dairying (dairy chemistry). National dairy research institute, karanal (deemed university), India.
- Kaushik, R.; Jain, J.; Rai, P. Therapeutic Potentials of Cow Derived Products-A Review. International Journal of Pharmaceutical Sciences and Research 2016, 7, 4, 1383.
- Chunekar, K. C. Bhav Prakasa Nighantu; Chaukhamba Bharati Publications,Varanasi. 1960, 372.
- Gonzálvez, A.; Armenta, S.; De La Guardia, M. Adulteration Detection of Argan Oil by Inductively Coupled Plasma Optical Emission Spectrometry. Food Chemistry 2010, 121, 3, 878–886.
- Gomila, G.; Casuso, I.; Errachid, A.; Ruiz, O.; Pajot, E.; Minic, J.; Bausells, J. Advances in the Production, Immobilization, and Electrical Characterization of Olfactory Receptors for Olfactory Nanobiosensor Development. Sensors and Actuators B: Chemical 2006, 116, 1–2, 66–71.
- Störtkuhl, K. F.; Fiala, A. The Smell of Blue Light: A New Approach toward Understanding an Olfactory Neuronal Network. Frontiers in Neuroscience 2011, 5, 72.
- Yates, D.; Sensory Systems: Connecting Olfaction. Nature Reviews Neuroscience 2013, 15, 1, 4.
- Schiffman, S. S.; Pearce, T. C. Introduction to Olfaction: Perception, Anatomy, Physiology, and Molecular Biology. Handbook of Machine Olfaction: Electronic Nose Technology 2004, 1–31.
- Korel, F.; Balaban, M. Ö. Electronic Nose Technology in Food Analysis. Handbook of Food Analysis Instruments 2008, 10, 9781420045673.
- Panigrahi, S.; Balasubramanian, S.; Gu, H.; Logue, C. M.; Marchello, M. Design and Development of a Metal Oxide Based Electronic Nose for Spoilage Classification of Beef. Sensors and Actuators B: Chemical 2006, 119, 1, 2–14.
- Tian, X.; Wang, J.; Cui, S. Analysis of Pork Adulteration in Minced Mutton Using Electronic Nose of Metal Oxide Sensors. Journal of Food Engineering 2013, 119, 4, 744–749.
- Güney, S.; Atasoy, A. Study of Fish Species Discrimination via Electronic Nose. Computers and Electronics in Agriculture 2015, 119, 83–91.
- Tohidi, M.; Ghasemi-Varnamkhasti, M.; Ghafarinia, V.; Bonyadian, M.; Mohtasebi, S. S. Development of a Metal Oxide Semiconductor-Based Artificial Nose as a Fast, Reliable and Non-Expensive Analytical Technique for Aroma Profiling of Milk Adulteration. International Dairy Journal 2018, 77, 38–46.
- Haddi, Z.; Alami, H.; El Bari, N.; Tounsi, M.; Barhoumi, H.; Maaref, A.; Bouchikhi, B. E. N. A. C. H. I. R. Electronic Nose and Tongue Combination for Improved Classification of Moroccan Virgin Olive Oil Profiles. Food Research International 2013, 54, 2, 1488–1498.
- Gorji-Chakespari, A.; Nikbakht, A. M.; Sefidkon, F.; Ghasemi-Varnamkhasti, M.; Valero, E. L. Classification of Essential Oil Composition in Rosa Amascene Mill. Genotypes Using an Electronic Nose. Journal of Applied Research on Medicinal and Aromatic Plants 2017, 4, 27–34.
- Heidarbeigi, K.; Mohtasebi, S. S.; Foroughirad, A.; Ghasemi-Varnamkhasti, M.; Rafiee, S.; Rezaei, K. Detection of Adulteration in Saffron Samples Using Electronic Nose. International Journal of Food Properties 2015, 18, 7, 1391–1401.
- Kiani, S.; Minaei, S.; Ghasemi-Varnamkhasti, M. Integration of Computer Vision and Electronic Nose as Non-Destructive Systems for Saffron Adulteration Detection. Computers and Electronics in Agriculture 2017, 141, 46–53.
- Xu, K.; Wang, J.; Wei, Z.; Deng, F.; Wang, Y.; Cheng, S. An Optimization of the MOS Electronic Nose Sensor Array for the Detection of Chinese Pecan Quality. Journal of Food Engineering 2017, 203, 25–31.
- Gaopu, P.; Haiyan, G.; Bolin, S.; Lei, Z.; Houyin, W.; Ruicong, Z.; Jingyuan, Y. Information Variation Feature and Discriminant Capabilities of Electronic Nose for Typical Adulteration Honey Identification. Transactions of the Chinese Society of Agricultural Engineering 2015, 31, 325-331.
- Gancarz, M.; Wawrzyniak, J.; Gawrysiak-Witulska, M.; Wiącek, D.; Nawrocka, A.; Rusinek, R. Electronic Nose with Polymer-Composite Sensors for Monitoring Fungal Deterioration of Stored Rapeseed. International Agrophysics 2017, 31, 3, 317–325.
- Shen, F.; Wu, Q.; Su, A.; Tang, P.; ShAo, X.; Liu, B. Detection of Adulteration in Freshly Squeezed Orange Juice by Electronic Nose and Infrared Spectroscopy. Czech Journal of Food Science 2016, 34, 3.
- Lavanya, S.; Deepika, B.; Narayanan, S.; Murthy, V. K.; Uma, M. V. Indicative Extent of Humic and Fulvic Acids in Soils Determined by Electronic Nose. Computers and Electronics in Agriculture 2017, 139, 198–203.
- Hu, Z.; Li, X.; Wang, H.; Niu, C.; Yuan, Y.; Yue, T. A Novel Method to Quantify the Activity of Alcohol Acetyltransferase Using A SnO2-based Sensor of Electronic Nose. Food Chemistry 2016, 203, 498–504.
- Wilson, A.-D.; Baietto, M. Applications and Advances in Electronic-Nose Technologies. Sensors 2009, 9, 7, 5099–5148.
- Doleman, B. J.; Lewis, N. S. Comparison of Odor Detection Thresholds and Odor Discriminability of a Conducting Polymer Composite Electronic Nose versus Mammalian Olfaction. Sensors and Actuators B: Chemical 2001, 72, 1, 41–50.
- Hai, Z.; Wang, J. Detection of Adulteration in Camellia Seed Oil and Sesame Oil Using an Electronic Nose. European Journal of Lipid Science and Technology 2006, 108, 2, 116–124.
- Ghasemi-Varnamkhasti, M.; Mohtasebi, S. S.; Siadat, M.; Lozano, J.; Ahmadi, H.; Razavi, S. H.; Dicko, A. Aging Fingerprint Characterization of Beer Using Electronic Nose. Sensors and Actuators B: Chemical 2011, 159, 1, 51–59.
- Marina, A. M.; Man, Y. C.; Amin, I. Use of the SAW Sensor Electronic Nose for Detecting the Adulteration of Virgin Coconut Oil with RBD Palm Kernel Olein. Journal of the American Oil Chemists’ Society 2010, 87, 3, 263–270.
- Upadhyay, N.; 2014. Detection of vegetable oil and animal body fat adulteration in ghee using solvent fractionation technique. Thesis doctor of philosophy in dairying (Dairy Chemistry). National Dairy Research Institute, Karnal (Deemed University), India.
- Manhaj, M. B.; 2005. Book of Fundamentals of Neural Networks (Computational Intelligence, Vol. I). Amir Kabir University of Technology Publication. In Persian.
- Alpaydın, E.;. Introduction to Machine Learning, Second ed.; MIT. Press: Londen, England, 2010.
- Oliveros, M. C. C.; Pavón, J. L. P.; Pinto, C. G.; Laespada, M. E. F.; Cordero, B. M.; Forina, M. Electronic Nose Based on Metal Oxide Semiconductor Sensors as a Fast Alternative for the Detection of Adulteration of Virgin Olive Oils. Analytica Chimica Acta 2002, 459, 2, 219–228.