
ABSTRACT
A computer vision technique was used to determine the volume of raw agricultural products with an irregular shape. Thirty images of each rotated raw roma tomato, salad tomato, white button mushroom, and strawberry were collected. Volume determinations of these products using the optical imaging system were compared to volume measurements collected using a water displacement/buoyant force method. A high correlation was found between measurements from both methods. Furthermore, regression analyses of weight and volume measurements of each product set were used to develop equations to predict object volume from object weight. Weight measurement of raw produce can be used as a non-destructive method to estimate unit volume for sorting and grading purposes.
KEYWORDS:
Introduction
Volume determination of raw agricultural commodities is useful when grading and separating products by size and quality. Size determination is relevant in fresh fruit postharvest operations since it helps the sorting of market fruits into size groups and assigning the market target and price differentials of large and small produce to match consumer preferences. Additionally, uniformly sized fruits are preferred by many consumers. Moreover, fruit sizing allows an organized pattern of packing that provides a better protection of the produce over packing mixed sized products.[Citation1] Pattern packaging provides better use of the volume in the shipping container, due to the higher packing density.[Citation2] Non-destructive fruit volume estimation can be used as a ripeness index to predict optimum harvest time,[Citation3] predict yield,[Citation4] or to study the relationship between fruit expansion rate and susceptibility to physiological disorders such as fruit cracking.[Citation5]
Figure 4. Roma tomato (n = 30) density: mean estimated density (imaging method) versus mean actual density (buoyant force method).
Achieving rapid and accurate volumetric measurements is difficult, especially when irregularly shaped objects or agricultural products are involved. Previous studies in volume measurement of agricultural food products can be classified as those for irregularly shaped objects or those for axisymmetric objects (cross-sections of the object are circular if perpendicular to the major axis).[Citation6] For examples, Wang and Nguang[Citation7] demonstrated a method to compute the volume and surface area of axisymmetric products such as eggs, lemons and limes by capturing one image from a fixed projection. And, Venkatesh et al.[Citation8] used an image processing based technique to determine the relationship between the estimated volume and mass of axisymmetric fruits (apples, sweet-limes, lemons, and oranges).
Food physical property applications including three-dimensional (3-D) visualization, volumetric measurement, and surface area measurement require some form of 3-D surface reconstruction. However, the irregular shape of raw fruits and vegetables makes 3-D surface reconstruction a challenging task. One approach for estimating surface area and volume of irregular objects is to employ the finite element method (FEM). In this method, a two-dimensional coordinate grid depicting the shape of the object is formed. The object is sectioned along a selected axis and section measurements are used to estimate surface area and volume of a reconstructed object. Goñi et al.[Citation9] used this method to estimate the surface area and volume of apples and meat pieces with less than 2% estimation error. They concluded that applying lofting technique allows obtaining an accurate representation of the real shape of irregular multi-dimensional foodstuffs and this method demonstrated its ability to correctly predict volume and surface area of general objects, including those of low symmetry and sphericity. Additionally, for irregularly shaped objects, Lee et al.[Citation10] proposed a machine vision method, using multiple silhouettes, to measure product volume. In this study, images of the rotating object were the basis for developing a 3-D wireframe model to approximate the volume.
A xylometric method may be acceptable to measure some raw fruits, such as apples or oranges. In this method, the volume of an object is measured by submerging it in a container with water and measuring the volume of the displaced water. The volume of water absorbed by the fruit is not considered significant. Errors related to this method include human error in reading the water level from a graduated vessel. This method is based on the Archimedes’ Principle, which states that the buoyant force on a submerged object is equal to the weight of the fluid displaced. When the fruit is completely submerged into water, the weight of the water displaced is equal to its volume multiplied by the specific weight of the water, which is 1 g/cm3. So, if the buoyant force upon on the object is determined, then its volume can be calculated. The buoyant force method for apparent volume determination is especially useful with solid objects that do not absorb liquid easily.[Citation11]
Since the shape of many fruits and vegetables resemble some regular geometrical objects, the use of theoretical estimation with certain numerical techniques can be used to estimate their volume. Sabliov et al.[Citation12] developed an image processing method for ellipsoidal agricultural products including eggs, lemons, limes, and peaches assuming that each product has an axisymmetric geometry and is a sum of superimposed elementary frustums. Other researchers have developed correlations between some measured attributes such as weight, length, diameter, and volume. For example, Humeida and Hobani[Citation13] used weight or mean diameter in predictive equations to estimate the surface area and volume in pomegranates. Babic et al.[Citation14] demonstrated that measurement of pear length can be used to estimate the surface area and volume of a pear quarter. Wright et al.[Citation15] developed a digital image analysis system to measure sweet potatoes and calculate volumes and surface areas. Eifert et al.[Citation16] reported the development of a rapid, non-destructive technique to measure the surface area of raw produce using an optical imaging system. That same measurement system was used in this project to determine the volume of selected agricultural products.
The objective of this research was to validate a rapid technique to measure the volume of selected raw produce including white button mushrooms, strawberries, roma tomatoes, and salad tomatoes. Volume measurements, using a machine vision imaging system, were validated by comparison to volume measurements generated by a buoyant force method with products that varied in mass (strawberries vs salad tomatoes, for example) and/or density (mushrooms vs tomatoes, for example). Additionally, a goal of this research was to determine statistical relationships between sample unit volume and raw weight for the different products. Appropriate statistical relationships between volume and weight could permit the prediction of product volume based on weight measurement.
Materials and methods
Raw produce weight and volume measurements
Roma tomatoes, salad tomatoes, white button mushrooms, and strawberries were purchased from local retail food markets (Blacksburg, Virginia) and were free from visible injuries. Prior to volume measurement, the weight of each fruit was recorded. The volume of 30 samples each of salad tomatoes and roma tomatoes and 35 samples each of white button mushrooms and strawberries was measured in triplicate by two methods, including a machine vision system.
The machine vision system with the OmniSurface software (Smart Vision Works International LLC, American Fork, UT) used in this project to measure volume was previously described in Lee et al.[Citation10] and Lee et al.[Citation17] For this radial projection technique, samples were placed on the object holder on the flywheel, perpendicular to the core of the fruit. The flywheel was rotated by hand as the system collected thirty images (each 6° of rotation) with a synchronized camera. The boundary points of each image were then extracted to construct a silhouette. A 3-D wire-frame model of the object can be reconstructed by integrating silhouettes obtained from the different view angles. Volume and surface area were determined by means of surface fitting and approximation on the wire-frame model.[Citation10] System calibration was performed using spheres with a known volume (V), where V = 4/3 πr3. These spheres (balls) were of diameter 3 cm (V = 14.14 cm3) and 6.5 cm (V = 143.79 cm3). The software calculated the volume (cm3) of each sample unit from the 30 images collected. Images could be collected and volume calculated in less than five seconds. To evaluate the precision of the volume measurements, each fruit was measured three times and the coefficient of variation ((SD/μ) x 100) was calculated.
Volume was also measured by determination of buoyant force where volume is calculated from the object weight and the force required for submerging the object under water. Force (gf = grams force) was measured with an Instron Model 1011 Universal Testing Instrument (Instron Corp. Canton, MA). During Instron measurement, a 5-kg load beam was used and the resolution of force was 0.125 g. After the attachment was submerged into water, the Instron force was adjusted to zero. Then, the fruit was quickly submerged into water and held on the underwater part of the attachment and the force reading was recorded. The buoyant force equals the sum of the Instron force measurement (gf) and the fruit weight (g). This sum was used to represent the volume (cm3) of the fruit.
Relationships of raw produce volume and weight
For each type of produce, simple linear regression was performed to determine any statistical relationship between weight (g) and volume (cm3).[Citation18] The method of least squares was used to estimate the regression coefficients in models relating single variables to sample weight. Analyses were performed using the JMP Statistical Discovery Software (SAS Institute Inc., Cary, NC). Based on the regression analyses, an equation was developed to predict volume, based on weight measurements.
Results and discussion
includes the means and standard deviations (SD) for weight, Instron grams force (gf) to submerge the fruit, mean volume and density obtained with the buoyant force method (Instron), mean volume and density determined with the machine vision system (OmniSurface). Using the buoyant force method, the volume of each fruit is determined by the sum of its weight plus the sum of the Instron force measurement. The mean and SD reported are calculated after weight and force have been summed. Additionally, for each fruit sample, the per cent difference in mean density (g/cm3) between the two measurement techniques (image analysis system, buoyant force method) was calculated. The mean and standard deviation of the density per cent difference for each fruit set is reported in .
Table 1. Volume and density of salad tomatoes, roma tomatoes, mushrooms, and strawberries.
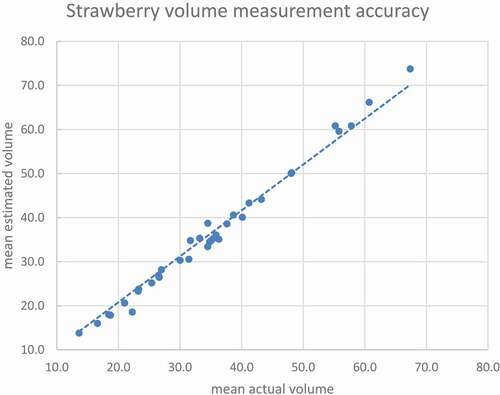
The mean volume, when measured with the OmniSurface machine vision method, was slightly lower for salad tomatoes and roma tomatoes, and slightly higher for white button mushrooms and strawberries when compared with the buoyant force method for volume measurement. compares the volume measurements of 35 mushrooms by the two methods. And, compares the volume measurements of 35 strawberries by the two methods. For strawberries, the mean volume (36.1 + 14.9 g) determined with the imaging system was ~2.8% greater than the mean volume (35.1 + 13.2 g) determined with the buoyant force method ().
Figure 1. Mushroom (n = 35) measurement accuracy comparison: mean estimated volume (imaging method) versus mean actual volume (buoyant force method).
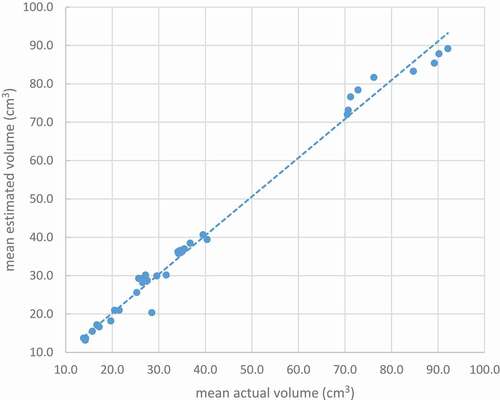
Figure 2. Strawberry (n = 35) measurement accuracy comparison: mean estimated volume (imaging method) versus mean actual volume (buoyant force method).
The ratio of mass to volume (density) is a constant for a homogenous substance. For raw agricultural products, the water content, tissue structure, porosity, etc., can vary greatly (mushroom vs cucumber, for example). Furthermore, for a single product type, the moisture content can vary considerably depending on its pre-harvest or post-harvest age or the climate or season where grown. The density of raw tomatoes, mushrooms or strawberries are not fixed constants and therefore could not be used to calculate the volume in this study. We can calculate and compare densities based on our mass and volume (two methods) measurements.
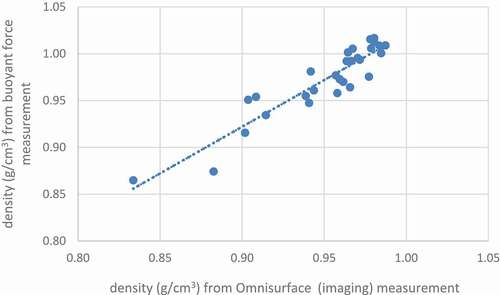
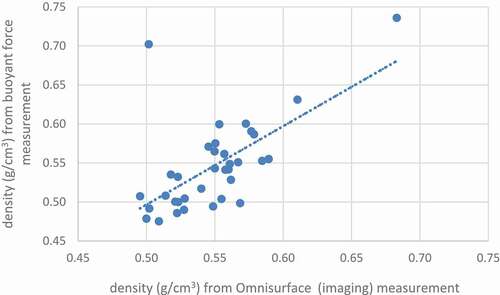
For salad tomatoes, the mean of the percent differences in density by buoyant force method was lower (2.3% + 2.1%) than the densities determined by the machine vision system. For roma tomatoes, the mean density (2.3% + 1.3%) by buoyant force method was similarly lower than the density determined with the machine vision system. For mushrooms and strawberries, the mean per cent differences in density determinations (between volume measurement methods) was lower than seen for the tomatoes, but the standard deviation was much higher (). Comparison of the density determinations for white button mushrooms and for strawberries are plotted in , respectively.
Figure 3. Mushroom (n = 35) density: mean estimated density (imaging method) versus mean actual density (buoyant force method).
includes the predictive equations obtained from the regression analyses that were developed to determine the volume (imaging system) of individually weighed salad tomatoes, roma tomatoes, mushrooms, and strawberries, from weight. All four equations show a high correlation (R2 ≥0.92) between volume and weight. These equations should be considered most applicable for products whose weight falls within the range of the measured products, as shown in . Volume measurement of just 30 or 35 samples of these raw agricultural products was sufficient to generate a suitable equation to estimate volume from weight measurement. Therefore, weight measurement could be a rapid alternative grading or sorting method for these fruits when volume needs to be estimated. In-line measures of weight are common in many food and agriculture industries.
Table 2. Fruit volume estimation from weight measurement.
For the fruits used in this study, we found a high correlation between unit volume as measured using weight and buoyant force, and as measured with the optical imaging system. Omid et al.[Citation19] also reported high R2 values (>0.92) for the mass and the computed volume of oranges, lemons, limes, and tangerines using an image processing method. Moreda et al.[Citation20] concluded that the best method for measuring the volume of most fruits is by a water displacement method based on the Archimedes principle. However, submerging some fruits in water can make them more susceptible to subsequent fungal attack and possible loss of quality, and therefore may not be practical as a way to measure volume for some fruit types. Optical imaging systems can be an option for measuring the volume of an agricultural product without affecting the final product quality.
Even though measurements were collected on fruit from the same local vendors during the same season, the water content or water percentage of individual fruit could have varied greatly. For some raw produce, it may be necessary to develop separate regression equations for small fruit, large fruit, different fruit varieties or fruits harvested in different seasons or from different climates. In this study, the mean weight of each fruit group had a relatively large standard deviation ( or ). For example, for strawberries, the mean weight was 32.0 ± 11.9. Even though the weight of individual strawberries ranged from approximately 13 to 61 g, we observed a high correlation between mean weight and mean volume (both measurement methods).
The machine vision volume measurement technique demonstrated high repeatability for each produce type. For individual units of all produce tested, the coefficient of variation (CV = ((SD/μ) x 100)) for the three volume measurements (per fruit) was less than 2% (data not included) which indicates the high precision of the measurements. The machine vision system demonstrated sufficient accuracy and precision to be useful in many research or commercial industry applications for produce or other objects or foods. While the objects studied here have relatively high sphericity (roma and salad tomatoes) or symmetry (strawberries and white button mushrooms) an ideal volume measurement system should demonstrate high accuracy for other agricultural products that are not symmetrical or spherical. This system appears capable of accurately measuring the volume of more irregularly shaped objects than other published methods. On the other hand, the orientation of the objects on the flywheel must be done carefully and consistently to ensure measurement repeatability.
Conclusion
Image processing methods have been used to quickly estimate the volume, mass, and surface area of a variety of agricultural products. More specifically, the imaging system reported here could rapidly determine the volume of irregularly shaped raw produce including strawberries and white button mushrooms. The weight and volume relationships reported here could be used by those who want to estimate volume quickly (through mass measurement), without having to measure the volume of each product. For these products, volume determinations based on a single value of density may not be practical since density can be variable and density may not be known or consistently reported.
Our intent was to describe a method where products could be quickly measured to report relationships between weight and volume. In this study, the volume of each fruit was measured in less than five seconds. Fast and accurate weight measurement of agricultural commodities, including fruits and vegetables, can be easily measured in the laboratory or during in-line processing. A machine vision system can offer a non-destructive method to measure the volume of these products. The combined information can be used to develop equations that can estimate volume from actual weight. These predictive equations can then facilitate sorting and grading tasks in the food industry, even without an inline image processing system present.
Related Research Data
References
- Peleg, K. Sorting Operations. In Peleg, K, editor, Produce Handling, Packaging and Distribution; AVI Publishing Co.: Westport, 1985; pp 53–87.
- Studman, C.J. Fruits and Vegetables: Handling Systems and Packaging. In Bakker-Arkema F.W., DeBaerdemaeker J, Amirante P, Ruiz-Altisent M, Studman, CJ, editors, CIGR Handbook of Agricultural Engineering; ASAE: St. Joseph, 1999; Vol. IV, pp 291–339.
- Hahn, F.; Sanchez, S. Carrot Volume Evaluation Using Imaging Algorithms. Journal of Agricultural Engineering Research 2000, 75(3), 243–249. DOI: 10.1006/jaer.1999.0466.
- Mitchell, P.D. Pear Fruit Growth and the Use of Diameter to Estimate Fruit Volume and Weight. HortScience 1986, 21(4), 1003–1005.
- Ngouajio, M.; Kirk, W.; Goldy, R. A Simple Model for Rapid and Nondestructive Estimation of Bell Pepper Fruit Volume. HortScience 2003, 38(4), 509–511.
- Siswantoro, J.; Prabuwono, A.S.; Abdulah, A. Volume Measurement of Food Product with Irregular Shape Using Computer Vision and Monte Carlo Method: A Framework. Procedia Technology 2013, 11, 764–770. DOI: 10.1016/j.protcy.2013.12.256.
- Wang, T.Y.; Nguang, S.K. Low Cost Sensor for Volume and Surface Area Computation of Axi-Symmetric Agricultural Products. Journal of Food Engineering 2007, 79, 870–877. DOI: 10.1016/j.jfoodeng.2006.01.084.
- Venkatesh, G.V.; Iqbal, S.M.; Gopal, A.; Ganesan, D. Estimation of Volume and Mass of Axi-Symmetric Fruits Using Image Processing Technique. International Journal of Food Properties 2015, 18, 608–626. DOI: 10.1080/10942912.2013.831444.
- Goñi, S.M.; Purlis, E.; Salvadori, V.O. Three-Dimensional Reconstruction of Irregular Foodstuffs. Journal of Food Engineering 2007, 82, 536–547. DOI: 10.1016/j.jfoodeng.2007.03.021.
- Lee, D.J.; Xu, X.; Eifert, J.D.; Zhan, P. Area and Volume Measurements of Objects with Irregular Shapes Using Multiple Silhouettes. Optical Engineering 2006, 45(2), 027202-1–11. DOI: 10.1117/1.2166847.
- Rodríguez-Ramirez, J.; Méndez-Lagunas, L.; López-Ortiz, A.; Sandoval Torres, S. True Density and Apparent Density during the Drying Process for Vegetables and Fruits: A Review. Journal of Food Science 2012, 77(12), R145–R154. DOI: 10.1111/j.1750-3841.2012.02990.x.
- Sabliov, C.M.; Boldor, D.; Keener, K.; Farkas, B. Image Processing Method to Determine Surface Area and Volume of Axi-Symmetric Agricultural Products. International Journal of Food Properties 2002, 5(3), 641–653. DOI: 10.1081/JFP-120015498.
- Humeida, M.A.; Hobani, A.I. Physical Properties of Pomegranate Fruits. Journal of King Saud University, Agricultural Sciences 1993, 5(2), 165–175.
- Babic, L.; Matic-Kekic, S.; Dedovic, N.; Babic, M.; Pavkov, I. Surface Area and Volume Modeling of the Williams Pear (Pyrus Communis). International Journal of Food Properties 2012, 15, 880–890. DOI: 10.1080/10942912.2010.506020.
- Wright, M.E.; Tappan, J.H.; Sistler, F.E. The Size and Shape of Typical Sweet Potatoes. Transactions of the ASAE 1986, 29(3), 678–682. DOI: 10.13031/2013.30212.
- Eifert, J.; Sanglay, G.; Lee, D.J.; Sumner, S.; Pierson, M. Prediction of Raw Produce Surface Area from Weight Measurement. Journal of Food Engineering 2006, 74, 552–556. DOI: 10.1016/j.jfoodeng.2005.02.030.
- Lee, D.J.; Eifert, J.D.; Zahn, P.; Westover, B. Fast Surface Approximation for Volume and Surface Area Measurements Using Distance Transform. Optical Engineering 2003, 42(10), 2947–2955. DOI: 10.1117/1.1605737.
- Sanglay, G.C. Surface Area Mapping and Rinse Procedures of Raw Produce to Determine Effectiveness of Pathogen Removal. M.S. Thesis, Virginia Tech, Blacksburg, 2002. DOI:10.1044/1059-0889(2002/er01).
- Omid, M.; Khojastehnazhand, M.; Tabatabaeefar, A. Estimating Volume and Mass of Citrus Fruits by Image Processing Technique. Journal of Food Engineering 2010, 100, 315–321. DOI: 10.1016/j.jfoodeng.2010.04.015.
- Moreda, G.P.; Ortiz-Cañavate, J.; García-Ramos, F.J.; Ruiz-Altisent, M. Non-Destructive Technologies for Fruit and Vegetable Size Determination – A Review. Journal of Food Engineering 2009, 92, 119–136. DOI: 10.1016/j.jfoodeng.2008.11.004.