
 ?Mathematical formulae have been encoded as MathML and are displayed in this HTML version using MathJax in order to improve their display. Uncheck the box to turn MathJax off. This feature requires Javascript. Click on a formula to zoom.
ABSTRACT
Protein and fat oxidation are important factors that influence the quality of bovine liver. The objectives of this study were to investigate the degree of oxidation changes in bovine livers during 90d at different temperatures (−20°C, −10°C, 0°C, 10°C, and 20°C), and to develop Arrhenius models to predict its degree of oxidation.Carbonyl, thiobarbituric acid (TBA), peroxide value (POV) as oxidation attributes of bovine liver during storage were measured at different time and the changes were kinetically modeled using the Arrhenius equation. The activation energies of carbonyl, (TBA) and (POV) were 27.48, 55.48, and 58.94 KJ/mol, respectively. The determination coefficients (R2) were above 0.97 for all. In addition, volatile compounds in bovine liver and consumer acceptance of bovine liver pate with bovine liver as the final product were also measured. Among the volatile compounds, The content of aldehydes and ketones in bovine livers stored at different temperatures increased significantly (p < 0.05). Consumer acceptance of bovine liver indicates that consumers prefer bovine liver paste made from bovine liver stored at lower temperatures (below 0°C).
Introduction
The liver is an important organ in cattle for food storage. Bovine livers are rich in nutrients, have prominent health and medicinal functions, and have a huge value for processing and utilization.[Citation1] Numerous local and foreign studies investigated the active ingredients of bovine livers, for example, L-carnitine, taurine, and glutathione were extracted from bovine liver.[Citation2,Citation3] Moderate consumption of bovine liver can prevent anemia, maintain normal visual function, reproductive function, maintain the integrity of epithelial cell structure, promote children’s growth and development, improve exercise capacity, anti-aging anti-oxidation, and prevent the occurrence of cancer. Therefore, bovine livers have a wide range of prospects in terms of processing and utilization.[1–Citation4] Although previous studies reported many preparations of bovine liver enzymes and products, no information is available regarding the quality changes in bovine liver during storage. In general, the characteristics ofany novel food ingredient and its changes during storage should be determined because they provide information on the maintenance of the product at an appropriate level of quality.[Citation5] In addition, bovine livers contain higher enzyme activity than meat, indicating that bovine liver may have a shorter shelf life.[Citation6] The shelf life expectations of bovine livers are limited due to insufficient information although they are available as active substances and food raw materials.
On the basis of related reports, meat oxidation is the main reason for quality deterioration during long-term frozen storage.[Citation7] Meat oxidation leads to the degradation of aromas and textures and reduction of nutritional values.[Citation8] The reduction of bovine liver quality may be due to the interaction between lipid oxidation products and proteins. In meat systems, protein oxidation can be assessed by multiple chemical oxidation of several proteins themselves,[Citation9] including sulfhydryl and tryptophan fluorescence losses, increase of carbonyl derivatives, and intermolecular and intramolecular cross-linked state formations.[Citation10–Citation12] Among the abovementioned changes, the formation of carbonyl compounds is one of the most notable chemical modifications on oxidized proteins. Lipid peroxidation in air is classified into three types, namely, free radical oxidation, enzymatic oxidation, and non-radical non-enzymatic oxidation.[Citation13] These oxidations lead to the formation of hydrocarbons, aldehydes, and ketones, which are the causes of peculiar odors, off-flavors, rancidity, color deterioration, and protein oxidation that lead to deterioration of meat quality.[Citation14] The current methods commonly used for lipid oxidation assays include thiobarbituric acid (TBA) and peroxide value (POV) analyses.[Citation15]
Arrhenius equation is a model commonly used in the kinetic analysis of chemical reactions that transform the relationship between chemical reaction and temperature into model parameters, such as activation energy.[Citation16] In general, Arrhenius kinetic model is mainly applied to single-stage reaction. However, a large number of studies have shown that this model can still be used for the construction of a large number of complex reaction models[Citation17–Citation19] and its application in oxidation reaction has also been reported in many cases. Fan[Citation20] used this model to analyze the accumulation of TBA in pork sausages and determined that the maturation of sausages completely conformed with the Arrhenius kinetic model in terms of oxidation degree. Traditional protein and lipid oxidation research methods are described by the changes in relevant indicators during storage. However, these methods are insufficient to deal with complex protein and fat oxidation phenomenon. The underlying mechanism of this method is difficult to investigate. Thus, a mathematical modeling for the analysis of concepts is applicable to this complex reaction analysis. However, no information are available about using the Arrhenius equation to determine the quality change in bovine liver during storage.
This study aimed to determine the oxidative state of bovine livers during storage by measuring the carbonyl, TBA, POV contents of bovine livers during storage, to analyze the change in oxidation state during storage, and to determine the difference between activation energy of individual bovine liver by using a dynamic model. Meanwhile, volatile flavors were analyzed based on the changes in volatiles of bovine during storage.
Materials and methods
The bovine liver (Aberdeen Angus) used in the experiment was collected from Shaanxi Qinbao Animal Husbandry Co., Ltd.(Baoji City, Shaanxi Province, China). Tested cattle for the normal development, Six healthy, disease-free cattle aged 4 years old and with normal development were selected. The cattle were subjected to Prepre-slaughter fasting for 12–24 h, and ban water for 2 h. Bovine liver was taken 2 h. After the cattle were slaughtered, the liver was immediately collected and after slaughter and divided into small pieces of 50 g to correspond to each sampling time point.
Sample processing
Bovine livers were packed in transparent polyethylene (PE) sealed bags and stored at −20°C, −10°C, 0°C, 10°C, and 20°C. During storage, the temperature was recorded using a thermal recorder (TR-72wf, T&D Corporation, Nagano, Japan). For protein and fat oxidation, bovine livers were stored at different time points and sampled at different times (). The obtained data were used for establishing the Arrhenius kinetic model and validation test for simulated storage. After the samples were stored at 5°C and 15°C for 0, 2, 4, and 6 days, carbonyl content, TBA level, and POV were measured. The resulting kinetic model was used to calculate the predicted value, which was compared with the measured value to evaluate the application effect of the model. The bovine liver was washed and sealed in a PE bag to eliminate the interference of microbial spoilage on the experimental results. The bag was filled with a mixture of oxygen and nitrogen at a ratio of 21:79. Air contact effects were simulated. In the experiments, determination of total plate count was done using plate method described in ISO 2293:1988.[Citation21]
Table 1. Sample sampling time at different temperatures.
Quality changes in bovine liver during storage
Carbonyl content was determined using the methods of Oliver[Citation22] with slight modifications. In brief, 1 mL of 2mg/mL myofibrillar protein solution was obtained, added with 1 mL of 10 mM dinitrophenylhydrazine (DNPH). After 1 h of reaction in a darkroom at room temperature, the mixture was added with 1 mL of 20% trichloroethane solution and centrifuged at 10000g for 5 min. The precipitate was washed with 1 mL of ethyl acetate: ethanol (1:1). The precipitate was then added with 3 mL of 6mol/L guanidine hydrochloride solution and placed in a water bath for 15 min at 37°C to dissolve the precipitate. The reaction mixture was centrifuged at 10000g for 3 min. Absorbance was recorded from the supernatant at 370 nm. For the blank treatment, the DNPH solution was replaced with 2 mol/L hydrochloric acid.
TBA was determined following the method of Erkan and Özden[Citation23] with a slight modification. Two gram minced bovine liver was added to 16 mL of 5% TCA and 100 μl of 2 g/L butylated hydroxytoluene (in ethanol). The mixture was homogenized for 2 min and then centrifuged at 5000 rpm for 3 min. Five milliliters of the supernatant was mixed with 1 mL of 0.01 M TBA and heated in a boiling water bath for 40 min. The mixture was allowed to cool down to room temperature, and the absorbance of the mixture was measured at 532 nm using a UV-756P spectrophotometer.
POV was determined using the method of Shi et al.[Citation24] The bovine liver 0.3 g was dissolved in 9.8 ml of chloroform–methanol (7:3, v/v) and mixed for 4 s. The mixture was added with 0.05 mL of 30% ammonium thiocyanate and mixed for 4 s. Then, 0.05 m of 3.5 g/L ferrous chloride in 10 M HCl was added and mixed again for 4 s. After 5 min standing at room temperature, the absorbance was measured at 500 nm using a UV-756P spectrophotometer. The POV was expressed as milliequivalents (meq) of peroxide/kg lipid, and a reference curve was plotted using ferric chloride standard.
Kinetic modeling
Arrhenius equation was used to estimate the change in mass of bovine liver at different temperatures (−20°C, −10°C, 0°C, 10°C, and 20°C) during storage. In general, the expected change in meat quality during storage can be expressed by using the first-order model as:
where B is the content of oxidation index, B0 is the initial content of oxidation index, k is the rate constant (d) at the given temperature, and t is the storage time. The Arrhenius kinetic model based on the first-order model was used to analyze the second model described by Giannakourou & Taoukis.[Citation25] The fitting function of the reaction rate constant k to the temperature is expressed as:
where K is the oxidation reaction rate at temperature T, K0 is the frequency factor in the Arrhenius kinetic model, Ea is the oxidation reaction activation energy (KJ (mol)−1), and R is the gas equilibrium constant (8.3144 J (mol K)−1). The revised Arrhenius formula is expressed as:
The zero-order kinetic model is developed as
The slope of regression line (−Ea/R) is plotted over the mutual utilization of KB(T−1). The Ea is obtained by the regression on the slope of the straight line, and K0 is obtained by the intercept of the regression line.
Analysis of volatile compounds
For each bovine liver, 3 g (± 0.001) was choped and gathered in the basement of a 20 mL SPME vial. Soon afterwards the vials were washed with nitrogen for 20 s and sealed with parafilm (PM996, Parafilm, USA) to avoid the infuence of oxygen. Vials were conserved at 4°C until analysis. Samples were equilibrated in a laboratory stirrer/hot plate at 37°C for 40 min.
For quantitation of volatile compounds, the SPME device was inserted into the injection port of gaschromatograph. And SPEM injector was cleaned at 100°C for 20 min after each injection. The instrument of Gas chromatography-mass spectrometry was a Clarus 500 gas chromatograph coupled with an Autosystem XL-Turo Mass spectrometer (Agilent, USA). At 250 °C, the SPME device was desorbed directly at the GC-MS inlet for 5 min in splitless mode, with a pressure pulse of 30 psi (column flow rate of 2 mL/min during this time). The Helium (carrier gas) flow rate was 0.8 mL/min. A DB-WAX capillary column (J&W Scientific, Palo Alto, USA) of 60 m × 0.25 mmI.D. The initial temperature of the oven was 50 °C for 10 min, then increased by 3℃/min to 225℃, followed ramped to 250°C at 10°C/min and finally held at this temperature for 5 min. The MS conditions were that transfer line temperature of 230°C, trap temperature of 200°C, emission current of 70 eA. Record the global runtime in full scan mode (m/z 33 ~ 300 mass range).
There are volatile organic compounds such as alkanes, benzene, and aldehydes and ketones in bovine liver. Alkanes are more volatile and difficult to maintain a constant content, so they are not seen as internal standards. The undetected cyclohexanone and chlorobenzene in the sample were initially retained as internal standards. Samples containing 1mg/L internal standard were tested. The results showed that the relative retention times of the two samples are 5.21 min and 6.82 min, respectively, which can be well separated from the components to be the subject. Since chlorobenzene has a large residual on the extracted fiber, which affects the quantitative result, cyclohexanone is chosen as the internal standard. The chromatographic data were analyzed by NIST 08 library (National Institute of Standards and Technology, Gaithersburg, MD, USA). A total of 51 volatile compounds were detected during the storage of bovine liver. The names, peak hours, retention indices, and reported articles are shown in . The retention index for 51 volatile compounds from 29 references was basically the same as the retention time obtained in this study.
Table 2. The first-order kinetic exponential equation of carbonyl, TBARS, and POV with storage time at different temperatures.
Table 3. Verification and predicted values of carbonyl, TBA, and POV in validation tests.
Table 4. Volatile compounds identified in headspace of bovine liver.
Table 5. Consumer acceptance of bovine liver paste prepared with bovine liver stored at different temperatures for 10 and 20d, p<0.05.
Bovine liver pastes preparation and consumer acceptance test
A total of 11 different bovine liver pastes were prepared with bovine liver stored for 0, 10, or 20d at −20, −10, 0, 10 or 20℃, and the control (0 d). Bovine liver pastes formula includes bovine liver (100 g), soy protein isolate (3 g), milk powder (3 g), chicken oil (13 g), vegetable oil (13 g), sugar (2 g) and salt (2 g). Bovine liver was crushed by tissue mincing machine (JJ-2, Xinhang Instrument Factory, Jintan City, China), stirred at 1000 r/min for 2 min, then added soy protein isolate, starch, and milk powder, etc. After emulsification by colloid mill (JMS −50, Guantong Machinery Co., Ltd., Langfang City, China). It was placed in a glass bottle of 6 cm in diameter and steamed for 30 min in an induction cooker (WT2116, Midea Induction Cooker, Midea Group Co., Ltd., China), about 90 g per bovine liver paste, and then cooled at room temperature.
Consumers (n = 50, 21 males, 29 females, age 18–55) who don’t have rejection of bovine liver paste were selected to evaluate the prepared bovine liver paste. Until the end of the test, consumers didn’t have any information about the bovine liver paste. The testing was conducted at the animal product processing laboratory of Gansu Agricultural University (Gansu, China). Consumers were asked to use the nine-point hedonism scale to assess the appearance, smell, taste, texture and overall acceptance of the biscuit. In consumer test process, each bovine liver paste was presented in triplicate, and each 3 g was placed in plastic petri dish (5 cm x 5 cm x 2 cm, length x width x height). Randomly number the number below the container and provide it to the consumer. All tests were performed under well-lit conditions. Consumers took a one-minute break before testing the next sample to minimize sensory fatigue. And use lemonade (lemon extract: water 1:100) as a mouth cleaner and then taste each sample.
Statistical analysis
All data were expressed as arithmetic mean standard deviation. ANOVA and linear regression were performed using IBM SPSS 19.0 software, ANOVA, and Duncan multiple test (P < 0.05).
Results and discussion
Analysis of total plate count
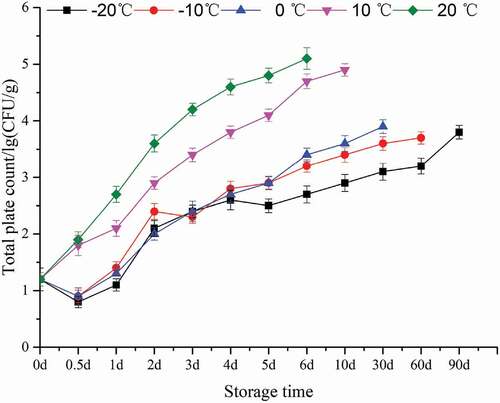
shows the changes in the total plate count of bovine liver under different storage temperature conditions. It can be seen from that when the storage temperature is lower than 0°C, the total plate count decreases first and then increases. When the storage temperature is lower than 0°C, the total plate count continues to increase. This may because some bacteria cannot tolerate low temperature. As the storage time increases, the number of bacteria that are resistant to low temperatures increases. According to Kim[Citation26], the total number of bacteria is less than 1 × 10⁶ during storage, indicating that the bovine liver has not blet.
Figure 1. Change total plate count in bovine liver stored at different temperature (black, −20℃; red, −10℃; blue, 0℃; purple, 10℃; green, 20℃).
Changes in bovine liver quality during storage at different temperatures
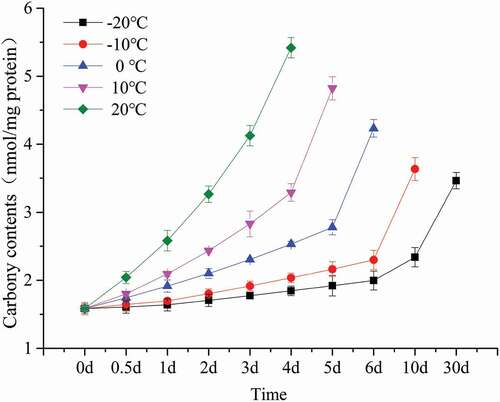
Protein carbonyl content is widely used to assess the degree of oxidation of proteins and is a good indicator of the degree of oxidation of proteins in a sample.[Citation27] According to some references the carbonyl content value of about 8 mg nmol/mg is a limit value.[Citation26] The changes in the carbonyl content of bovine liver at different temperatures are shown in . The initial carbonyl content of bovine liver was 1.584 (nmol/mg protein). The initial carbonyl content of bovine liver was 1.584 (nmol/mg protein). This value is close to the 1.6 (nmol/mg protein) reported by Bwb[Citation28] for beef but higher than the 2.17 (nmol/mg protein) reported by Traore et.al for pig meat.[Citation29] This may be because protein oxidation is affected by animal species, muscle type, and anatomical location.[Citation30] In general, the oxidation of protein in bovine liver decreases as the storage temperature. According to some literature reports[Citation31,Citation32] that protein oxidation in beef and sheep meet persists during refrigeration, and its rate slows as storage temperature decreases, which is similar to the results of this experiment. Protein oxidation affects the physicochemical properties of proteins, which in turn affects the processing characteristics, nutritional value, flavor of meat,[Citation8] and may even harm the health of consumers.[Citation33]
Figure 2. Change of carbonyl contents in bovine liver stored at different temperature (black, −20℃; red, −10℃; blue, 0℃; purple, 10℃; green, 20℃) for 30 days.
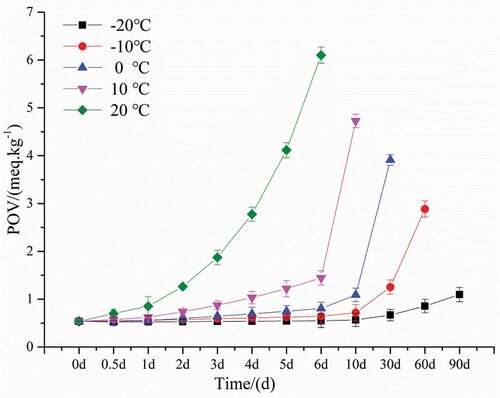
The TBA and POV are two main indicators of lipid oxidation seen in muscle foods.[Citation34] Under refrigerated conditions, the biochemical reactions in meat products are largely slowed down, but fat oxidation is still not negligible.[Citation35] Lipid oxidation is a three-step free radical chain reaction consisting of initiation, propagation, and termination. TBA and POV are produced in the second and third stages of lipid oxidation, respectively.[Citation36] TBA and POV contents of bovine liver at different temperatures are shown in and . The initial and final TBA of bovine liver were 0.7676 and 7.408 (mg MDA/kg). This value is lower than the 1.2 and 12.2 (mg MDA/kg) reported by Shin[Citation37] and the 1.5 and 14.7 (mg MDA/kg) reported by Cui[Citation38] for beef . The initial and final POV of bovine liver were 0.5359 and 6.1019 mg (meq/kg). This value is also lower than some reports[Citation39,Citation40] for beef and sheep meat.The difference in initial and final TBA and POV contents in bovine liver may be due to the type of fat composition and the lower fat content in the bovine liver. The TBA and POV of all bovine livers increased throughout the storage process, possibly due to partial dehydration of the bovine liver and increased oxidation of unsaturated fatty acids.[Citation41] In addition, with the increase of storage temperature, the increase rate of TBA and POV during storage was also higher, indicating that low temperature inhibited the oxidation of lipids.
Figure 3. Change of TBA in bovine liver stored at different temperature (black, −20℃; red, −10℃; blue, 0℃; purple, 10℃; green, 20℃) for 90 days.
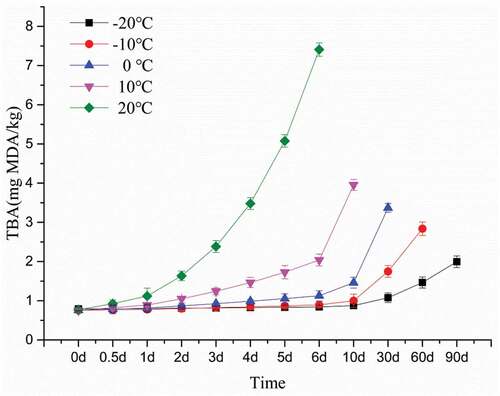
Figure 4. Change of POV in bovine liver stored at different temperature (black, −20℃; red, −10℃; blue, 0℃; purple, 10℃; green, 20℃) for 90 days.
Dynamic model establishment
The oxidation of bovine liver stored at different temperatures was analyzed to determine the reaction sequence. The value of k was obtained from the regression slope of ln [B/B0] over time. shows the first-order equation for the oxidation index value of bovine liver at different temperatures. Through the above analysis, the content for the three kinds of oxidation index content for bovine liver during storage increased with the increase on storage time and rapidly increased at the same temperature increases based on the first-exponential model The rate of increase on the content of the obtained oxidation index described the rate of peroxide formation at different temperatures and the fitting degree of all the equations exceeded 0.97. Therefore, the first-level index model was suitable for evaluating changes in the content of three kinds of oxidation indicators. A quality prediction model for bovine liver during storage at different temperatures was established. The equation of the oxidation index prediction model Eqs. (5), (6) and (7):
Model validation
To verify the three predictive models, the comparison of the predicted and measured values of bovine livers stored at 5°C and 15°C for 5 and 15 days was evaluated. The results showed that the three kinds of prediction models for oxidation index established the real and predicted values for each index content, and the relative errors were within ± 8%. Kaymak-Ertekin & Gedik[Citation42]claimed that a prediction model was acceptable when its relative error was less than 10%. confirms that the Arrhenius kinetic model has a good fit with the carbonyl, TBA, and POV contents in bovine livers and can accurately predict its fixed temperature and specific storage time.
Arrhenius kinetic model is a mathematical method used to describe the relationship between the chemical reaction rate and temperature. The Ea and frequency factor (K0) are used to describe the mechanism of chemical reaction. In general, the lower the activation energy is, the higher the probability of a reaction occurs, and the faster the reaction and the greater the temperature are.[Citation43,Citation44] The slower the reaction is, the higher the Ea is. The frequency factor corresponds to the basic frequency in which the reaction substrates are in contact with each other at a certain contact frequency. The Ea directly determines the probability of substrate contact reaction. Thus, the contact higher than the actual reaction rate frequency is the theoretical maximum chemical reaction rate when the temperature approaches infinity.[Citation45]
Volatile flavor compounds of bovine livers during storage
. shows the relative content of volatile compounds detected in bovine livers at different temperatures and storage time. reports the change in the content of volatile compounds.The volatile compounds in bovine liver include aldehydes, ketones, alcohols, acids, and alkanes. Lorenz et al.[Citation46]analyzed the volatile components of the lamb liver. Many of which were classified as aldehydes, esters, and hydrocarbons. Werkhoff et al.[Citation47] analyzed the volatiles associated with cooked beef liver. In addition to aldehydes, ketones, esters, acids, sulfur-containing compounds include mercaptans, sulfides, thiazoles, and thiofurans. This is basically consistent with this experiment.
Figure 5. Arrhenius curve of rate of change of carbony (A), TBA (B) and POV (C) content.
Figure 6. Heat map representing relative peak area of volatile compounds detected by GC-MS in bovine liver stored at different temperatures and periods (green color means low peak area and red color is high in peak area, relatively).
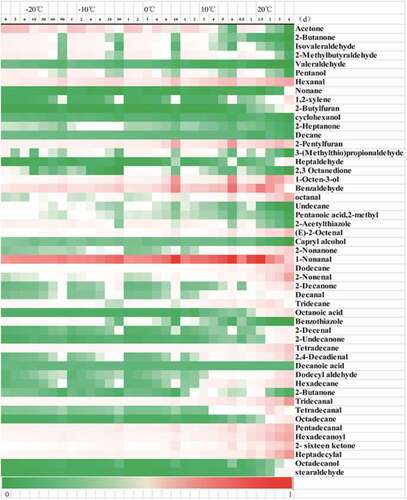
Figure 7. Relative content of different types of volatile compounds in bovine liver at different temperatures during different time (A,-20℃; B,-10℃; C,0℃; D, 10℃; E, 20℃).
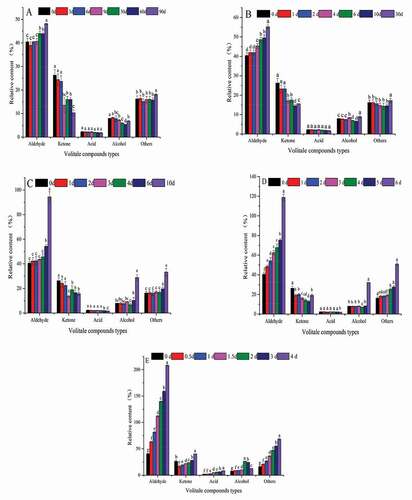
At −20°C, −10°C, 0°C temperature, there was no significant change in the content of volatile compounds in the early stage of storage (p > 0.05), but the flavor content changed significantly with the prolongation of storage time (p<0.05). At 10°C, 20°C, the aldehyde and ketone in the pre-storage period were very significant (p<0.05). Compounds of different flavors of meat are mainly derived from lipid oxidation. Low temperature can delay lipid oxidation, but it does not prevent lipid oxidation, and high temperature promotes lipid oxidation.[Citation48]
Furfural, benzaldehyde, hexanal, and octanal, which have floral notes, almond notes, grassy notes, fruity notes, have higher contents and gradually increase with the growing of oxidation degree. Due to the low odor threshold, aldehyde compounds are the main odor compounds of bovine liver. Especially the relatively high content of small molecular aldehydes contributes more to the flavor of bovine liver.[Citation49] Aldehydes are formed by oxidation of lipids and Strecker degradation of amino acids.[Citation50] Hexanal and octanal are formed by oxidation of n-6 PUFA and n-9 PUFA, respectively.[Citation49,Citation51] Studies have reported that benzaldehyde has a relatively high relative content in the liver and is one of the characteristic aroma contributors to the gonads of crabs.[Citation52,Citation53]
Ketones are derived from amino acid degradation, Maillard reaction, and lipid oxidation.[Citation53] Among the total volatile compounds, ketone content is relatively low, and the ketone compound has a high threshold value. Thus, it contributes little to bovine liver flavor.[Citation53] Acetone, 2-butanone content is higher, and with the increase of oxidation degree, the content formation is reduced. This may be because ketone compounds are important intermediates for the formation of heterocyclic compounds. Ketones are converted to other compounds as oxidation progresses.[Citation54] In this study, as the degree of oxidation increases, ketone content first increases and then decreases. This may be because some ketones are converted to other products in the early stage. Increased ketone content in the late stage due to accumulation of other non-converted ketones.
Alcohols have a higher odor threshold and therefore contribute less to bovine liver aroma, but unsaturated alcohols typically have lower thresholds and may have a greater impact on total odor.[Citation55] As the length of the carbon chain increases, a unique aroma is created. But the contribution to the flavor of the product is still small.[Citation56] In this experiment, pentanol, hexanol, 1-octyl-3-ol, octanol, and octadecyl alcohol were detected. 1-octyl-3-ol has a hay aroma and is a major volatile alcohol for oysters, clams, prawns, and crabs, and is one of the important odor active alcohols. The alcohol content increases and then decreases, which may be because the final alcohol is oxidized to aldehydes and acids.[Citation57]
During the storage process, bovine liver’s flavor compounds also include acids, hydrocarbons, furans, and thiazoles. Acid substances are extremely low, If excessive, there will be a smell of rotten meat.[Citation58] Hydrocarbons are formed by the oxidation of lipid.[Citation59] Hydrocarbons detected in bovine liver can be classified into saturated hydrocarbons and unsaturated hydrocarbons. Due to the high threshold, the flavor of bovine liver aroma has little effect. Yet, some can form heterocyclic compounds.[Citation60] Sulfur-containing compounds generally have an important effect on sample flavor,Benzothiazole and 2-acetylthiazole were found in this study and are ubiquitous in seafood.[Citation61]
In this study, the content of aldehyde in bovine liver is the highest and threshold is low, which is decisive for bovine liver flavor. In the present study, as the storage temperature and time increased, the level of lipid oxidation increased, and when the storage temperature was below 0°C, the increase in aldehyde content during early storage period was not significant(p > 0.05).
Consumer testing
The sensory scoring results of bovine liver paste are shown in . Bovine liver pate made from bovine liver stored at high temperature (10°C or 20°C) received significantly worse (p < 0.05). As the storage temperature increased from −20°C to 0°C, the overall acceptability difference was not significant (p > 0.05), from 0°C to 20°C, the overall acceptability decreased and the difference was significant (p < 0.05), while overall acceptability of bovine liver paste made from bovine liver stored at 0°C for 20 days was significantly reduced (p < 0.05). The bovine liver paste made of bovine liver was stored at 0°C for 20 days, and the overall acceptability was significantly decreased (p < 0.05). A similar trend was found in appearance, smell, taste, and texture. In samples made from bovine liver stored above 0°C, the appearance, smell, taste, and texture were significantly lower than samples stored below 0°C. This indicates that storage of bovine liver above 0°C and storage time above 10 d is the main reason for reducing the sensory quality of bovine liver paste prepared with bovine liver. In this study, not only the effect of storage temperature on the quality of bovine liver was studied, but also the effect of storage temperature on the acceptability of the final product. Sensory scoring results in this study indicate that the sensory quality of the final product can be maintained.
Conclusion
This study reports the quality characteristics of bovine liver during storage and consumer acceptance of its final product (bovine liver paste). The Arrhenius equation was used to establish a quality prediction model by measuring mass changes during different temperatures and storage periods. A predictive model can be used to estimate the shelf life of bovine liver. In addition, consumers do not like bovine liver pate made from bovine liver samples stored at 10°C or 20°C. These results indicate that storing bovine liver below 0°C is ideal for maintaining the quality of the beef liver and its final product.
Additional information
Funding
References
- Ercan, P.; El, S.N. Changes in Content of Coenzyme Q10 in Beef Muscle, Beef Liver and Beef Heart with Cooking and in Vitro digestion[J]. Journal of Food Composition & Analysis. 2011, 24, 1136–1140. DOI: 10.1016/j.jfca.2011.05.002.
- Lai, J.F.; Dobbs, J.; Dunn, M.A. Evaluation of Clams as a Food Source of Iron: Total Iron, Heme Iron, Aluminum, and in Vitro, Iron Bioavailability in Live and Processed Clams[J]. Journal of Food Composition & Analysis. 2012, 25, 47–55. DOI: 10.1016/j.jfca.2011.07.004.
- Nunes, A.M.; Sousa, R.A.D.; Silva, C.S.D. Fast Determination of Fe, Mg, Mn, P and Zn in Meat Samples by Inductively Coupled Plasma Optical Emission Spectrometry after Alkaline solubilization[J]. Journal of Food Composition & Analysis. 2013, 32, 1–5. DOI: 10.1016/j.jfca.2013.08.004.
- Taniguchi, C.N.; Dobbs, J.; Dunn, M.A. Heme Iron, Non-Heme Iron, and Mineral Content of Blood Clams (Anadara, Spp.) Compared to Manila Clams (V. Philippinarum), Pacific Oysters (C. Gigas), and Beef Liver (B. taurus)[J]. Journal of Food Composition & Analysis. 2016, 57, 49-55.
- Mi, J.K.; Han, S.K.; Min, J.L. Quality Predictive Models for Whole Flour of Immature Wheat during Storage and Consumer Acceptance on Its Baked product[J]. LWT - Food Science and Technology. 2017, 83, 42-49.
- Moubarak, A.S.; Johnson, Z.B.; Rosenkrans Jr., C.F. Liver Cytochrome P450 System as Affected by Endophyte-Infected Tall Fescue Seed Extracts and Ergot alkaloids.[J]. Agricultural Sciences. 2012, 3, 1–4. DOI: 10.4236/as.2012.31001.
- Coombs, C.; Holman, B.; Collins, D. Effects of Chilled-Then-Frozen Storage (Up to 52 weeks) on an Indicator of Protein Oxidation and Indices of Protein Degradation in Lamb M. Longissimus lumboruM.[J]. Meat Science. 2017, 135, 134–141. DOI: 10.1016/j.meatsci.2017.09.013.
- Stadtman, E.R.; Levine, R.L. Free Radical-Mediated Oxidation of Free Amino Acids and Amino Acid Residues in proteins.[J]. Amino Acids. 2003, 25, 207–218. DOI: 10.1007/s00726-003-0011-2.
- Lund, M. N.; Heinonen, M.; Baron, C. P.; Estévez, M. Protein Oxidation in Muscle Foods: a Review. Molecular Nutrition & Food Research. 2011, 55(1),83-95. doi:10.1002/mnfr.v55.1
- Fuentes, V.; Ventana, J.; Morcuende, D. Lipid and Protein Oxidation and Sensory Properties of Vacuum-Packaged Dry-Cured Ham Subjected to High Hydrostatic pressure.[J]. Meat Science. 2010, 85, 506–514. DOI: 10.1016/j.meatsci.2010.02.024.
- Hofmann, K.; Hamm, R. Sulfhydryl and Disulfide Groups in meats.[J]. Advances in Food Research. 1978, 24, 1–111.
- Park, D.; Xiong, Y.L.; Alderton, A.L.; Ooizumi, T. Biochemical Changes in Myofibrillar Protein Isolates Exposed to Three Oxidizing Systems. Journal Agriculture Food Chemistry. 2006, 54, 4445–4451. DOI: 10.1021/jf0531813.
- Berardo, A.; Claeys, E.; Vossen, E. Protein Oxidation Affects Proteolysis in a Meat Model system[J]. Meat Science. 2015, 106, 78–84. DOI: 10.1016/j.meatsci.2015.04.002.
- Papuc, C.;. Goran; Gheorghe, V; Corina, N. Mechanisms of Oxidative Processes in Meat and Toxicity Induced by Postprandial Degradation Products: A Review[J]. Comprehensive Reviews in Food Science and Food Safety. 2016, 16, 98-123.
- Giménez, B.; Gómez-Guillén, M.C.; Pérez-Mateos, M. Evaluation of Lipid Oxidation in Horse Mackerel Patties Covered with Borage-Containing Film during Frozen Storage. Food Chemistry. 2011, 124, 1393–1403. DOI: 10.1016/j.foodchem.2010.07.097.
- Ganje, M.; Jafari, S.M.; Dusti, A. Modeling Quality Changes in Tomato Paste Containing Microencapsulated Olive Leaf Extract by Accelerated Shelf Life testing[J]. Food & Bioproducts Processing. 2016, 97, 12–19. DOI: 10.1016/j.fbp.2015.10.002.
- Tsironi, T.; Stamatiou, A.; Giannglou, M. Predictive Modelling and Selection of Time Temperature Integrators for Monitoring the Shelf Life of Modified Atmosphere Packed Gilthead Seabream fillets[J]. LWT - Food Science and Technology. 2011, 44, 1156–1163. DOI: 10.1016/j.lwt.2010.10.016.
- Gupta, S.; Cox, S.; Abu-Ghannam, N. Effect of Different Drying Temperatures on the Moisture and Phytochemical Constituents of Edible Irish Brown seaweed[J]. LWT - Food Science and Technology. 2011, 44, 1266–1272. DOI: 10.1016/j.lwt.2010.12.022.
- Cárdenas, F.C.; Giannuzzi, L.; Zaritzky, N.E. Mathematical Modelling of Microbial Growth in Ground Beef from Argentina. Effect of Lactic Acid Addition, Temperature and Packaging film.[J]. Meat Science. 2008, 79, 509–520. DOI: 10.1016/j.meatsci.2007.12.003.
- Fan, W.; Zhang, Y.; Chen, Y. TBARS Predictive Models of Pork Sausages Stored at Different temperatures[J]. Meat Science. 2014, 96, 1–4. DOI: 10.1016/j.meatsci.2013.06.025.
- ISO 2293:1988 Meat and meat products. Enumeration of Microorganisms. Colony count technique at 30 degrees C.
- Oliver, C.N.; Ahn, B.W.; Moerman, E.J. Age-Related Changes in Oxidized proteins.[J]. Journal of Biological Chemistry. 1987, 262, 5488.
- Erkan, N.; Özkan, Ö. Quality Assessment of Whole and Gutted Sardines (Sardina Pilchardus) Stored in Ice. International Journal of Food Science & Technology. 2008, 43(9), 1549–1559. DOI: 10.1111/j.1365-2621.2007.01579.x.
- Shi, J.; Zhang, L.; Lu, H.; Shen, H.; Yu, X.; Luo, Y. Protein and Lipid Changes of Mud Shrimp (Solenocera Melantho) during Frozen Storage: Chemical Properties and Their Prediction. International Journal of Food Properties. 2017, 20, 1–14.
- Giannakourou, M.C.; Taoukis, P.S. Kinetic Modelling of Vitamin C Loss in Frozen Green Vegetables under Variable Storage conditions[J]. Food Chemistry. 2003, 83, 33–41. DOI: 10.1016/S0308-8146(03)00033-5.
- Kim, G.D.; Jung, E.Y.; Lim, H.J.; Yang, H.S.; Joo, S.T.; Jeong, J.Y. Influence of Meat Exudates on the Quality Characteristics of Fresh and Freeze-Thawed Pork. Meat Science. 2013, 95(2), 323–329. DOI: 10.1016/j.meatsci.2013.05.007.
- Guyon, C.; Vessel, V.L.; Meynier, A.; Lamballerie, M.D. Modifications of Protein-Related Compounds of Beef Minced Meat Treated by High Pressure. Meat Science. 2018, 142, 32-37.
- Bwb, H.; Ceo, C.; Morris, S.; Kerr, M.J.; Hopkins, D.L. Effect of Long Term Chilled (Up to 5 Weeks) Then Frozen (Up to 12 Months) Storage at Two Different Sub-Zero Holding Temperatures on Beef: 3. Protein Structure Degradation and a Marker of Protein Oxidation. Meat Science. 2018, 139, 171. DOI: 10.1016/j.meatsci.2018.01.028.
- Traore, S.; Aubry, L.; Gatellier, P.; Przybylski, W.; Jaworska, D.; Kajak-Siemaszko, K. Effect of Heat Treatment on Protein Oxidation in Pig Meat. Meat Science. 2012, 91(1), 14–21. DOI: 10.1016/j.meatsci.2011.11.037.
- Min, B.R.; Nam, K.C.; Cordray, J.C.; Ahn, D.U. Factors Affecting Oxidative Stability of Pork, Beef, and Chicken Meat. Animal Industry Report. 2008, 11(5), 103-115.
- Hopkins, D.L.; Thompson, J.M. Factors Contributing to Proteolysis and Disruption of Myofibrillar Proteins and the Impact on Tenderisation in Beef and Sheep Meat. Australian Journal of Agricultural Research. 2002, 53(2), 149–166. DOI: 10.1071/AR01079.
- Lomiwes, D.; Farouk, M.M.; Wiklund, E.; Young, O.A. Small Heat Shock Proteins and Their Role in Meat Tenderness: A Review. Meat Science. 2014, 96(1), 26–40. DOI: 10.1016/j.meatsci.2013.06.008.
- Soladoye, O.P.; Juárez, M.L.; Aalhus, J.L.; Shand, P.; Estévez, M. Protein Oxidation in Processed Meat: Mechanisms and Potential Implications on Human Health. Comprehensive Reviews in Food Science & Food Safety. 2015, 14(2), 106–122. DOI: 10.1111/crf3.2015.14.issue-2.
- Turgut, S.S.; Işıkçı, F.; Soyer, A. Antioxidant Activity of Pomegranate Peel Extract on Lipid and Protein Oxidation in Beef Meatballs during Frozen Storage. Meat Science. 2017, 129, 111–119. DOI: 10.1016/j.meatsci.2017.02.019.
- Soyer, A.; Özalp, B.; Dalmış, U.; Bi̇Lgi̇N, V. (2010). Effects of Freezing Temperature and Duration of Frozen Storage on Lipid and Protein Oxidation in Chicken Meat. Food Chemistry. 2010, 120(4), 1025–1030. DOI: 10.1016/j.foodchem.2009.11.042.
- Li, T.; Li, J.; Hu, W.; Zhang, X.; Li, X.; Zhao, J. Shelf-Life Extension of Crucian Carp (Carassius Auratus) Using Natural Preservatives during Chilled Storage. Food Chemistry. 2012, 135(1), 140–145. DOI: 10.1016/j.foodchem.2012.04.115.
- Shin, S.H.; Chang, Y.; Lacroix, M.; Han, J. Control of Microbial Growth and Lipid Oxidation on Beef Product Using an Apple Peel-Based Edible Coating Treatment. LWT- Food Science and Technology. 2017, 84, 183-188.
- Cui, L.; Fan, J.; Sun, Y.; Zhu, Z.; Yi, J. The Prooxidant Activity of Salts on the Lipid Oxidation of Lecithin-Stabilized Oil-In-Water Emulsions. Food Chemistry. 2018, 252(4), 28–32. DOI: 10.1016/j.foodchem.2018.01.094.
- Santas, J.; Guzmán, Y.J.; Guardiola, F.; Rafecas, M.; Bou, R. High-Throughput Analysis of Lipid Hydroperoxides in Edible Oils and Fats Using the Fluorescent Reagent Diphenyl-1-Pyrenylphosphine. Food Chemistry. 2014, 162(11), 235–241. DOI: 10.1016/j.foodchem.2014.04.059.
- Ponnampalam, E.N.; Plozza, T.; Kerr, M.G.; Linden, N.; Mitchell, M.; Bekhit, A.E. Interaction of Diet and Long Ageing Period on Lipid Oxidation and Colour Stability of Lamb Meat. Meat Science. 2017, 129, 43. DOI: 10.1016/j.meatsci.2017.02.008.
- Mendes, R.; Pestana, C.; Gonçalves, A. The Effects of Soluble Gas Stabilisation on the Quality of Packed Sardine Fillets (Sardina Pilchardus) Stored in Air, Vp and Map. International Journal of Food Science & Technology. 2008, 43(11), 2000–2009. DOI: 10.1111/j.1365-2621.2008.01809.x.
- Kaymak-Ertekin, F.; Gedik, A. Kinetic Modelling of Quality Deterioration in Onions during Drying and storage[J]. Journal of Food Engineering. 2005, 68, 443–453. DOI: 10.1016/j.jfoodeng.2004.06.022.
- Topuz, A.;. A Novel Approach for Color Degradation Kinetics of Paprika as A Function of Water activity[J]. LWT - Food Science and Technology. 2008, 41, 1672–1677. DOI: 10.1016/j.lwt.2007.10.004.
- Gou, P.; Comaposada, J.; Arnau, J. NaCl Content and Temperature Effects on Moisture Diffusivity in the Gluteus Medius Muscle of Pork ham[J]. Meat Science. 2003, 63, 29–34.
- Robe, G.H.; Xiong, Y.L. Kinetic Studies of the Effect of Muscle Fiber Type and Tripolyphosphate on the Aggregation of Porcine Salt-Soluble Proteins [J]. Meat Science. 1994, 37, 55. DOI: 10.1016/0309-1740(94)90145-7.
- Lorenz, G.; Stern, D.J.; Flath, R.A.; Haddon, W.F.; Tillin, S.J.; Teranishi, R. Identification of Sheep Liver Volatiles. Journal Agriculture Food Chemistry. 1983, 31(5), 1052–1057. DOI: 10.1021/jf00119a033.
- Werkhoff, P.; Bruning, J.; Gntert, J.; Kaulen, J.; Krammer, G.; Sommer, H. Potent Mercapto-Methylthio-Substituted Aldehydes and Ketones in Cooked Beef Liver. Advances in Food Sciences. 1996, 10(7), 123-125.
- Mottram, D.S.;. The Effect of Cooking Conditions on the Formation of Volatile Heterocyclic Compounds in Pork. Journal of the Science of Food & Agriculture. 1985, 36(5), 377–382. DOI: 10.1002/(ISSN)1097-0010.
- Tanimoto, S.; Kitabayashi, K.; Fukusima, C.; Sugiyama, S.; Hashimoto, T. Effect of Storage Period before Reheating on the Volatile Compound Composition and Lipid Oxidation of Steamed Meat of Yellowtail Seriola, Quinqueradiata. Fisheries Science. 2015, 81(6), 1145–1155. DOI: 10.1007/s12562-015-0921-4.
- Watanabe, A.; Kamada, G.; Imanari, M.; Shiba, N.; Yonai, M.; Muramoto, T. Effect of Aging on Volatile Compounds in Cooked Beef. Meat Science. 2015, 107, 12–19. DOI: 10.1016/j.meatsci.2015.04.004.
- Wang, Y.; Jiang, Y.T.; Cao, J.X.; Chen, Y.J.; Sun, Y.Y.; Zeng, X.Q. Study on Lipolysis-Oxidation and Volatile Flavour Compounds of Dry-Cured Goose with Different Curing Salt Content during Production. Food Chemistry. 2016, 190, 33–40.
- Gu, S.Q.; Wang, X.C.; Tao, N.P.; Wu, N. Characterization of Volatile Compounds in Different Edible Parts of Steamed Chinese Mitten Crab (Eriocheir Sinensis). Food Research International. 2013, 54(1), 81–92. DOI: 10.1016/j.foodres.2013.05.018.
- Zhuang, K.; Wu, N.; Wang, X.; Wu, X.; Wang, S.; Long, X. Effects of 3 Feeding Modes on the Volatile and Nonvolatile Compounds in the Edible Tissues of Female Chinese Mitten Crab (Eriocheir Sinensis). Journal of Food Science. 2016, 81(4), S968–S981. DOI: 10.1111/1750-3841.13229.
- Hou, M.; Liu, D.; Xu, X.; Zhou, G.; Li, C. Effect of Postmortem Aging Time on Flavor Profile of Stewed Pork Rib Broth. International Journal of Food Properties. 2018, 21(1), 1449–1462. DOI: 10.1080/10942912.2018.1479859.
- Selli, S.; Rannou, C.; Prost, C.; Robin, J.; Serot, T. Characterization of Aroma-Active Compounds in Rainbow Trout (Oncorhynchus Mykiss) Eliciting an Off-Odor. Journal of Agricultural & Food Chemistry. 2009, 54(25), 9496.
- Girard, B.; Durance, T. Headspace Volatiles of Sockeye and Pink Salmon as Affected by Retort Process. Journal of Food Science. 2010, 65(1), 34–39. DOI: 10.1111/j.1365-2621.2000.tb15952.x.
- Zou, Y.; Kang, D.; Liu, R.; Qi, J.; Zhou, G.; Zhang, W. Effects of Ultrasonic Assisted Cooking on the Chemical Profiles of Taste and Flavor of Spiced Beef. Ultrasonics Sonochemistry. 2018, 46, 36–46.
- Zhou, J.; Han, Y.; Zhuang, H.; Feng, T.; Xu, B. Influence of the Type of Extraction Conditions and Fiber Coating on the Meat of Sauced Duck Neck Volatile Compounds Extracted by Solid-Phase Microextraction (Spme). Food Analytical Methods. 2015, 8(7), 1661–1672. DOI: 10.1007/s12161-014-0049-7.
- Qi, J.; Liu, D.; Zhou, G.; Xu, X. Characteristic Flavor of Traditional Soup Made by Stewing Chinese Yellow-Feather Chickens. Journal of Food Science. 2017, 82, 5. DOI: 10.1111/1750-3841.13801.
- Ventanas, S.; Mustonen, S.; Puolanne, E.; Tuorila, H. Odour and Flavour Perception in Flavoured Model Systems: Influence of Sodium Chloride, Umami Compounds and Serving Temperature. Food Quality & Preference. 2010, 21(5), 453–462. DOI: 10.1016/j.foodqual.2009.11.003.
- Wu, N.; Gu, S.; Tao, N.; Wang, X.; Ji, S. Characterization of Important Odorants in Steamed Male Chinese Mitten Crab (Eriocheir Sinensis) Using Gas Chromatography-Mass Spectrometry-Olfactometry. Journal of Food Science. 2014, 79(7), 1250–1259. DOI: 10.1111/1750-3841.12511.