
ABSTRACT
The present study was designed to investigate the consumer preference and the quality attributes of five brands of Chinese traditional first-grade fava pastes, following which their quality differences were evaluated in order to identify the key drivers or factors, which can be applied to explain the behavior of consumer preferences. Consumers ranked these samples based on the 9-point method. An obvious preference for sample P1 was observed with 35% of participants settling on extremely liked option, giving the said sample the highest overall preference score of 7.8 ± 0.2. Further sensory and physicochemical properties, and volatiles were conducted to identify the major drivers of the consumer behavior. Sensory evaluation showed that sample P1 also produced the highest overall sensory score (85 ± 3). Though all the samples exhibited similar physicochemical attributes, significant differences were observed in the species and the concentration of volatile compounds. Accordingly, the content of free amino acids (FAAs) and low-molecular-weight (MW) fraction (≤5 kDa) represented the trend that fell in line with sensory score. PLS2 correlation analysis indicated that physicochemical indices and volatiles could be used to explain the consumer preference, which was likely to be synergistically affected by FAAs, protein, amino nitrogen, dietary fiber, Ca, P, Fe, δ-Ε, and some volatiles, especially the positive drivers of FAAs and low MW proportion to sample P1. The work would not only provide valuable information for grading of fava pastes in the industry but also guide actual producing toward the expectation of consumers, especially increasing those positive drivers.
Introduction
Fava paste, also known as Pixian broad bean paste, is made from fava (or broad bean), chili, salt, and wheat flour. It is a vital ingredient in many of the famous Sichuan dishes and usually referred to as “the soul of Sichuan cuisine” by many consumers due to its unique flavor.[Citation1,Citation2] Generally, fava paste is manufactured through two steps including “qu making” (boiling the broad to soften it and mixing with wheat flour) with Aspergillus oryzae as starter culture and brine fermentation.[Citation3,Citation4]
Nowadays, only a few published studies had been conducted about fava pastes, which involved isolation and identification of strains,[Citation4] bacterial community succession and metabolite changes during fermentation.[Citation1,Citation3] Substantial number of researches reports on similar fermented soybean-foods such as Cheonggukjang, Doenjang, Gochujang, and soy sauce[Citation5,Citation6] in Korean, natto,[Citation7] miso[Citation8] and fish sauces[Citation9] in Japan, Dajiang, Douchi,[Citation10] sufu,[Citation11–Citation15] Tauchu, and yellow soybean paste [Citation16,Citation17] in China are available. However, these studies mainly focused on aroma components,[Citation6,Citation18,Citation19] functional properties[Citation8,Citation20–Citation22] and taste characteristics[Citation23–Citation25] with less emphases on consumer preference evaluation.
When it comes to the consumer market of fava pastes, the majority of consumers have obvious preference of one or two brands in various similar products probably due to their distinct intrinsic physicochemical properties, which positively impact on the overall organoleptic properties to positively influence the consumer behavior. Generally, food quality is considered to be an important factor for consumer choices. It is framed in terms of their perceived quality expectations at point of purchase and actual quality and organoleptic experience after consumption. Previous works have investigated the consumer acceptability of newly developed “gochujang” products.[Citation26] However, no study had been carried out about the relations between consumer preference and quality attributes of fava pastes so far. Therefore, the objective of this study was to investigate the quality attributes of five first-grade traditional fava pastes based on sensory characteristics, physicochemical properties, and volatile flavor components. To identify the key factors influencing the consumer choice or preference behavior of these commercial products, quality distinctions or variation were further evaluated in this study.
Materials and methods
Materials
Five traditional first-grade fava pastes, including P1, P2, P3, P4, and P5, were commercially obtained from a local supermarket. All the samples were locally produced by five local manufacturing producers in Pixian, Chengdu, China, and all samples possessed the same production date and the same storing way in order to minimize possible variations due to external factors. The samples were stored at 4°C for not more than 1 week after post-purchase to keep the consistent quality. Chromatographic grade analytical chemicals including 1, 2-dichlorobenzene and n-alkanes (C8-C20) were purchased from Sigma-Aldrich Trading Co., Ltd. (Shanghai, China). All other chemicals were of analytical reagent grade and purchased from Chengdu Kelong Chemical Reagent Factory (Chengdu, China).
Consumer investigation
Consumers of fermented fava pastes comprising equal number of males and females (n = 100) were recruited in local residents according to their willingness to participate in the study. Paper-and-pencil questionnaires were administered to participants. Sample preparation and serving procedures for consumer testing based on the previously reported method for serving “doenjang” in the sensory analysis were adopted.[Citation27–Citation29] It mainly questioned about the preference of five different fermented fava pastes by choosing “liked extremely” and “extremely disliked” from the five products mentioned above. Meanwhile, the participants were asked to rank the overall liking for samples using a 9-point intensity scale (0: none; 9: strong).[Citation30] The order of sample presentation was randomized and determined by a sensory data collection program. Filtered water was used as palate cleansers. The panelists consumed each sample using a small spoon and were asked to expectorate the samples into the spit cup provided. In order to prevent sensory fatigue, the participants took a 5-min mandatory rest following evaluation of each sample.
Sensory evaluation
The sensory panelists were strictly selected and trained. Initially, 40 volunteers (Food Science and College Laboratory at Xihua University, China) were prescreened using questionnaires to evaluate their health status, enthusiasm level, and availability.[Citation31] All participants had previously consumed fava pastes and were familiar with it. They were first screened for their abilities to discriminate among the five basic tastes and five odors by matching tests as well as ranking tests. [Citation15,Citation31] After the series of screenings, 20 candidates (10 males and 10 females with an age range of 20–40 years) were chosen as panelists and were then provided with four 3-h training sessions, in which they were introduced to the terminologies, references, and rating scales to be used in the analysis. There was no consistent criteria in fava pastes industries, so the final sensory standards referred to other similar fermented foods such as sufu,[Citation32] cheese,[Citation33,Citation34] and soy sauce.[Citation35]
For sample preparation, samples were taken from the refrigerator and kept at room temperature (20–22°C) for 1 h prior before the experiments. Five samples were picked out from individual PET transparent plastic package and mashed into slurry with a glass pestle and mortar to ensure the homogeneity and so minimize experimental error. Five grams of each sample was placed into transparent glasses. First, the appearance and color of samples were observed directly. Then, another 0.5 g of sample was placed into a plastic spoon and served to the panelists. The panelists were instructed to put all samples into their mouth for the aroma and texture evaluation to minimize the variation caused from the amount of sample placed in the mouth. The panelists rated each sample on a scale of 1–100 for four evaluation attributes (). Each sample was repeated three times. Finally, the overall scores were obtained based on a linear function of the scores for the four palatability attributes.[Citation36] The experimental samples were evaluated over 2 weeks, during which three sessions were held per day, with a 3-h break between the sessions. During the sensory evaluation, samples were detected by other indices.
Table 1. Definition and reference standards of fava paste taste, aroma, color, and appearance used for sensory evaluation.
overall score = 0.4× taste score+ 0.3× aroma score+ 0.15× color score+ 0.15× appearance score
Physicochemical determination
The pH level of the supernatant was measured using a pH meter, and total acidity was calculated by acid–base titration.[Citation37] Amino-type nitrogen was measured by the formal titration method.[Citation37,Citation38] The contents of water in samples were determined by direct drying method. Crude fat, protein contents, salinity, dietary fiber, ash were measured according to AOAC methods[Citation37,Citation39] in order to determine other physicochemical indices. The qualitative and quantitative determinations of vitamin B (VB) were conducted by using reversed-phase high-performance liquid chromatography (Waters Alliance e2695 USA) coupled with a fluorescence detector. The sample was hydrolyzed by dilute hydrochloric acid environment at room temperature (25°C), adjusted to pH 6.0–6.5, and digested with papain and peak amylase. The analytical column was Galaksil® EF C18M (column length: 250 mm, inner diameter: 4.6 mm, particle size: 5 μm, obtained from Wuxi Galek Chromatography Technology Co., Ltd.). The chromatographic conditions were set as follows: the column temperature was at 30°C, and the mobile phase was sodium acetate solution (0.05 mol/L)–methanol (65:35). The flow rate was set as 1 mL/min. The excitation wavelength was chosen 462 nm while the emission wavelength was 522 nm. The injection volume was 20 μL. For Vitamin E (VE) determination, C30 reversed-phase liquid chromatography coupled with ultraviolet detector was used. Vitamin E was saponified (the starch was first hydrolyzed with amylase), extracted, purified, and concentrated. The concentration was analyzed by Waters C30 column (column length: 250 mm, inner diameter: 4.6 mm, particle size: 3 μm (Waters Corporation of the United States) with column temperature of 20°C and isocratic gradient elution; water was chosen as the mobile phase A while B was methanol. The flow rate was controlled at 0.8 mL/min. The ultraviolet detection wavelength was 294 nm and the injection volume was 10 μL. Both of the quantitative analyses of VE and VB2 were carried out by using an external standard method. Trace elements such as calcium (Ca), potassium (K) and sodium (Na), ferrum (Fe) were determined using flame atomic absorption spectrometry method. After being digested, the preprocessed solution was injected into an atomic absorption spectrometer (AA6800F) and was further atomized by flame atomic absorption spectrometer (Shimadzu Corporation Unico, Shanghai Instrument Co., Ltd). Calcium (it was previously added release agent), iron, potassium, and sodium absorbed resonance lines with wavelength of 422.7, 248.3, 766.5, 589.0 nm, respectively. Within a certain range of concentration, their absorption values were proportional to their contents, thus they can be accurately quantified by comparing with a series of standards. The parameter of the device was set as follows: the slit size was 0.5 nm. The filament current was adjusted to 5–15 mA. The height of combustion was 3 mm. The airflow rate was 9 mL/min while acetylene was 2 mL/min. Phosphorus (P) was determined using molybdenum blue spectrophotometry, which was based on the fact that phosphorus was combined with ammonium molybdate under acidic conditions to form ammonium phosphomolybdate. The compound was reduced to hydroquinone blue compound by sodium sulfite, whose absorbance value at 660 nm was proportional to the concentration of phosphorus. Thus, the absorbance of the sample solution was measured by a spectrophotometer and compared with different standard concentrations to quantify.
Determination of free amino acids (FAAs) and molecular weight (MW) distribution of peptides
FAAs and MW distribution of peptides in the samples were estimated according to the method reported by Liu et al.[Citation40]
Identification of volatile flavor compounds
FAAs and MW distribution of peptides in the samples were estimated according to the method reported by Liu et al.[Citation40] A Likens–Nickerson type SDE apparatus (model 523010–000, Kontes, NJ) was used to extract the volatile compounds. Dichloromethane was used as a solvent. Sample extraction and analysis referred to the methods reported by Lee and Ahn.[Citation6] The concentrated extract was stored at −20 until further analysis was performed. Before determination, 1,2-dichlorobenzene was used as an internal standard (500 μg/mL in methanol) and 1 μL internal standard was added to each extraction. Then, 1 μL mixture was injected into the Gas Chromatography-Mass Spectrometer (GC-MS) system for volatiles' analysis.
Analysis of the volatiles was performed using the Shimadzu GC-MS system. Volatiles were separated by DB-5MS column (30 m × 0.25 mm× 0.25 μm, Supelco, Bellefonte, Pennsylvania, USA), with helium as the carrier gas (flow rate of 1.0 mL/min). The injector and detector temperatures were at 250°C. The oven temperature was set at 35°C and held for 3 min, raised to 50°Cat a rate of 3°C/min and then raised to 150°C at a rate of 6°C/min and held at 230°C for 6 min. The split ratio was 20:1, and the solvent delay was 2 min. Ionization energy was 70 eV, and the range of MW scanned was 33–450 amu. The mass spectrometer was operated in full scan mode. Compound identification and semi-quantification were conducted according to the method reported by previous researches.[Citation41–Citation43]
Statistical analysis
All experiments were performed in triplicate, and the data were expressed as the mean value ± standard deviation. One-way ANOVA evaluating the significance of differences (Student–Newman–Keuls test, p = 0.05) was conducted by using the SPSS 19.0 software package (SPSS Statistics, Chicago, IL, USA). Partial least square regression (PLSR) was used to perform correlation analysis and establish the model of PLS2 through UNSCRAMBLER 9.7 (CAMO ASA, Oslo, Norway).
Results and discussion
Consumer investigation and sensory characteristic of fermented fava pastes
All questionnaires were fully validated prior to the study. The results of the preference included in the consumer questionnaire are shown in . Among the five tested sample, 35% of participants in consumer investigation extremely liked sample P1 in comparison with the other products, followed by P5 (21%), P4 (20%), P3 (13%), and P2 (11%). In the “extremely disliked sample” expedition, a total of 37 people showed an obvious trend of disliking sample P2, while 24, 21, 12, and 6 people were on record to dislike samples P3, P4, P5, and P1, respectively. The overall liking presented the same trend as noted in the rankings obtained from “liked extremely” evaluation, which also was observed in the overall score of sensory evaluation as stated (). Sample P1 and P2 showed the highest and lowest overall scores of 85 and 61, respectively. Due to strong aroma and delicious umami taste notes of sample P1, it was the most popular sample brand among all the samples studied.
Figure 1. Consumer preference and overall liking score of the five fermented fava pastes. The x-axis represents the five traditional fava pastes samples mentioned in this work. The y-axis in the left represents the overall liking of consumer, while the y-axis in the right represents the percentages of “liked extremely” and “extremely disliked” obtained from consumer investigation. All experiments repeated three times. Different superscript letters in overall liking bar denote significant difference (p = 0.05) among the five tested samples.
Figure 2. Sensory score of the five tested fava pastes.
One-way ANOVA revealed that the tested samples showed no significant differences in aroma, color, and appearance attribute among the five samples (p < 0.05), but significant differences occurred in taste property and the calculative overall score especially when sample P1 and the other products were juxtaposed. The intensity of taste attribute of P1, with an average value of 86, was greatly distinguished from other samples (p < 0.05). Saltiness and umami were the major taste properties detected in the five samples, which was greatly related to the palatability of the fava pastes.
Physicochemical analysis
The main constituents of the five fava pastes are shown in . The concentrations of moisture, ash, and salt presented higher values over 18.0 g/100 g compared with the other physicochemical properties such as fat, total acid, and amino nitrogen, which all recorded values below 3.0 g/100 g (aand 3b). The water content ranged between 51.0 and 55.6 g/100 g, with sample P3 registering the lowest value of 51.0 g/100 g. Sample P1 had moderate protein content (7.1 g/100 g), while sample P5 and sample P2 showed the highest and lowest protein content of 7.7 and 5.4 g/100 g, respectively. There was no significant difference among all samples except P2 as far as protein content was concerned. In relation to crude fat content of the studied samples, values were between 1.17 and 1.94 g/100 g, with highest and the lowest values of 1.94 and 1.17 g/100 g were observed, respectively, in samples P2 and P3. Dietary fiber, regarded as one of the main components of the raw material, had values occurring in the range of 4.0/100–5.7g/100 g. The highest concentration of dietary fiber (5.8 ± 0.4 g/100 g) was noted in sample P3, while least value (4.0 ± 0.2 g/100 g) occurred in sample P4. For sample P1, sample P3 and sample P5 almost similar dietary values were recorded. The ash and salt content were at a range of 20.5–23.3 and 18.6–22.1 g/100 g, respectively. Samples P1 and P2 presented the lowest and highest ash content, and there was no significant difference in salt content among samples. For total acid content values ranged between 0.74 and 1.30 g/100 g, with samples P2 and P3 presenting higher value than other samples. The amino nitrogen content was between 0.22 and 0.32 g/100 g, and sample P2 showed lower amino-type nitrogen content than that of the other samples.
Figure 3. The contents of main constituent of five fava pastes. (a) The main compounds of the concentration above 18.0 g/100 g, including water, ash, salt, protein, and dietary fiber. (b) The main compounds of the concentration below 3.0 g/100 g, including fat, total acid, and amino nitrogen. All experiments repeated three times. Error bars represent 95% confidence intervals. Different letter superscripts in the same indicators denote significant difference (p = 0.05).
VB2, α-Ε, γ-Ε, δ-Ε were determined in all fava pastes, and the results are displayed in . There was no significant difference among the five samples when VB2, which ranged from 0.14 to 0.19 mg/100 g, were compared. Similar phenomenon was noted in the content of α-Ε. Significant difference was observed in the case of δ-Ε. The content of δ-Ε in P1 was 0.40 mg/100 g, which was higher than the values recorded in the other samples. Meanwhile, the content of total VE ranged from 3.72 to 7.25 mg/100 g in all different products with sample P3 recording the highest value in comparison with other fava pastes.
Figure 4. Vitamin contents of the five tested fava pastes, including VB2, α-E, γ-E, δ-E, and total VE. All experiments repeated three times. Error bars represent 95% confidence intervals. Different letter superscripts in the same indicators denote significant difference (p = 0.05).
Displayed in are the results of mineral analysis, where samples P1 and P5 were noted to be carriers of highest level of Ca and Fe. Sample P1 showed the highest concentration of Ca (15.9 mg/100 g), followed by P5 (14.6 mg/100 g). Apart from P2 brand, which had Fe value of 4.2 mg/100 g, all the other samples had their Fe concentration values within 6.6–8.6 mg/100 g. While sample P5 yielded 13.7 and 601 mg/100 g as the highest concentrations of P and K, respectively, sample P2 recorded 10.2 and 478.21 mg/100 g as the lowest values of P and K, respectively. Due to the use of salt as a preservative in the preservation process, there was a consequential effect, causing Na content to be highest among the mineral element analyzed in all the five pastes with the range of 7323–8687 mg/100 g. And sample P1 presented the lowest concentration of salt, which was probably caused by a few reasons such as the different proportions of fava beans and chillies, or their different concentrations of 18% (w/w) in fava beans and 13% (w/w) in chillies.
Figure 5. Contents of the dominant mineral element detected in the five fava pastes, including K, Na, Ca, P, and Fe. Error bars represent 95% confidence intervals. All experiments repeated three times. Different letter superscripts in the same indicators denote significant difference (p = 0.05).
FAAs analysis
A total of 17 amino acids detected in the five pastes are shown in . The total FAA contents were not significantly different in all samples except sample P2. The concentration range of the total FAAs was 1464–1848 mg/100 g. Highest value of total FAAs (1848 mg/100 g) occurred in sample P1, followed by P5, P4, P3, while sample P2 had the lowest value (1464 mg/100 g).
Table 2. Free amino acids (FAAs) profile of the five tested fava pastes.
Asp, Glu, Arg, and Leu were the dominant FAAs detected in the five pastes accounting for 46.30%, 44.66%, 45.01%, 44.78%, and 43.78% of the total FAA in P1, P2, P3, P4, and P5, respectively. Glu was previously reported as the main component of amino acid in food protein hydrolysates such as chicken protein and soybean protein.[Citation20,Citation44–Citation46] Among the four main FAAs, the Glu and Asp concentration was greatest in all the five pastes, and were both significantly higher in sample P1 compared with the other samples. FAAs in natural food were important taste contributors and almost all amino acids could elicit taste.[Citation47] Thus, all FAAs determined were divided into the followed three categories[Citation47–Citation49]: umami-taste active acids, sweet-taste active acids, and bitter-taste active acids.
First, umami-taste active amino acids were the other dominant component of the total FAAs in five pastes, including Asp and Glu, which were umami-taste active substances. Their total contents accounted for 29.40%, 27.81%, 27.49%, 26.82%, and 26.32% of the total FAA in P1, P2, P3, P4, and P5, respectively. Meanwhile, sample P1 presented the highest total umami-taste active amino acid content of 543 mg/100 g, followed by P5 (467 mg/100 g) and the lowest value occurring (407 mg/100 g) in P2.
Second, sweet-taste active amino acids were the richest amino acids accounting for 31.53%, 33.52%, 32.95%, 32.70%, and 33.16% respectively in P1, P2, P3, P4, and P5. The common sweet-taste active acids included Ala, Gly, Ser, Thr, Pro, and Lys. The range of the concentration of sweet-taste active acids was 491–589 mg/100 g. And the average content of sample P5 was the highest value 589 mg/100 g, followed by P1, P4, P3, while the content of sample P2 was the lowest value (491 mg/100 g). Meanwhile, there was no significant difference between sample P1 and sample P5, and the same trend was observed in the remaining three samples.
Bitter-taste active amino acids are the major amino acids, which impart on food causing unpleasant flavor. These bitter-taste active amino acids are commonly composed of His, Met, Val, Arg, Ile, Phe, Leu, and Tyr. In this study, the concentration range of the bitter-taste active amino acids occurred from 441 to 567 mg/100 g. The highest concentration was observed in sample P5 with an average value of 567 mg/100 g, followed by P1, P4, P3, and P2. Though the concentration of the bitter-taste active amino acids was relatively high in the five samples, their contribution to the food taste may be marginal due to their high threshold values.
MW distribution of peptides
The MW distribution of peptides in the five fava pastes is shown in . The low MW fractions (≤1 kDa) were the major fractions in the five pastes, accounting 81.84–88.14%, while the fractions between 1 and 5 kDa accounted for 5.12–9.34% and the fraction between 5 and 10 kDa represented 0.62–4.05%. Sample P1 showed the greatest percentage of low MW peptides compared with the other samples, followed by P5, P3, P4, and P2. However, the distribution of high MW (>5 kDa) peptides showed the opposite trend. There was no significant difference in MW ≤ 1 kDa, among the five pastes, while, peptides over 10 kDa were significantly different among samples. Additionally, the peptides between 1–5 and 5–10 kDa were higher and lower in P1 and P5 pastes compared with the other samples, respectively.
Table 3. Distribution of molecular weight of fava pastes.
Volatile compounds of fava pastes
displays the identified volatile components in each of the five samples according to their chemical classes, relative concentrations, and retention indices (RIs) on the DB-wax column, respectively. A total of 125 volatile compounds were identified in the five commercial fava pastes. Among these volatile compounds, a total of 49, 63, 77, 54, and 56 odorants were detected in the order of P1, P2, P3, P4, P5. A careful analysis of the data showed that 22 of the identified compounds were found in all the testing samples and 20 shared compounds at least three testing samples. These compounds were grouped according to their chemical structure as esters (47), aldehydes (18), alkanes (16), alcohols (13), acids (12), olefins (10), ketones (9), phenols (7), heterocycles (2), and ethers (1). According to the quantification result, esters (55–61%) were the most abundant volatile compounds in the fava pastes, followed by aldehydes (11–25%), alcohols (6–13%), acids (2–8%), phenols (1–4%), and ketones (2–3%). All fava pastes samples showed relatively high contents of esters and aldehydes.
Table 4. Volatile compounds in the five tested fava pastes.
A combined total of 47 esters including high MW fatty acid esters (such as ethyl laurate, ethyl myristate, ethyl stearate, and ethyl palmitate) were detected. These compounds have also been found in soybean paste,[Citation6] Doenjang,[Citation16] and miso.[Citation8,Citation50,Citation51] The most abundant compound was ethyl palmitate. This compound, which was notably higher with the contents in P2 and P5 sample in comparison the other samples, accounted for 31.33% of the total esters. The total number of esters identified in all the samples was 46, with sample P5 recoding the highest content of ethyl palmitate with an average value of 7246 ng/g. The concentration of most esters was slightly different between the five samples. All the detected esters were previously identified in various fermented condiments, and these high MW esters were likely produced by the action of fungal lipase on soybean lipids.[Citation11] Esters play a very important role in food aroma, even at very low concentrations. Because short-chain esters can not only be volatilized at room temperature conditions but also have extremely low thresholds (about 10 times smaller than their corresponding alcohols).[Citation52]
Isovaleraldehyde, furfural, 2-methylbutyraldehyde, 3-methylthio-propionaldehyde, and phenylacetaldehyde were the major aldehydes detected in all samples, accounting for more than 95% of the total aldehydes. Considering the pleasant aromas of aldehydes, such as sweet, fruity, nutty, and caramel-like odors, these compounds were considered to be the drivers of flavor quality enhancers.[Citation6] They can also be produced by lipid oxidation and degradation during fermentation. Furfural gave sweet and almond odors, and can be formed by the process of the acid-catalyzed degradation of D-fructose.[Citation53] It was found that the concentration of furfural was slightly different in five samples, and this might be due to strong heat treatments like stir-frying or pasteurization.
Among identified alcohols, phenethyl alcohol, furfuryl alcohol, 3-methyl-1-butanol, and alpha-terpineol were the major compounds detected in all samples. Moreover, phenethyl alcohol, furfuryl alcohol, 3-methyl-1-butanol, linalool, and nerolidol found in all samples and showed similar content. Alcohols usually give a pleasant aroma. Previous research has shown that 3-methyl-1-butanol, isoamyl alcohol, and phenylethyl alcohol were derived from leucine, isoleucine, and phenylalanine, respectively. They were first degraded by Strecker to produce the corresponding aldehyde and then were further reduced.[Citation52] Linalool was detected in Chinese red bean curd.[Citation54] Phenethyl alcohol, 3-methyl-1-butanol, and linalool were important contributors of fava pastes aroma. In this study, alpha-terpineol and 3-methylthiopropanol were detected in three of the samples, which might play a role in the sensation of the products.
Among 12 acids identified in the samples, only 4 of them (lauric acid, myristic acid, isovaleric acid, 2-methyl butyric acid) were found in all samples, and they were confirmed to be the main acids in fava pastes, accounting 74% of all acid content. Sorbic acid and benzoic acid were only found in two samples, which might be due to their addition as preservative. Furthermore, nine ketones were identified, and only 3-hydroxy-2-butanone was detected in all the samples. Ketones are carbonyl compounds which are unstable intermediate components and are easily reduced to the corresponding alcohols[Citation55] Due to their high threshold, the majority of ketone compounds contributed a little to aroma, but some ketone compounds might play an important part as intermediates of heterocyclic compounds during food flavor formation. Seven phenols were identified, and only 4-ethyl-2-methocyphenol was detected in all samples. Only one pyrazine and furan compounds (tetramethylpyrazine, 2-pentylfuran) were identified in sample P3.
Correlation analysis
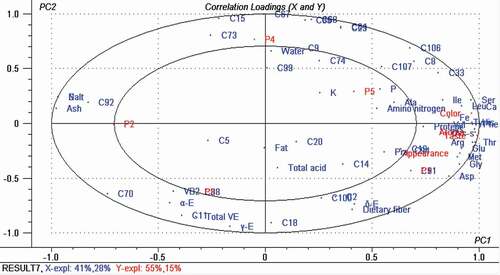
In order to clarify the influence of physicochemical indices, FAAs and aroma substances (X-data) on the scores of sensory preference (Y-data), PLSR[Citation56] were used to study their relationship. PLS2 model was established to simplify the interpretation of the relationship between X-data and Y-data. The correlation loadings plot is displayed in . As shown in the plot, the distribution of the five samples along the horizontal axis (PC1), from the right to the left, showed an order of P1, P5, P4, P3, and P2, which was in accordance with the ranking of overall score. The objects lying to the right of the score plot had more optimal values for those variables. It was easy to observe that PC1 mainly reflected physicochemical properties, FAAs, minerals and vitamin, and PC2 represented volatile compounds. Four sensory variables (taste, aroma, color, and appearance) and most FAAs had an extreme position to the right of the plot along PC1. They were close to each other, far from the center, and very close to the 100% explained variance circle, showing a positive correlation. Meanwhile, partial physicochemical indices such as protein, amino nitrogen, and dietary fiber were also relatively close to the sensory indices, while ash and salt had an extreme position to the left of the plot along PC1, which meant a negative correlation with sensory score. The moisture, total acid, and fat most likely made a very small contribution to the sensory attributes, because their locations were close to zero with regard to the two PCs shown. When it comes to minerals and vitamin detected in all tested samples, only Ca, P, Fe, and δ-Ε were greatly related with sensory properties. Additionally, it seemed that 3-methyl-1-butanol (C2), linalool (C8), isovaleraldehyde (C14), 3-(methylthio)propionaldehyde (C19), 3-hydroxy-2-butanone (C33), 4-ethylphenol (C91), 4-ethenyl-2-methoxyphenol (C94), 2-methyl butyric acid (C100), lauric acid (C106), and myristic acid (C107) correlated positively with PC1, and were also close to sensory properties. Among these volatiles, most of them were detected with the moderate concentration in sample P1, which might be one of the drivers of appealing consumers. These results mentioned above indicated that FAAs, partial physicochemical indices such as protein, amino nitrogen, dietary fiber, Ca, P, Fe, δ-Ε, and some volatiles might significantly influence the sensory acceptability of consumers and could be considered as likely important indicators of the quality of the fava pastes.
Figure 6. PLS2 correlation loading plot of five fava pastes-based physicochemical attributes (water, protein, fat, dietary fiber, ash, salt, total acid, amino nitrogen), FAAs (Asp, Glu, Ser, Gly, His, Thr, Arg, Ala, Tyr, Cys, Val, Met, Phe, Ile, Leu, Lys, and Pro), mineral elements, vitamin, and key volatile compounds determined in this study. Ellipses represent r2 = 0.5 and 1.0, respectively.
Therefore, it was necessary to take numerous intrinsic attributes into account to understand the consumer preference for sample P1. This point could be explained according to the results of correlation analysis. FFAs detected in the five samples might mainly explain the consumer preference, especially the taste attribute. Most of the FAAs were determined with the highest concentration in sample P1 compared with the other samples, primarily due to amounts of its microbial species.[Citation57] The amino acids, especially FAAs, are critical substances naturally present in food and are responsible for the taste, aroma, and quality of various foodstuffs.[Citation9,Citation58,Citation59] The long-term ripening progress of fava pastes was extremely similar to miso[Citation51] and produced a large number of amino acids such as Glu and Asp, which imparted pastes strong umami flavor.[Citation51] Therefore, FAAs had an intimate relation to the formation of unique flavor of fava pastes. Free Glu and glutamates may similarly possess the umami properties and were commonly natural compounds found in many plant and animal foods.[Citation58,Citation60] Previous studies had shown that free Glu was the signaling molecule of umami taste and the principal ingredient in modern savory condiments.[Citation9,Citation61,Citation62] Recent sensory studies found that the palatability enhancement was roughly dependent on the amount and composition of umami substances like free Glu and glutamates, endogenously present in flavor matrices as well as in such savory foods such as chicken and mushroom broths, mashed potatoes, red beets, and green peas.[Citation9,Citation58,Citation59] In addition, these researchers indicated that Gly and L-Ala elicited a strong sweet taste. A hydrophobic D-amino acid, which was formed simultaneously by the synthesis of L-amino acids, also brought out a strong sweet taste. D-Trp, Phe, His, Tyr, and Leu were 35, 7, 7, 6, and 4 times as sweet as sucrose, respectively.[Citation47] It is thought that the strong sweet note elicited by these amino acids was due to the ability of these molecules to bind to the sweet substance receptors.[Citation47] However, most hydrophobic L-amino acids have a bitter taste. Although bitter-active amino acids have a negative effect on the products, they might rarely affect the quality because of their high threshold. Kirimura, Shimizu, Kimizuka, Ninomiya, and Katsuy[Citation48] and Taborda et al.[Citation63] had reported that the organoleptic characteristics and threshold of FAAs greatly varied. Therefore, these amino acids had a non-negligible contribution to the characteristic taste of fava pastes, and may form numerous taste peptides which imparted fava pastes unique volatile flavor and taste.
Meanwhile, partial physicochemical indices, mineral elements, and vitamins might also play as supplements for the quality of the fava pastes. First, sample P1 had moderate crude protein content. The concentration of crude protein was greatly different among the five samples, due to the fact that different pastes were made of different materials as well as different microbial strains, and consequently, difference reflected in their crude protein content.[Citation64] Protein contained in materials was decomposed to some small active substances such as FAAs during fermentation.[Citation51] Second, the content of amino-type nitrogen can reflect the process of fermentation, especially the degree of protein hydrolysis[Citation37,Citation65] and the quality of the fermented products.[Citation64] Five samples had a high concentration of amino-type nitrogen except sample P2. Third, the content of dietary fiber was also moderate, which may underscore the appearance and the palatability of P1 sample. The preference of consumer was greatly affected by the appearance of the products. During post-fermentation stage, especially the traditional craftwork of shinning in the sun at daytime and exposing at night, the dietary fiber contained in materials was fully decomposed under the action of microbial species. The content of total acid was also moderate in sample P1. It was found that the total acid of fava pastes increased gradually during fermentation. Shim et al.[Citation37] reported that organic acids such as propionic acid, lactic acid, and acetic acid were generated in the action of lactic acid bacteria and yeasts in Doenjang (soybean paste). Fourth, the majority of minerals and vitamins also represented moderate values in sample P1, which can be disregarded in this study due to their negligible concentrations and relatively far distance from the sensory attributes on the correlation loading plot.
Volatile compounds detected in the five samples also likely affected the consumer preference in a degree, especially those substances mentioned in correlation analysis. Most of them were observed the moderate concentration in sample P1, which might impart a pleasant aroma to fava paste except 3-(methylthio) propionaldehyde (C19). Previous literatures had reported that most aldehydes might be generated from the oxidation of lipids and the degradation of fatty acids during fermentation.[Citation66,Citation67] Benzaldehyde (C20) possesses cherry or almond-like aromas and has been previously identified in fermented soybean curd (FSC) samples.[Citation13,Citation54,Citation68] 3-Methylthiopropionaldehyde (C19) is an important sulfur-containing aldehyde substance, derived mainly from the degradation of sulfur-containing amino acids, such as peptides. Linalool (C8) was described as a lemon note, which could weaken the unpleasant odors in the mixing system.[Citation54] 4-Ethenyl-2-methoxyphenol (C94) was greatly responsible for the flavor of soy sauce and was generated from the metabolic activity of yeast and had a strong clove and fermented-like odor.[Citation69] Compared with esters and alcohols, ketones determined in the fava pastes relatively low in term of species and concentration. 3-Hydroxy-2-butanone (C33), described as a creamy aroma, was reported as the dominant products of sugar fermentation. Feng et al.[Citation70] had reported that the difference in the overall aroma of those different types of soy sauce was more due to the quantity of these compounds rather than their composition.
Additionally, another important factor that might drive the consumer preference especially the taste attribute was the main low MW substances such as acidic peptides and some trace amounts high MW substances such as fatty acid esters generated during ripening stage. Among the fraction of MW below 5 kDa, sample P1 ranked first, followed by P5, P3, P4, while sample P2 ranked last. There were a variety of microbes in the fermentation environment and the raw materials. These microbes selves and their metabolites such as protease could decompose some large molecular compounds in the raw materials into small molecular compounds such as peptides, amino acids, and sugars.[Citation24] The intermediates formed in the previous stage further underwent complex reactions and form different products such as Maillard reaction products during the post-fermentation process, which contributed to the quality of the products. Previous researches showed that taste-active proteolytic oligopeptides with low MW significantly contributed to the taste of numerous foods,[Citation23,Citation63] especially acidic oligopeptide fraction, which had been described as an umami taste and a favorable aftertaste.[Citation23,Citation46] Noguchi, Arai, Yamashita, Kato, and Fujimaki[Citation44] reported that the low MW acidic oligopeptide fraction (Asp-Glu-Ser), isolated from fish protein concentrate hydrolyzate, possessed the MSG-like taste. Rhyu and Kim[Citation25] investigated the umami taste characteristics of water extract Doenjang from Korean soybean paste, and concluded that the umami taste characteristics were a result of the low MW (1000 Da > MW≥ 5000 Da) acidic peptides naturally produced during the fermentation of soybeans. Ogasawara et al.[Citation24] identified the key substances that gave the characteristic flavor of long-ripened miso, and also proved that the Maillard peptide products with moderated MW (1000 Da ≤ MW≤ 5000 Da) could enhance the mouthfulness and continuity and they might play a critical role in the formation of the characteristic flavor of the products. Therefore, it can be suggested that the amount of low MW components in foods might reflect the intensity of umami taste or characteristic flavor at a certain degree. The higher, the content of the low MW compounds was, the greater the possibility of generating umami substances through Maillard reaction was, which could greatly contribute to a better quality of the final product.
Conclusion
In the present study, questionnaires were used to evaluate likeness for five local fava pastes produced from different companies among local residents and found a preference of sample P1. The ranking of overall liking score was P1 > P5 > P4 > P3 > P2. In order to identify the likely drivers of the consumer behavior, the sensory evaluation, physicochemical properties, and volatile compounds studies were conducted. The sensory evaluation showed that sample P1 also had the greatest overall score as the same trend as consumer surveys. Correlation analysis basing on physicochemical properties, volatiles (X-data) and sensory evaluation (Y-data) was conducted and the result showed that FAAs, partial physicochemical indices such as protein, amino nitrogen and dietary fiber, Ca, P, Fe, δ-Ε, and some volatiles may synthetically affect the consumer preference. However, there should be followed by a recombination study in next work to prove that these possible drivers cause this consumption phenomenon indeed. Additionally, Further work should focus on the interactive and additive effects on the sensory performance of those indices which had a relative low correlation mentioned in this study, as well as the effects of the raw materials, microbial specie and the processing on sensory properties. These researches can provide valuable information for grading of fava pastes in industries and guide actual producing toward the expectation of consumers, especially increasing those positive factors.
Declaration of interest
The authors declare that there are no conflicts of interest regarding the publication of this paper.
Additional information
Funding
References
- Li, Z.-H.; Rui, J.-P.; Li, X.-Z.; Lin, J.-B.; Dong, L.; Huang, Q.-L.; Huang, C.; Wang, Z.-P.; Li, L.; Xuan, P.; Tang, Y.-M.; Chen, F.-S., Bacterial Community Succession and Metabolite Changes during Doubanjiang-Meju Fermentation, a Chinese Traditional Fermented Broad Bean (Vicia Faba L.) Paste. Food Chemistry. 2017, 218, 534–542. DOI: 10.1016/j.foodchem.2016.09.104.
- Li, X.; Zhao, C.; Zheng, C.; Liu, J.; Vu, V.-H.; Wang, X.; Sun, Q., Characteristics of Microbial Community and Aroma Compounds in Traditional Fermentation of Pixian Broad Bean Paste as Compared to Industrial Fermentation. International Journal of Food Properties. 2018, 20, 1–12. DOI: 10.1080/10942912.2017.1373358.
- Zhu, L.-J.; Fan, Z.-H.; Kuai, H.; Li, Q., Batch-Batch Stable Microbial Community in the Traditional Fermentation Process of Huyumei Broad Bean Pastes. Letters in Applied Microbiology. 2017, 65, 226–232. DOI: 10.1111/lam.12765.
- Niu, C.-T.; Fan, Z.-H.; Zheng, F.-Y.; Li, Y.-X.; Liu, C.-F.; Wang, -J.-J.; Li, Q., Isolation and Identification of Gas-Producing Spoilage Microbes in Fermented Broad Bean Paste. Food Control. 2017, 84, 8–16. DOI: 10.1016/j.foodcont.2017.07.004.
- Zhu, X.-L.; Watanabe, K.; Shiraishi, K.; Ueki, T.; Noda, Y.; Matsui, T.; Matsumoto, K., Identification of ACE-Inhibitory Peptides in Salt-Free Soy Sauce That Are Transportable across Caco-2 Cell Monolayers. Peptides. 2008, 29, 338–344. DOI: 10.1016/j.peptides.2007.11.006.
- Lee, S.-J.; Ahn, B., Comparison of Volatile Components in Fermented Soybean Pastes Using Simultaneous Distillation and Extraction (SDE) with Sensory Characterisation. Food Chemistry. 2009, 114, 600–609. DOI: 10.1016/j.foodchem.2008.09.091.
- Kobayashi, K.; Horii, Y.; Watanabe, S.; Kubo, Y.; Koguchi, K.; Hoshi, Y.; Matsumoto, K.-I.; Soda, K., Comparison of Soybean Cultivars for Enhancement of the Polyamine Contents in the Fermented Soybean Natto Using Bacillus subtilis (Natto). Bioscience, Biotechnology, and Biochemistry. 2017, 81, 587–594. DOI: 10.1080/09168451.2016.1270738.
- Giri, A.; Osako, K.; Okamoto, A., Antioxidative Properties of Aqueous and Aroma Extracts of Squid Miso Prepared with Aspergillus oryzae-Inoculated Koji. Food Research International. 2011, 44, 317–325. DOI: 10.1016/j.foodres.2010.10.013.
- Smriga, M.; Mizukoshi, T.; Iwahata, D.; Eto, S.; Miyano, H.; Kimura, T.; Curtis, R.-I., Amino Acids and Minerals in Ancient Remnants of Fish Sauce (Garum) Sampled in the “Garum Shop” of Pompeii, Italy. Journal of Food Composition and Analysis. 2010, 23, 442–446. DOI: 10.1016/j.jfca.2010.03.005.
- He, G.; Huang, J.; Liang, R.; Wu, C.; Zhou, R., Comparing the Differences of Characteristic Flavour between Natural Maturation and Starter Culture for Mucor‐Type Douchi. International Journal of Food Science and Technology. 2016, 51, 1252–1259. DOI: 10.1111/ijfs.13077.
- Chou, -C.-C.; Hwan, C.-H., Effect of Ethanol on the Hydrolysis of Protein and Lipid during the Ageing of a Chinese Fermented Soya Bean Curd–Sufu. Journal of the Science of Food and Agriculture. 2010, 66, 393–398. DOI: 10.1002/jsfa.2740660318.
- Yin, L.-J.; Li, L.-T.; Li, Z.-G.; Tatsumi, E.; Saito, M., Changes in Isoflavone Contents and Composition of Sufu (Fermented Tofu) during Manufacturing. Food Chemistry. 2004, 87, 587–592. DOI: 10.1016/j.foodchem.2004.01.011.
- Chung, H.-Y.; Fung, P.-K.; Kim, J.-S. Aroma Impact Components in Commercial Plain Sufu. Journal of Agricultural and Food Chemistry. 1684–1691, 2005(53). DOI: 10.1021/jf048617d.
- Ma, Y.; Cheng, Y.; Yin, L.; Wang, J.; Li, L. Effects of Processing and NaCl on Angiotensin I-Converting Enzyme Inhibitory Activity and γ-Aminobutyric Acid Content during Sufu Manufacturing. Food and Bioprocess Technology. 1782–1789, 2013(6). DOI: 10.1007/s11947-012-0852-3.
- Chen, Y.-P.; Chung, H.-Y., Development of A Lexicon for Commercial Plain Sufu (Fermented Soybean Curd). Journal of Sensory Studies. 2016, 31, 22–33. DOI: 10.1111/joss.12187.
- Jo, Y.-J.; Cho, I.-H.; Song, C.-K.; Shin, H.-W.; Kim, Y.-S., Comparison of Fermented Soybean Paste (Doenjang) Prepared by Different Methods Based on Profiling of Volatile Compounds. Journal of Food Science. 2011, 76, C368–C379. DOI: 10.1111/j.1750-3841.2011.02068.x.
- Ding, X.-L.; Qin, L. Evolution of Proteolytic Tasty Components during Preparation of Douchiba, a Traditional Chinese Soy-Fermented Appetizer. Food Technology & Biotechnology. 2007, 45, 85–90.
- Yokotsuka, T.; Asao, Y.; Sakasai, T., Studies of the Flavorous Substances in Shoyu Part XXVII:The Production of 4-Ethylguaiacol during Shoyu Fermentation, and Its Role for Shoyu Flavor. Nippon Nōgeikagaku Kaishi. 1967, 41, 442–447. DOI: 10.1271/nogeikagaku1924.41.9_442.
- Hayashida, Y.;, Flavor-Active Furanones, HEMF and HDMF. The Formation Mechanism by Micro-Organisms and Enhancement Techniques in Brewing Industry. Journal of the Society of Brewing Japan. 2003, 98, 89–95. DOI: 10.6013/jbrewsocjapan1988.98.89.
- Sugawara, E.; Hashimoto, S.; Sakurai, Y.; Kobayashi, A., Formation by Yeast of the HEMF (4-Hydroxy-2(Or 5)-Ethyl-5(Or 2)-Methyl-3(2h)-Furanone) Aroma Component in Miso with Aging. Bioscience Biotechnology and Biochemistry. 2008, 58, 1134–1135. DOI: 10.1271/bbb.58.1134.
- Lin, C.-H.; Wei, Y.-T.; Chou, -C.-C., Enhanced Antioxidative Activity of Soybean Koji Prepared with Various Filamentous Fungi. Food Microbiology. 2006, 23, 628–633. DOI: 10.1016/j.fm.2005.12.004.
- Rho, S.-J.; Lee, J.-S.; Yong, I.-C.; Kim, Y.-W.; Lee, H.-G., Purification and Identification of an Angiotensin I-Converting Enzyme Inhibitory Peptide from Fermented Soybean Extract. Process Biochemistry. 2009, 44, 490–493. DOI: 10.1016/j.procbio.2008.12.017.
- Raksakulthai, N.; Haard, N.-F. Correlation between the Concentration of Peptides and Amino Acids and the Flavour of Fish Sauce. Asean Food Journal. 1992.
- Ogasawara, M.; Katsumata, T.; Egi, M., Taste Properties of Maillard-Reaction Products Prepared from 1000 to 5000 Da Peptide. Food Chemistry. 2006, 99, 600–604. DOI: 10.1016/j.foodchem.2005.08.040.
- Rhyu, M.-R.; Kim, E.-Y., Umami Taste Characteristics of Water Extract of Doenjang, a Korean Soybean Paste: Low-Molecular Acidic Peptides May Be a Possible Clue to the Taste. Food Chemistry. 2011, 127, 1210–1215. DOI: 10.1016/j.foodchem.2011.01.128.
- Hong, J.-H.; Lee, K.-W.; Chung, S.; Chung, L.; Kim, H.-R.; Kim, K.-O.; Characteristics, S., Cross-Cultural Comparisons of Consumer Acceptability for Gochujang Dressing. Food Science and Biotechnology. 2012, 21, 829–837. DOI: 10.1007/s10068-012-0107-0.
- Chung, L.; Chung, S.-J., Cross-Cultural Comparisons among the Sensory Characteristics of Fermented Soybean Using Korean and Japanese Descriptive Analysis Panels. Journal of Food Science. 2007, 72, S676–S688. DOI: 10.1111/j.1750-3841.2007.00542.x.
- Kim, H.-G.; Hong, J.-H.; Song, C.-K.; Shin, H.-W.; Kim, K.O.; Characteristics, S., Consumer Acceptability of Fermented Soybean Paste (Doenjang). Journal of Food Science. 2010, 75, S375–S383. DOI: 10.1111/j.1750-3841.2010.01771.x.
- Kim, M.-K.; Han, S.K.; Mi, J.K.; Sang, S.K., Identification of Sensory Characteristics that Drive Consumer Preferences of Commercially Mass‐Produced Doenjang in Korea. Journal of Sensory Studies. 2018, 33, e12323. DOI: 10.1111/joss.12323.
- Breternitz, N.-R.; Bolini, H.-M.-A.; Hubinger, M.-D., Sensory Acceptance Evaluation of a New Food Flavoring Produced by Microencapsulation of a Mussel (Perna Perna) Protein Hydrolysate. LWT- Food Science and Technology. 2017, 83, 141–149. DOI: 10.1016/j.lwt.2017.05.016.
- Meilgaard, M.-C.; Carr, B.-T.; Civille, G.-V. Sensory Evaluation Techniques, Fourth ed.; CRC Press: Boca Raton, Florida, USA, 2006.
- Fung, P.-K.; Principal Component Analysis of the Volatile Flavor Components and the Lexicons of the Commercial Plain Fermented Soybean Curds. The Chinese University of Hong Kong,Hong Kong SAR, China, Thesis, Chapter 4, 2004; pp 70–108.
- Barden, L.-M.; Drake, M.-A.; Foegeding, E.-A., Impact of Sample Thickness on Descriptive Texture Analysis of Cheddar Cheese. Journal of Sensory Studies. 2012, 27, 286–293. DOI: 10.1111/j.1745-459X.2012.00392.x.
- Półtorak, A.; Wyrwisz, J.; Moczkowska, M.; Marcinkowska-Lesiak, M.; Stelmasiak, A.; Ulanicka, U.; Zalewska, M.; Wierzbicka, A.; Sun, D.-W., Correlation between Instrumental Texture and Colour Quality Attributes with Sensory Analysis of Selected Cheeses as Affected by Fat Contents. International Journal of Food Science and Technology. 2015, 50, 999–1008. DOI: 10.1111/ijfs.12707.
- Cherdchu, P.-E.; Chambers, I.-V.; Suwonsichon, T., Sensory Lexicon Development Using Trained Panelists in Thailand and the U.S.A.: Soy Sauce. Journal of Sensory Studies. 2013, 28, 248–255. DOI: 10.1111/joss.12041.
- Roh, S.-H.; Lee, S.-M.; Sang, S.-K.; Kim, K.-O., Importance of Applying Condiments in A Commonly Consumed Food System for Understanding the Association between Familiarity and Sensory Drivers of Liking: A Study Focused on Doenjang. Journal of Food Science. 2018, 83, 464–467. DOI: 10.1111/1750-3841.14040.
- Shim, J.-M.; Lee, K.-W.; Yao, Z.; Kim, H.-J.; Kim, J.-H., Properties of Doenjang (Soybean Paste) Prepared with Different Types of Salts. Journal of Microbiology and Biotechnology. 2016, 26, 1533–1541. DOI: 10.4014/jmb.1605.05019.
- Bongkuk, K.; Kimyong, K.; Hong, Y.-S.; Cherlho, L., Metabolomic Assessment of Fermentative Capability of Soybean Starter Treated with High Pressure. Journal of Agricultural and Food Chemistry. 2010, 58, 8738–8747. DOI: 10.1021/jf101994u.
- Null, A.O.A.C.;. Official Method of Analysis; AOAC International: Rockville, Maryland, USA, 2000.
- Liu, P.; Huang, M.-G.; Song, S.-Q.; Hayat, K.; Zhang, X.-M.; Jia, C.-S. Sensory Characteristics and Antioxidant Activities of Maillard Reaction Products from Soy Protein Hydrolysates with Different Molecular Weight Distribution. Food and Bioprocess Technology. 1775–1789, 2012(5). DOI: 10.1007/s11947-010-0440-3.
- Vandendool, H.; Kratz, P.-D.A., Generalization of the Retention Index Syetem Including Linear Temperature Programmed Gas-Liquid Partition Chromatography. Journal of Chromatography A. 1963, 11, 463–471. DOI: 10.1016/S0021-9673(01)80947-X.
- Xie, J.-C.; Sun, B.-G.; Zheng, F.-P.; Wang, S.-B., Volatile Flavor Constituents in Roasted Pork of Mini-Pig. Food Chemistry. 2008, 109, 506–514. DOI: 10.1016/j.foodchem.2007.12.074.
- Gao, L.; Liu, T.; An, X.; Zhang, J.; Ma, X.; Cui, J., Analysis of Volatile Flavor Compounds Influencing Chinese-Type Soy Sauces Using GC-MS Combined with HS-SPME and Discrimination with Electronic Nose. Journal of Food Science and Technology. 2017, 54, 130–143. DOI: 10.1007/s13197-016-2444-0.
- Noguchi, M.; Arai, S.; Yamashita, M.; Kato, H.; Fujimaki, M., Isolation and Identification of Acidic Oligopeptides Occurring in a Flavor Potentiating Fraction from a Fish Protein Hydrolysate. Journal of Agricultural and Food Chemistry. 1975, 23, 49–53. DOI: 10.1021/jf60197a003.
- Maehashi, K.; Matsuzaki, M.; Yamamoto, Y.; Udaka, S., Isolation of Peptides from an Enzymatic Hydrolysate of Food Proteins and Characterization of Their Taste Properties. Bioscience Biotechnology and Biochemistry. 1999, 63, 555–559. DOI: 10.1271/bbb.63.555.
- Fujimaki, M.; Arai, S.; Yamashita, M.; Kato, H.; Noguchi, M., Taste Peptide Fractionation from a Fish Protein Hydrolysate. Agricultural and Biological Chemistry. 1973, 37, 2891–2898. DOI: 10.1271/bbb1961.37.2891.
- Kato, H.; Rhue, M.R.; Nishimura, T., Role of Free Amino Acids and Peptides in Food Taste. Acssymp. 1989, 388, 158–173. DOI: 10.1021/bk-1989-0388.ch013.
- Kirimura, J.; Shimizu, A.; Kimizuka, A.; Ninomiya, T.; Katsuya, N., Contribution of Peptides and Amino Acids to the Taste of Foods. Journal of Agricultural and Food Chemistry. 1969, 17, 689–695. DOI: 10.1021/jf60164a031.
- Solms, J.;, The Taste of Amino Acids, Peptides and Proteins. Internationale Zeitschrift Fur Vitaminforschung. International Journal of Vitamin Research. Journal International De Vitaminologie. 1969, 39, 320–322. DOI: 10.1021/jf60164a016.
- Nakamura, M.;, Isolation of Mutants of Miso Yeast, Zygosaccharomyces Rouxii with High Productivity of C3 to C5 Alcohols. Journal of the Japanese Society for Food Science and Technology. 1990, 37, 981–983. DOI: 10.3136/nskkk1962.37.12_981.
- Ogasawara, M.; Yamada, Y.; Egi, M., Taste Enhancer from the Long-Term Ripening of Miso (Soybean Paste). Food Chemistry. 2006, 99, 736–741. DOI: 10.1016/j.foodchem.2005.08.051.
- Mcl, N.; Lubachevsky, G.; Rankin, S.-A.-A., Study of the Volatile Composition of Minas Cheese. LWT - Food Science and Technology. 2005, 38, 555–563. DOI: 10.1016/j.lwt.2004.07.019.
- Shaw, P.-E.; Tatum, J.-H.; Berry, R.-E. Acid-Catalyzed Degradation of D-Fructose. Carbohydrate Research. 1967, 5, 266–273. DOI: 10.1016/S0008-6215(00)80500-5.
- Chung, H.-Y.;. Volatile Flavor Components in Red Fermented Soybean (Glycine Max) Curds. Journal of Agricultural & Food Chemistry. 1803–1809, 2000(48). DOI: 10.1021/jf991272s.
- Fernández-Garcı́A, E.; Carbonell, M.-A.; Gaya, P.; Nuñez, M., Evolution of the Volatile Components of Ewes Raw Milk Zamorano Cheese. Seasonal Variation. International Dairy Journal. 2004, 14, 701–711. DOI: 10.1016/j.idairyj.2003.12.011.
- Xie, K.-L.; Feng, T.; Lin, W.-H.; Zhuang, H.-N.; Xu, Z.-M.; Bing, F.-L., Correlations between Aroma Profiles and Sensory Characteristics of Red Wines by Using Partial Least Squares Regression Method. Advance Journal of Food Science andTechnology. 2016, 12, 271–280. DOI: 10.19026/ajfst.12.2910.
- Jo, M.-N.; Lee, Y.-M., Analyzing the Sensory Characteristics and Taste-Sensor Ions of MSG Substitutes. Journal of Food Science. 2010, 73, S191–S198. DOI: 10.1111/j.1750-3841.2008.00769.x.
- Baryłko-Pikielna, N.; Kostyra, E., Sensory Interaction of Umami Substances with Model Food Matrices and Its Hedonic Effect. Food Quality and Preference. 2007, 18, 751–758. DOI: 10.1016/j.foodqual.2007.01.002.
- Sinesio, F.; Comendador, F.-J.; Peparaio, M.; Moneta, E., Taste Perception of Umami-Rich Dishes in Italian Culinary Tradition. Journal of Sensory Studies. 2010, 24, 554–580. DOI: 10.1111/j.1745-459X.2009.00226.x.
- Kawai, M.; Okiyama, A.; Ueda, Y. Taste Enhancements between Various Amino Acids and IMP. Chemical Senses. 2002, 27(8), 739–745. DOI: 10.1093/chemse/27.8.739.
- Yamaguchi, S.; Ninomiya, K., What Is Umami?. Food Reviews International. 1998, 14, 123–138. DOI: 10.1080/87559129809541155.
- Bellisle, F.;, Experimental Studies of Food Choices and Palatability Responses in European Subjects Exposed to the Umami Taste. Asia Pacific Journal of Clinical Nutrition. 2008, 17, 376–379. DOI: 10.6133/apjcn.2008.17.s1.94.
- Taborda, G.; Gómezruiz, J.-A.; Martínezcastro, I.; Amigo, L.; Ramos, M.; Molina, E., Taste and Flavor of Artisan and Industrial Manchego Cheese as Influenced by the Water-Soluble Extract Compounds. European Food Research and Technology. 2008, 227, 323–330. DOI: 10.1007/s00217-007-0769-7.
- Tian, T.; Wu, J.-R.; Yue, X.-Q., Analysis of Relationship between Sensory Quality and Physiochemical Indexes of Natural Fermented Soybean Paste. Applied Mechanics and Materials. 2014, 508, 75–78. DOI: 10.4028/www.scientific.net/AMM.508.75.
- Kwak, C.-S.; Lee, M.-S.; Sang, C.-P., Higher Antioxidant Properties of Chungkookjang, a Fermented Soybean Paste, May Be Due to Increased Aglycone and Malonylglycoside Isoflavone during Fermentation. Nutrition Research. 2007, 27, 719–727. DOI: 10.1016/j.nutres.2007.09.004.
- Ames, J.-M.; Glesni, M., Volatile Components of an Unflavored Textured Soy Protein. Journal of Food Science. 2010, 49, 1552–1565. DOI: 10.1111/j.1365-2621.1984.tb12842.x.
- Moy, Y.-S.; Lu, T.-J.; Chou, -C.-C., Volatile Components of the Enzyme-Ripened Sufu, a Chinese Traditional Fermented Product of Soy Bean. Journal of Bioscience and Bioengineering. 2012, 113, 196–201. DOI: 10.1016/j.jbiosc.2011.09.021.
- Hwan, C.-H.; Chou, -C.-C., Volatile Components of the Chinese Fermented Soya Bean Curd as Affected by the Addition of Ethanol in Ageing Solution. Journal of the Science of Food and Agriculture. 2010, 79, 243–248. DOI: 10.1002/(SICI)1097-0010(199902)79:2<243::AID-JSFA179>3.0.CO;2-I.
- Kobayashi, A.; Sugawara, E. Flavor Components of Shoyu and Miso Japanese Fermented Soybean Seasonings. Flavor Chemistry of Ethnic Foods. 1999, 5–14.
- Feng, Y.-Z.; Su, G.-W.; Zhao, H.-F.; Cai, Y.; Cui, C.; Sun-Waterhouse, D.-X.; Zhao, -M.-M., Characterisation of Aroma Profiles of Commercial Soy Sauce by Odour Activity Value and Omission Test. Food Chemistry. 2015, 167, 220–228. DOI: 10.1016/j.foodchem.2014.06.057.