
 ?Mathematical formulae have been encoded as MathML and are displayed in this HTML version using MathJax in order to improve their display. Uncheck the box to turn MathJax off. This feature requires Javascript. Click on a formula to zoom.
ABSTRACT
The freshness of Goldlined seabream Rhabdosargus sarba stored at 0ºC for 12 days was assessed using quality index method (QIM), physicochemical, color and microbiological parameters. Results showed that the developed QIM scheme for Goldlined seabream Rhabdosargus sarba consisted of nine parameters, which gave total 34 demerit points. QI showed a linear relationship to storage time (QIM = 8.06× storage time-7.20, R2 = 0.954), and the remaining storage time could be estimated with an accuracy of ± 6 days. The physicochemical, microbiological and sensory data were integrated and used to determine the rejection point. The storage time affected L* and W values. The shelf life of whole Goldlined seabream Rhabdosargus sarba stored at 0ºC remain stable for consumption until 9 days of storage.
Introduction
Rhabdosargus sarba, one of the valuable fisheries resources in the Persian Gulf, is preferred by the consumer in the south of Iran. Goldlined seabream Rhabdosargus sarba captured in the local market are sold as a whole (ungutted) fish stored on ice. Because this species is consumed domestically, it is very important to extend its shelf life. Fish is highly perishable because of high levels of free amino acids and other soluble non-nitrogenous substances in seafood serve as easily digestible nutrients for microbial growth.[Citation1]
After harvesting, fish goes through a complex process of enzymes and microbial activities, resulting in protein degradation, lipid oxidation or decomposition that lead to changes in sensory characteristics over time, causing ultimate rejection by the consumer and making fish unfit for consumption.[Citation2] So, a tool to assess the sensory properties of fish with specific aspects for each species, known as Quality Index Method (QIM), has been currently used for determining fish freshness. The sum of these scores gives the Quality Index (QI), which gives scores closer to zero for very fresh fish.[Citation3] Tasmanian Food Research unit in Australia introduced QIM as a sensory method for prediction of the shelf life of fish.[Citation4]
There are some scientific researches addressing issues related to QIM of seabream. Some studies showed that the quality assessment applicable to gilthead seabream and blackspot seabream was through the use of QI.[Citation5,Citation6] Specific spoilage organisms, a few members of the microbial community of freshly caught or processed seafood, really contribute to the seafood spoilage[Citation7] specific spoilage organisms produce various volatile compounds such as trimethylamine (TMA) and total volatile nitrogen bases (TVB-N), which could function as indicators of spoilage. Physicochemical indexes are used to evaluate the freshness of fishery products, especially the pH, total volatile nitrogen bases (TVB-N) and thiobarbitoric acid reactive substances (TBARS).[Citation8] The acceptable upper limit for the pH of seafood is 6.8–7.[Citation9] The TVB-N limit is 25 mg N/100 g muscle of seafood as the highest acceptable level and above 30 mg N/100 g muscle indicates that muscle is decomposed and inedible. The TBARS value of 1–2 mg malonaldehyde/kg muscle is an acceptable limit.[Citation10]
Goldlined seabream, Rhabdosargus sarba, have become a popular food resource among consumers in the south of Iran due to their high market value and nutrition value. This species is consumed domestically, it is very important to extend its shelf life, which is normally quite limited when kept. There has been any research on the development of QIM sensory scheme and study shelf life of ice- stored Goldlined seabream Rhabdosargus sarba. Aware of the commercial importance of marine fish in Iran, the demands on the quality and the higher perishability, the current study aims to evaluate the freshness of whole (ungutted) Goldlined seabream Rhabdosargus sarba stored at 0ºC up to 12 days, through the sensorial (QIM scheme), physicochemical, color, and microbiological evaluations.
Material and methods
Sample preparation and storage time
Freshly caught Goldlined seabream Rhabdosargus sarba were collected from the Persian Gulf in Khozestan (south Iran). The average weight of fish was 300.83 ± 2.43 g per fish. Immediately after collection, samples were cooled with ice and transported to the Department of Marine Natural Resources, Khorramshahr University of Marine Science and Technology within 1h. Upon arrival, fish were washed in cold water. After draining, fish weighing approximately 200 g were packed in a zip bag. Fish samples were kept in ice in a plastic container with drain holes. The ratio of fish to ice was 1:3. Fish were re-iced daily to maintain the same ratio. All samples were taken for sensory analysis, microbiological, physicochemical and color every 3 days for up to 12 days.
Sensory analysis
The sensory analysis for the development of QIM for raw fish was based on methods previously described.[Citation6] The QIM scheme for Goldlined seabream lists quality attributes for overall appearance, eyes, gills, fins, caudal fines, dorsal area, abdomen (internally), 2 points are related to the abdomen (externally) and (internally) the muscle. Scores were given for each quality attributes according to descriptions, ranging from 0 to 3. The scores given for all the quality attributes are summarized by the Quality Index, which increases linearly with the storage time in ice. The preliminary QIM scheme for the sensory evaluation of fish was designed according to pre-observation of fish encompassing: overall appearance; cornea, pupil, shape and eyeball of eye; color and odor of gill, fins; moisture and color of caudal fin; elasticity and color of dorsal; color and odor of abdomen (internal); overall aspect of abdomen (outside); color, odor and firmness of flesh. Seven panelists, which had previously been trained according to ISO 8586,[Citation11] experienced in fish freshness evaluation carried out the sensory analysis. Photographs of each stage were taken in the same time and should be used to illustrate quality attributes when introducing the QIM concept for assessing fish quality to the fishery industry. All analysis was done at baseline (day 0) and at a regular interval of 3 days in triplicate.
Microbiological analysis
Samples were collected aseptically. The samples (25 g) were placed in a Stomacher bag containing 225 mL of 0.85% saline water. After mixing for 1 min in a Stomacher blender, further serial dilution was done using the same diluent. Thereafter, 0.1 mL of appropriate dilution was used for microbiological analysis by spread plate method. The media and condition used were: a) total mesophilic count (TMC) on pour plates of plat count agar (PCA, Biolife Italian Mascia Brunelli, Italy) incubated for 24 to 48 h at 37 °C; b) total psychrotrophic bacteria (PTC) on pour plates of plate count agar (PCA, Biolife Italian Mascia Brunelli, Italy) incubated for 10 days at 4 °C; c) Enterobacteriaceae on double layered plates of eosin methylene blue agar (EMB Agar, Liofilchem, Italy) incubated for 24 h at 37 °C.
Physicochemical analysis
Total volatile basic nitrogen (TVBN), pH, thiobarbitoric acid reactive substances (TBARS) and free fatty acid (FFA) were determined. TVBN (mg/100 g fish) was measured using the distillation method.[Citation12] This method was determined by distillation after the addition of MgO to homogenized fish samples. The distillate was collected in a flask containing an aqueous solution of boric acid and methyl red as an indicator. Afterward, the boric acid solution was titrated with a sulphuric acid solution. The TVB-N value was determined according to the consumption of sulphuric acid. To determine the pH, 10 mL of distilled water was added to 2 g of ground shrimp. The mixture was homogenized and the pH was measured in triplicate using a pH meter.[Citation13] To determine the TBA, 10 g of homogenized sample were added with 97.5 mL of distilled water and 2.5 mL of 4N HCl. The mixture was heated with steam distillation. Five mL of distillate was added to 5 mL of thiobarbituric reactive reagent containing 0.02 M TBA in 90% glacial acetic acid and incubated in boiling water for 35 min. After cooling, the absorbance of the pink solution was measured at 538 nm using a spectrophotometer. The constant 7.8 was used to calculate the TBA number.[Citation14] The TBA value is expressed as mg malonaldehyde/kg sample. To determine the FFA, the Free Fatty Acid content was determined in the lipid extract by Woyewoda’s method. Results were expressed in % of oleic acid.[Citation15]
Color measurements
A Minolta Chroma Meter CR400 (Minolta, Osaka, Japan) was used for color measurements. Colors were expressed as CIELab coordinates. In this system, Lightness (L*) represents the color lightness on a 0–100 point scale from black to white; a* is the position between red (+) and green (-); and b* is the position between yellow (+) and blue (-). The color intensity is expressed by a chroma value (C*ab), while hue (H°ab) corresponds to the name of the color as found in its pure state on the spectrum. These values were calculated according to the formulae:
Statistical analysis
Average were compared through an Analysis of Variance (ANOVA) and effects were considered significant (by Duncan´s test) when p-value ≤ 0.05. Pearson correlation analysis with 95% of confidence interval was used to determine the relationship between time of iced storage and quality parameters. Results obtained for QIM were then used to partial least-squares regression (PLS). Observed and predicted values by linear regression were used to estimate the uncertainty (standard error of estimate) of the prediction of the QI. Correlation between mean parameter values over time (in days) was then estimated for each parameter in each developing QIM scheme and used to improve and establish the final QIM scheme. Multivariate analysis, by principal component analysis (PCA),[Citation16] was carried out to determine the importance of each parameter of the QIM scheme and to eventually reject those which were unfitted to describe freshness during storage time.
Results and discussion
Quality index method (QIM)
The resulting QIM protocol has 9 quality attributes and 19 parameters for the quality assessment of ice-stored Goldlined seabream Rhabdosargus sarba (). The parameters were scored from 0 to 1, 0 to 2 or 0 to 3, according to the characteristics observed. The total demerit points reached 34 points, from those, 3 points are related to overall appearance, 7 points are related to the eyes, 5 points are related to the gills, 2 points are related to the fins, 3 points are related to the caudal fines, 3 points are related to the dorsal area, 4 points are related to the abdomen (internally), 2 points are related to the abdomen (externally) and 5 abdomen (internally) the muscle. The developed Goldlined seabream Rhabdosargus sarba protocol has a maximum of 34 demerit points, which is close to the protocols for seabream (Dicentrarchus labrax) and blackspot seabream (Pagellus bogaraveo) as cited by Alasalvar et al (2002) (total demerit points were 38 points) and Sant’Ana et al (2011) (total demerit points were 30 points) respectively.[Citation6,Citation17] Whereas, the protocols for seabream differed from those used for gilthead seabream,[Citation2] in which the QIM had a maximum of 15 demerit points. The use of a higher number of parameters causes a linear evolution of Goldlined seabream Rhabdosargus sarba spoilage during ice storage.
Table 1. QIM scheme for assessing whole ice storage Goldlined seabream Rhabdosargus sarba.
The QIM scheme is useful essentially to give a good description of changes in whole raw Goldlined seabream Rhabdosargus sarba during ice storage. According to Botta (1995)[Citation18] linear correlation between quality index (QI) and storage time in ice may be used to readily predict the remaining shelf life. The sum of the scores given to each of its sensory characteristics on each storage day indicates the QI of ice-stored Goldlined Seabream. The QI for Goldlined seabream Rhabdosargus sarba increased with storage time (). On the first and last days of storage (day 0 and day 12), Goldlined seabream Rhabdosargus sarba received a QI = 0 and QI = 32.33. The scores given by the trained panelists show that whole ungutted Goldlined seabream Rhabdosargus sarba has a high freshness status (at 0 to 3 days of ice storage) obtaining a QIM of 0 to 10; the mean QIM is 18 at 3 to 6 days; and after 9 days the QIM exceeds 25. The mean scores of day 12 are similar the results appear that the demerit points reached the limit on the 9th day, when members of the panel rejected the samples, making it unfit sensory Goldlined seabream Rhabdosargus sarba from the 9th day due to the presence of unpleasant odor in gill and flesh. Therefore, the panelists considered the samples of days 9 and 12 were similar. By the day 9 and 12 of storage, mesophilic count and psychrotrophilic count in whole Goldlined seabream Rhabdosargus sarba became more than 7 log10 CFU/g (ICMSF, 1986), which is higher than the maximally recommended limit in raw fish. In the final developed QIM scheme, all the parameters showed an increasing linear trend and were highly correlated (R > 0.577) with a time of ice storage (). For each storage day of sampling, QI was calculated and there was a linear relationship with storage time and there were highly correlated (R2 = 0.954) between the total QI for each storage day and days in ice was found with the slope of 8.06 (). The evaluation of QIM could be expressed by the linear equation QIM = 8.06× storage time-7.20, indicating a good adjustment of the experimental data. PLS model applied to data indicated that the regression model proposed had a standard error of estimate of approximately 6 days (6.258) (). Both measured and predicted values were statistically similar (p < 0.05).
Figure 1. Linear correlation between QIM and storage time of Goldlined seabream Rhabdosargus sarba during the ice storage.
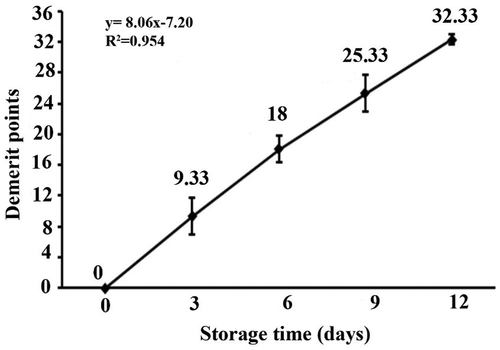
Figure 2. Partial least squares (PLS) regression for quality index method (QIM) of Goldlined seabream Rhabdosargus sarba during the ice storage and the predicted values.
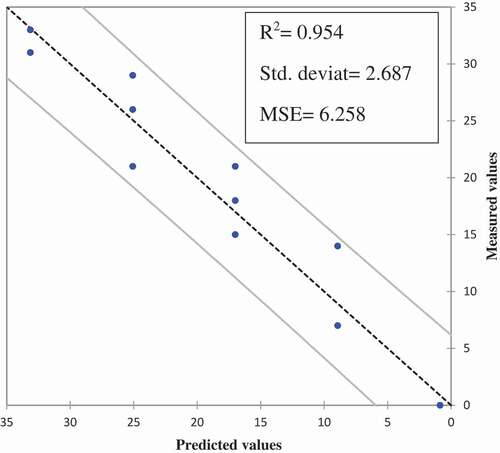
Figure 3. Average scores for each quality parameters assessed with the QIM scheme for Goldlined seabream Rhabdosargus sarba stored in ice and the correlation to days in ice: (A) Overall appearance; (B) Eye (C) Gill (D) Fins (E) Caudal fin (F) Dorsal (G) Abdomen (Internal) (H) Abdomen (outside) (I) Flesh.
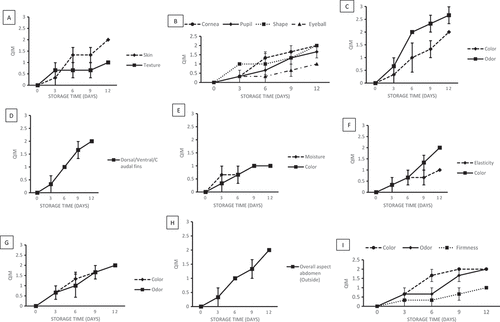
shows the progress of all parameters considered during storage. Generally, scores increased during the time of ice storage (), and this overall increase was always consistent and with low standard error. Generally, all quality attributes behave similarly during the storage period, without great changes.
Microbial analysis
The changes in the total mesophilic count (TMC), psychrotrophilic counts (PTC) and Enterobacteriaceae during storage are shown in . The TMC, PTC and Enterobacteriaceae counts for the Goldlined seabream Rhabdosargus sarba during the ice storage period correlated with time, yielding very high coefficients (0.900–0.979). The initial (day 0) mesophilic count (4.27 log CFU/g) indicates that the Goldlined seabream Rhabdosargus sarba was of lower quality due to the human handling of fish and storage conditions. TMC of the Goldlined seabream Rhabdosargus sarba showed that until the 6th day of storage there was no noticeable increase in the number of microorganisms. It should be noted, samples correspond to the lag phase of bacteria growth and changes in this period are mainly attributable to autolytic reactions, enzymatically mediated.[Citation6] The TMC exceeded the value of 7 log CFU/g on day 9, which is considered the upper acceptability limit for marine species.[Citation19] However, the specific bacteria that cause the spoilage of Goldlined seabream Rhabdosargus sarba have not been identified. Fish shelf life was subsequently determined using a regression analysis (mesophilic bacteria count = 0.874× storage time+ 3.02). Based on the regression equation, the mesophilic count limit would be reached on day 5 of storage. The initial PTC in the Goldlined seabream Rhabdosargus sarba was 2.62 log10 CFU/g. Gram and Huss (1996) reported that the Gram-negative psychrotrophic bacteria are the major group of microorganism responsible for spoilage of chilled stored fish and shellfish.[Citation20] Initial populations of Enterobacteriaceae were 2.99 log CFU/g after 12 days of storage, providing the safety of the fish sample. The counts of Enterobacteriaceae were no different compared those of other microbial classes, in agreement with results obtained for aquacultured meagre and shrimp stored in air by Hernández et al (2009) and Nirmal and Benjakul (2011), respectively.[Citation21,Citation22]
Table 2. Microbiological evaluation of Goldlined seabream Rhabdosargus sarba during ice storage (log CFU/g).
Physicochemical analysis
The changes in the TVBN, pH, TBARS and FFA values of Goldlined seabream Rhabdosargus sarba flesh during storage are shown in . TVBN showed a significant correlation with storage time, gradually increasing with each sampling day. According to Castro et al (2012) TVBN index is often used as a method in assessing the shelf life of seafood products.[Citation23] The initial TVBN value was 4.90 mg N/100g flesh and reached to 32.20 mg N/100g flesh after 12 days. The TVBN values increased slowly (p > 0.05) up to 3 days, but a rapid increase was observed from 6th day, which took it above the upper limit of consumption on day 12 (32.20 mg N/100g) and is agree with results found by Mokrani et al (2018) after the 13 days of storage values tended to increase.[Citation24] A rapid increase of TVBN may be related to the degradation of proteins and non-protein nitrogenous compounds. The increase of TVBN through time was in agreement with the microorganism activity during storage. The TVBN exceeded the value of 30 mg N/100g on day 12, which is considered the upper acceptability limit (30 mg N/100g) for fish.[Citation25] In this study, a linear increase (R = 0.782) was observed (TVBN content = 6.930× storage time) with time. Based on the regression equation, the results of the present study indicated that the TVBN level limit would be reached on day 4 of storage (30 mg N/100g/6.930 = storage time, storage time = 4.32 days). Changes in pH of fresh-Goldlined seabream Rhabdosargus sarba fillets are shown in . The pH of Goldlined seabream Rhabdosargus sarba on day 0 was 6.67, which was closed to the results by Cai et al (2014).[Citation26] pH values increased for 6 days and then decreased. pH did not correlate significantly with time. The formation of amines and ammonia derived from microbial activity and degradation of proteins and non-protein nitrogenous compounds lead to an increase in pH value,[Citation27] however, generation of lactic acid through lactic acid bacteria (LAB) metabolism and the release of inorganic phosphate by the degradation of adenosine triphosphate (ATP) during storage may be caused to decrease of pH value.[Citation28] TBA values first increased with the increase of storage time, and the highest values (1.39 mg MDA/kg) were obtained on day 9. Afterward, TBARS values decreased, which was consistent with the report of Nirmal and Benjakul (2011).[Citation22] The decrease of TBARS value was probably due to the reaction between malonaldehyde and amino acids, peptides and other compounds resulted from protein decomposition.[Citation29] The TBARS value showed no significant correlation during storage time. The maximum level of TBARS value indicating the good quality of the fish (frozen, chilled or stored with ice) is 1–2 mg MDA/kg.[Citation10] In this study, lower TBARS values were obtained (< 2 MDA/kg), which indicated low oxidative rancidity. The initial FFA value was 2.13 % of oleic acid and reached to maximum amount (7.46 % of oleic acid) at the 12th day of storage. The average FFA values remained relatively constant throughout the storage period, in spite of showing significant differences between certain days of the experiment. FFA showed a significant correlation with storage time. The increase of FFA may be attributed to the action of the psychrotrophic bacteria especially Pseudomonas spp can produce lipase and phospholipase causing an increase in FFA.[Citation22] There was a positive correlation between FFA and PTC (R = 0.518).
Table 3. Goldlined seabream Rhabdosargus sarba physicochemical parameter changes during ice storage.
Color analysis
Surface color parameters for the Goldlined seabream Rhabdosargus sarba are shown in . With the exception of Whiteness (W) (r = −0.529), all parameters defining Goldlined seabream Rhabdosargus sarba color showed no significant correlation with storage time, showing slight decreasing values towards the end of the storage time. The decrease of Lightness (L*) and W values could be an indication of oxidation of hemoglobin which increases the accumulation of brown-colored methemoglobin.[Citation30] After 12 days of ice storage, no significant changes were observed in hue (H°ab) values and chroma value (C*ab), indicating no reduction in color intensity and purity. TBA and FFA values were no significant correlated with color parameters. The a* (redness or greenness) and b* (yellowness or blueness) values of Goldlined seabream Rhabdosargus sarba were positive (yellow color) and had no significant difference at 12 days of ice storage. The W and L* values of fish showed no significant difference from day 0 to day 9 and increased until the end of storage. W and L* were significantly correlated with TVBN (r = −0.596 and r = −0.563, respectively). Correlation analysis of QIM parameters and color data showed that the clear change in flesh color and redness color of the fish observed by the sensory analysis was not easily detected by a colorimeter.
Table 4. Goldlined seabream Rhabdosargus sarba color parameters (a*, b*, L*, C*ab, Hºab, W) changes during ice storage.
Factorial analysis
The correlation between quality parameters using the principal components method for extracting factors produced four factors that explain 100% of the variance (). Factor 1 explains 41.602% of the variance, whilst factors 2, 3 and 4 represent 22.126%, 19.529% and 16.743% respectively. The variables most closely associated with factor 1 are TVBN, L, W, microbiological analysis and QIM with factor loadings of 0.978, -0.747, -0.827, 0.703-0.895 and 0.918, respectively. The storage time variable is significantly associated with factor 1, with a factor loading of 0.917. A common trait for the four PCA is that increased storage time is correlated to the loss of positive sensory attributes and increased physicochemical parameters and growth of microorganisms. The storage time variable is significantly associated with factor 1, with a factor loading of 0.898.
Table 5. Rotated factor loading matrix (VARIMAX) for the community attributes and values and factor statistics.
Conclusion
The QIM scheme developed for Goldlined seabream Rhabdosargus sarba stored at 0 ºC consisted of nine parameters giving a potential total of 34 demerit points. The quality index method on ice high linear correlation between QI and storage time on ice, making it possible to predict when whole Goldlined seabream Rhabdosargus sarba had to be fresh and acceptable for consumption. The shelf life of a whole (ungutted), ice-stored Goldlined seabream Rhabdosargus sarba according to bacteriological, physicochemical and sensory analysis and results of QIM is 9 days, period in which it is fit for consumption.
References
- Zeng, Q. Z.; Thorarinsdottir, K. A.; Olafsdottir, G. Quality Changes of Shrimp (Pandalus Borealis) Stored under Different Cooling Conditions. J. Food Sci. 2005, 70, 459–466. DOI: 10.1111/j.1365-2621.2005.tb11493.x.
- Huidobro, A.; Pastor, A.; Tejada, M. Quality Index Method Developed for Raw Gilthead Seabream (Sparus Aurata). J. Food Sci. 2000, 65, 1202–1205. DOI: 10.1111/jfds.2000.65.issue-7.
- Huss, H. H. Garantia da qualidade dos productos da pesca; Organização das Nações para Alimentação e Agricultura Unidase -FAO- Documento técnico sobre as pescas: Roma, 1997; Vol. 334, pp 176.
- Bremner, H. A.;. A Convenient, Easy to Use System for Estimating the Quality to Chilled Seafood. Fish Process. Bull. 1985, 7, 59–70.
- Cakli, S.; Kilinc, B.; Cadun, A.; Dincer, T.; Tolasa, S. Quality Differences of Whole Ungutted Sea Bream (Sparus Aurata) and Sea Bass (Dicentrarchus Labrax) while Stored in Ice. Food Control. 2007, 18, 391–397. DOI: 10.1016/j.foodcont.2005.11.005.
- Sant’Ana, L. S.; Soares, S.; Vaz-Pires, P. Development of a Quality Index Method (QIM) Sensory Scheme and Study of Shelf-Life of Ice-Stored Blackspot Seabream (Pagellus Bogaraveo). LWT -Food Sci. Technol. 2011, 44, 2253–2259. DOI: 10.1016/j.lwt.2011.07.004.
- Gram, L.; Dalgaard, P. Fish Spoilage Bacteria-Problems and Solutions. Curr. Opin. Biotechnol. 2002, 13, 262–266.
- Gonçalves, A. A.; de Lima, J. T. A. X.; de Paula, F. E. R. Development of Quality Index Method (QIM) Scheme for Spiny Lobster (Panulirus Argus, Latreille, 1804) Stored in Ice. Food Control. 2015, 47, 237–245. DOI: 10.1016/j.foodcont.2014.07.010.
- Ludorff, W.; Meyer, V. Fische und fischerzeugnisse; Paul parey verlag: Berlin, 1973; pp 95–111, 176–269.
- Moini, S.; Tahergorabi, R.; Hosseini, S. V.; Rabbani, M.; Tahergorabi, Z.; Feas, X.; Aflaki, F. Effect of Gamma Radiation on the Quality and Shelf Life of Refrigerated Rainbow Trout (Oncorhynchus Mykiss) Fillets. J. Food Prot. 2009, 72, 1419–1426.
- ISO. Sensory Analysis-General Guidance for the Selection, Training and Monitoring of Assessors. Part 1: Selected Assessors, 8586-1; The International Organization for Standardization: Genf, Switzerland, 1993; pp 1–10.
- Goulas, A. E.; Kontominas, M. G. Effect of Salting and Smoking-Method on the Keeping Quality of Chub Mackerel (Scomber Japonicus): Biochemical and Sensory Attributes. Food Chem. 2005, 93, 511–520. DOI: 10.1016/j.foodchem.2004.09.040.
- Masniyom, P.; Soottawat, B.; Visessanguan, W. Combination Effect of Phosphate and Modified Atmosphere on Quality and Shelf-Life Extension of Refrigerated Seabass Slices. J. Food Sci. Technol. 2005, 38, 745–756.
- Siripatrawan, U.; Noipha, S. Active Film from Chitosan Incorporating Green Tea Extract for Shelf Life Extension of Pork Sausages. Food Hydrocoll. 2012, 27, 102–108. DOI: 10.1016/j.foodhyd.2011.08.011.
- Woyewoda, A. D.; Shaw, S. J.; Ke, P. J.; Burns, B. G. Recommended Laboratory Methods for Assessment of Fish Quality. Canadian Technical Report of Fish and Aquatic Science, 1986, p 1448.
- Zar, J. H. In Biostatistical Analysis; McElroy, W., Swanson, P., Eds.; Prentice-Hall Inc: Englewood Cliffs, N.J., 1999; p 619.
- Alasalvar, C.; Taylor, K. D. A.; Öksüz, A.; Shahidi, F.; Alexis, M. Comparison of Freshness Quality of Cultured and Wild Sea Bass (Dicentrarchus Labrax). J. Food Sci. 2002, 67, 3220–3226. DOI: 10.1111/j.1365-2621.2002.tb09569.x.
- Botta, J. R.;. Sensory Evaluation: Freshness Quality Grading. In Evaluation of Seafood Freshness Quality; Botta, J. R., Ed.; VCH: New York, NY, 1995; pp 65e97.
- ICMSF. Microorganisms in Foods. The international commission on microbiological specifications for foods of the international union of biological societies; Blachwell Scientific Publications: Oxford, 1986.
- Gram, L.; Huss, H. Microbiological Spoilage of Fish and Fish Products. Food Microbiol. 1996, 33, 121–137. DOI: 10.1016/0168-1605(96)01134-8.
- Hernández, M. D.; López, M. B.; Álvarez, A.; Ferrandini, E.; García, B.; Garrido, M. D. Sensory, Physical, Chemical and Microbiological Changes in Aquacultured Meagre (Argyrosomus Regius) Fillets during Ice Storage. Food Chem. 2009, 114, 237–245. DOI: 10.1016/j.foodchem.2008.09.045.
- Nirmal, N. P.; Benjakul, S. Retardation of Quality Changes of Pacific White Shrimp by Green Tea Extract Treatment and Modified Atmosphere Packaging during Refrigerated Storage. Int. J. Food Microbiol. 2011, 149, 247–253. DOI: 10.1016/j.ijfoodmicro.2011.07.002.
- Castro, P.; Millán, R.; Penedo, J. C.; Sanjuán, E.; Santana, A.; Caballero, M. J. Effect of Storage Conditions on Total Volatile Bases Nitrogen Determinations in Fish Muscle Extracts. J. Aquatic Food Prod. Technol. 2012, 21, 519–523. DOI: 10.1080/10498850.2011.610917.
- Mokrani, D.; Oumouna, M.; Cuesta, A. Fish Farming Conditions Affect to European Sea Bass (Dicentrarchus Labrax L.) Quality and Shelf Life during Storage in Ice. Aquaculture. 2018, 490, 120–124. DOI: 10.1016/j.aquaculture.2018.02.032.
- Connell, J. J.;. Control of Fish Quality, 4th ed.; Fishing News Books Limited: London, 1995; pp 245.
- Cai, L.; Wu, X.; Dong, Z.; Li, X.; Yi, S.; Li, J. Physicochemical Responses and Quality Changes of Red Sea Bream (Pagrosomus Major) to Gum Arabic Coating Enriched with Ergothioneine Treatment during Refrigerated Storage. Food Chem. 2014, 160, 82–89. DOI: 10.1016/j.foodchem.2014.03.093.
- Tuckey, N. P. L.; Forster, M. E.; Gieseg, S. P. Effects of Rested Harvesting on Muscle Metabolite Concentrations and K-Values in Chinook Salmon (Oncorhynchus Tshawytscha) Fillets during Storage at 15 Degrees C. J. Food Sci. 2010, 75, C459eC464. DOI: 10.1111/j.1750-3841.2010.01648.x.
- Kaewprachu, P.; Osako, K.; Benjakul, S.; Rawdkuen, S. Effect of Protein Concentrations on the Properties of Fish Myofibrillar Protein Based Film Compared with PVC Film. J. Food Sci. Technol. 2016, 53, 2083–2091. DOI: 10.1007/s13197-016-2170-7.
- Kwon, T. W.; Menzel, D. B.; Olcott, H. S. Reactivity of Malonaldehyde with Food Constituents. J. Food Sci. 1965, 30, 808–813. DOI: 10.1111/j.1365-2621.1965.tb01845.x.
- Wetterskog, D.; Undeland, I. Loss of Redness (A*) as a Tool to Follow Hemoglobin-Mediated Lipid Oxidation in Washed Cod Mince. J. Agric. Food Chem. 2004, 52, 7214–7221. DOI: 10.1021/jf0307907.