
 ?Mathematical formulae have been encoded as MathML and are displayed in this HTML version using MathJax in order to improve their display. Uncheck the box to turn MathJax off. This feature requires Javascript. Click on a formula to zoom.
ABSTRACT
This study investigated the physicochemical, rheological and textural properties of nine types of honey from different regions of southern Tunisia. Principal component and cluster analyses were used to classify the honeys into groups. The physicochemical results (water, proteins, total soluble solids, pH, free acidity, water activity, electrical conductivity, invertase activity, Hydroxymethylfurfural (HMF), vitamin C, lycopene and anthocyanins) were in accordance with those of the standards Established by the Codex Alimentarius. The invertase activity varied from 62.58 units/kg to 110.24 units/kg. The HMF values of the different types of honey ranged from 11.48 mg/kg in prickly pear honey to 25.56mg/kg in heather honey. Anthocyanin contents, lycopene and vitamin C contents ranged between 8.38 and 24.86 μg/L, 1.08 to 6.17 mg/kg and 30.71 to 129.38 mg/kg, respectively. The flow test confirmed the Newtonian behavior of all honeys, and their textural properties had very high extrusion forces varying from 113.50 g to 131.05 g. Cluster analysis (CA) and the biplot generated through PCA recognized four groups of honeys based on either the physicochemical parameters or textural attributes and only three groups based on color and sugar.
Introduction
Honey made by the bees of the Apis mellifera species from the nectar of the flowers as well as from the honeydew has accompanied man as an invaluable remedy since ancient times.[1] Honey is a highly concentrated sugar solution, namely fructose and glucose. It also contains a wide range of minor compounds such as minerals, proteins, vitamins, organic acids, flavonoids, carotenoids.[Citation2,Citation3] In Tunisia, beekeeping has drawn the attention of both decision-makers and producers for economic reasons. Currently, there are 12000 beekeepers with 310000 beehives producing on average 1750T of honey per year.[Citation4] Honey has always been of much virtue in traditional medicine, through its use mainly in wound healing and bowel disease.[Citation5,Citation6]
Honeys have gained their merits owing to their antioxidant and antimicrobial properties.[Citation7–Citation14] Such properties are useful for the treatment of burns, gastrointestinal disorders, asthma, skin injuries and ulcers as well as many other therapeutic uses.[Citation15–Citation17] In a diversified melliferous flora, the distinction between the different honeys is made according to their composition which is directly dependent on the origin of nectar and honeydew, climate, environmental conditions and apiculture practice.[Citation18]
To avoid adulteration and preserve the quality of honeys, a number of analytical methods have been standardized by the International Honey Commission created in 1990.[Citation19] Examples of these physicochemical parameters are moisture, reducing sugar, pH, acidity, electrical conductivity, HMF and enzyme activities,[Citation20] which are used as criteria for determining the quality of honey.[Citation21–Citation25] To the best of our knowledge, the literature lack sin-depth studies on the quality of Tunisian southern honeys, namely sulla honey, heather, caraway, alfalfa, thistle, prickly pear, jujube, carob and almond tree, and their textural properties. The purpose of this work is therefore to characterize them in terms of physico-chemical, rheological and textural properties and to classify them based on some of these properties.
Materials and methods
Sampling
Nine samples of honeys were collected in 2015 from different regions of southern Tunisia. Details on the names and origin of the samples are given in . The samples were stored in sterile glass vials, hermetically sealed and kept at room temperature (20°C)in order to protect the bioactive compounds from degradation caused by heat and light.[Citation26]
Table 1. Honey samples and botanical origins from different regions of Tunisia.
The botanical origin of the samples was determined using techniques described before.[Citation27] For floral identification, 5 g of diluted honey sample was centrifuged at 10,000 rpm for 15 min, to separate the pollens. Samples of separated pollen grains were spread with the help of a brush on a slide containing a drop of lactophenol. The slides were examined microscopically at 45×, using a bright-field microscope (Olympus, Tokyo).
Determination of physicochemical parameters
Free acidity was determined using the AOAC method.[Citation28] pH was determined a Mettler Toledo (California.USA) pH meter, calibrated with buffer solutions at 3.7 and 9 pH values. In a 250-ml beaker, 10 g of honey was dissolved in 75 ml of distilled water at a temperature of about 80°C. The pH-meter electrodes were immersed in the honey solution. After pH reading, the solution is titrated with 0.1M sodium hydroxide solution to a pH value of 8.3.The water content was determined according to the Bogdanov’s method[Citation29] using a Carl Zeiss 16531 refractometer at 20°C. The corresponding water value was calculated according to the honey refractive index, referring to a standard reference table, while making the adjustment when needed. The determination of water activity (aw) was realized at 25 ± 0.02 ° C using an Aqua-Lab activity meter (Aqua-Lab CX2T, Decagon Devices, USA).
The electrical conductivity (EC) of a 20% (w/v) honey solution (dry matter) in ultrapure water was detected at 20 ° C, using a Consort conductivity meter, (Consort C830, Belgium). The EC measurement of a honey solution of 20 g dry matter in 100 mL of distilled water was conducted using an EC meter, based on the measurement of electrical resistance. The result is expressed in milli-siemens per centimeter ppm (mS.cm-1). The measurement method is described by Bogdanov et al.[Citation29]
The hydroxymethylfurfural analysis was determined according tothe International Honey Commission.[Citation19] It was performed in a clear aqueous solution filtered with honey using a reverse-phase HPLC (Shimatzu, Tokyo, Japan) equipped with a UV detector, Column: C18 grafted silica and a mobile phase: Water-methanol (90, 10: V/V). The signal was compared with the known concentration standards.
The determination of the analysis of the invertase activity followedthe International Honey Commission.[Citation19] P-Nitrophenyl-α-D-Glucopyranoside (pNPG) was used as a substrate for determining the sucrase number in honey, and divided into glucose and p-nitrophenol by α-glucosidase (invertase-sucrase). By adjusting the pH to 9.5, the enzymatic reaction was stopped and, at the same time, the nitrophenol was converted into the nitrophenolate anion. The latter corresponds to the sum of the substrate that was converted and determined by spectrophotometric reading at 400 nm. Five grams of honey were dissolved in a buffer solution, then the mixture was completed to the volume of 25 ml. Subsequently, 5 mL of the substrate solution was poured into a test tube and immersed in a 40 °C water bath for 5 min. A volume of 0.5 mL of the honey solution was added in the tube and mixed moderately after starting the stopwatch. After exactly 20 min, 0.5 ml of the inhibition solution was added, and then the solution was mixed again. Afterwards, a blank test was concurrently prepared under the same conditions but with the addition of the 0.5 mL of the honey solution at the end. The reading was undertaken at 400 nm after cooling the solution, without exceeding 15-min time. The results are expressed in international units (IU).
The sugar composition was determined by HPLC (Shimadzu, Tokyo, Japan) according to the method described by AOAC (1990) (HPLC/RID AOAC, 1990: 980–13/982–14). The separation of sugars was carried out on a column of NH2grafted silica, followed by a detection by differential refractometer (RID). Concentrations are calculated using the standard curve of four concentrations for each sugar type.
The proteins were analyzed according to the Kjeldahl method. The nitrogenous matter found in the test sample was mineralized by the action of concentrated sulfuric acid in the presence of a catalyst under the action of heat according to the AOAC method.[Citation30] Nitrogen is liberated in the form of ammonia, which in the presence of sulfuric acid, is present as ammonium sulphate. An excess of soda neutralizes the sulfuric acid and releases the ammonia that is carried by distillation into a solution of boric acid. The ammonia found in the distillate is measured with H2SO4 in the presence of a colored indicator. The protein content is obtained by multiplying the nitrogen content by 6.25.
Lycopene determination followed the method of Benakmoun et al.[Citation31] An amount of 0.1 g of the honey was introduced into 10 ml of hexane-acetone-ethanol (50/50/1). The mixture was stirred for 10 minutes and then centrifuged at 5000 rpm for 15 minutes. The organic phase was extracted and then diluted with 10 ml of hexane, and a sample of the organic phase was placed in a tank. The absorbance was measured at 472 nm.
The total monomeric anthocyanin concentration was determined by spectrophotometry Mettler Toledo (California, USA) using the differential pH method.[Citation32] The samples were diluted with an aqueous buffer solution of pH 1 and 4.5. The absorbance measurements were taken at visible maximum wavelengths of the mixture (520 nm) and at (700 nm). The absorbance of the diluted sample solution was then calculated according to the following formula:
The total monomeric anthocyanin concentration (mg/L) is calculated as follows
Total anthocyanin monomer (mg/L) = (2)
Mw: Molecular weight (cyadine-3-glucoside)(g/mol) = 449,2
DF: Dilution factor
E: Absorption coefficient of cyadine-3-glucoside = 26900L.mol−1cm−1
L: Optical path (1cm).
Ascorbic acid content
The ascorbic acid content was determined by the method described by Ferreira et al.[Citation33] In fact, a mass of 100 mg of the sample was mixed with 10 mL of metaphosphoric acid (1%) followed by an incubation for 45 min at room temperature. The solution was filtered through a filter paper of the Whatman No. 4 type. The filtrate (1 ml) was mixed with 9 ml of 2,6-dichlorophenolindophenol (0.005%) and the absorbance was measured at 515 nm for 30 minutes against a blank test. The ascorbic acid content was calculated based on a calibration curve for authentic L-ascorbic acid (50, 100, 200 and 400 μg/mL, Y = 3.253X −0.0703, R2 = 0, 9440), and the results are expressed in mg of ascorbic acid/kg of honey.
Color analysis
The color parameters (L, a and b) were determined by a colorimeter (CR-300, Minolta, Japan). Concerning L *that is the brightness parameter; it ranges from 0 (black) to 100 (white). As for a* parameter, it represents a shade of color between red and green with values ranging from −60 to + 60. With respect to b * axis, it represents a shade of color between yellow and blue with values ranging from −60 to + 60.
Rheological behavior
The rheological properties were measured using a rotational Rheolab-MC1 Rheometer (Physica, Germany) with a coaxial cylinder system (cone diameter was 15.18 mm and a diameter interval of 14.00 mm between the Cone and plate). The honey samples were heated to a temperature of 50°C for at least three hours to dissolve the crystals. Then, the samples were placed in the -measuring element of the rheometer and thermostat to reach the desired temperature. The measurements were conducted in the shear rate range from 0.001 to 100 s−1 at a constant temperature (25°C). In short, the measurement began immediately after 1 mL of honey was placed between the conical probe and the plate by recording a total of 50 points in 120 seconds. Each measurement was done in two triplicates on the same sample. The shear stress was determined as a function of the shear rate.
Instrumental texture analysis
The honey was transferred to a glass cell (70 mm in diameter and 80 mm in height). The back-extrusion test was measured using Texture Analyzer (Stable Micro Systems, Ltd., United Kingdom) equipped with a 50-N force sensor at ambient temperature (20°C) and controlled by an Expert TextureV1.22 software. The samples were subjected to compression using an aluminum cylinder probe of 50 mm in diameter at a speed of 0.50 mm/s for a distance of 15 mm. The textural parameters were detected from each force according to the displacement of the curve: maximum extrusion force (Fmax), extrusion work, cohesiveness and resilience. Each preparation was repeated in triplicate.
Statistical analysis
The statistical analysis was performed using one way analysis of variance (ANOVA) followed by Duncan’s test for means comparisons and a p-value of less than 0.05 was considered significant. The mean values of all parameters were determined according to the number of honeys samples and were repeated in triplicate. All statistical analyses were performed using SPSS (SPSS Inc., Chicago, IL), version 18.0.Principal Components Analysis (PCA) was performed using XLSTAT software, version 2008. Cluster Analysis was used to classify honeys with similar characteristics that are more similar to each other.
Results and discussion
Melissopalynological results
displays the floral origin of the honey samples observed by optic microscopy. The results revealed that all studied honey samples were supposed as monofloral honeys.[Citation27] Interestingly, carob honeys posses the highest value of pollen percentage (63.40%) followed by those of prickly pear honeys (61.64%). However, the lowest pollen percentages were observed in alfalfa and caraway honeys from Gabes and Kairouan regions, respectively. Moreover, Erica sp pollen at 55.70%, present the major pollen in heather honeys collected from Medenine regions. Similarly, almond and sulla honeys present 59.30% (prunus dulcis) and 59.02% (sulla coronaria) of total pollen collected from Sfax and Tozeur, respectively. Finally, jujuba and thistle honeys were 58.70% (Rhamnus) and 60.02% (Carduus rutans) of total pollen, respectively.
Physicochemical properties
lists the values of the physicochemical parameters of the nine tested honeys. The water content is a very important factor because it does not only allow the estimation of the maturity degree of the honey, but also provides information on its stability against fermentation and crystallization during storage.[Citation28] The values of the water content of the analyzed honeys varied between 12.93 and 17.23%. The statistical analyses showed that there was no significant difference between alfalfa and prickly pear honeys as well as between Caraway and sulla honeys (P > 0.05).On the other hand, heather honey had a significantly (P < 0.05) lower water content than the other tested honeys. These findings are in accordance with those found by Escuredo et al.[Citation21] A negative correlation between water content and activation energy (r = −0.724, P < 0.01) was also noted.
Table 2. Physicochemical parameters of the monofloral honey samples of Tunisian origin.
The protein content of honey from southern Tunisia ranged from 0.075 to 0.15g/100g, with the highest value found in jujube honey; a variation that is likely to be due to the floral type. Indeed, a significant difference between jujube and thistle honey in terms of protein content (P < 0.05) was observed. Although proteins and amino acids in honey are attributed to both animal and plant sources, including salivary gland fluids, nectar secretions and bee pharynx, and the pollen are the main source of protein.[Citation17]
pH is an important parameter during honey extraction and storage, which affects its texture, stability and shelf life.[Citation29] pH values of Tunisian honeys ranged from 3.45 to 4.63 (). The statistical analyses showed no significant difference between the pH of thistle, alfalfa, and prickly pears as well as that of the caraway, jujube, carob and sulla honey (p > 0.05). Nevertheless, there is a significant difference between the pH of heather and almond honey (P < 0.05). A strong positive correlation between pH and luminosity L * (r = 0.944, P < 0.01) was obtained.
The values of the free acidity of southern Tunisian honey have shown highly significant differences between the samples (p < 0.05). These variations are observed in terms of geographic region and floral origin.[Citation34] The free acidity of honey varied from 13.37 to 20.21 meq/kg honey with carob and sulla honeys having the highest values and heather honey the lowest one(13.37meq/kg). The free acid values obtained were within the normal range set by Codex Alimentarius (2001) of 40meq/kg, indicating the absence of undesirable fermentation. These values are in agreement with those obtained by Bogdanov et al, Ajlouni and Sujirapiryokul, and Perez-Arquillue et al. but are contradictory with those of Algerian honeys (19.56 to 38.91 meq/kg).[Citation29,Citation35–Citation37]
The water activity values of Tunisian honeys ranged from 0.57 to 0.62, indicating significant differences between the honey samples (P > 0.05). These values are in accordance with those reported by many previous studies.[Citation34,Citation38,Citation39] Low water activity values indicate good stability of honey samples, and had an influence on the extraction of honey and storage conditions, as well as its texture, stability and shelf life.[Citation34]
The honey’s apparent viscosity results showed that all tested honey samples were significantly different (P < 0.05), and ranged from 40.59 in Jujube to 167.5 Pa.s in heather honeys. Our findings are in the same range of Galician honeys (9.9 Pa.s to 200 Pa.s).[Citation40,Citation41] The values of the apparent viscosity of the honey depend on its water content, chemical composition and storage temperature.[Citation42–Citation46] A positive correlation was also found between the viscosity and the activation energy (Ea) (r = 0.804, P < 0.01).
The electrical conductivity of the Tunisian honeys ranged from 0.31 to 0.59 mScm−1. The statistical analyses showed that there was no significant difference between carob, thistle and sulla honey at (P > 0.05) and between heather, prickly pear, jujube and almond honeys at (P > 0.05). Nevertheless, a significant difference between alfalfa and caraway honeys (P < 0.05) was observed. Actually, alfalfa honey showed a higher electrical conductivity value (0.59 mS cm-1), compared to the other tested honey. These results agree well with those found by previous studies carried out by.[Citation29,Citation47,Citation48]
Hydroxymethylfurfural is a fructose degradation sugar, naturally present in all honeys as traces at harvesting.[Citation49,Citation50] This content increases with the honey heating and aging.[Citation50] In the present study, HMF contents of Tunisian honeys ranged from 11.48 to 25.55 mg/kg. Indeed, the highest concentration in HMF was detected in heather honeys followed by alfalfa and caraway. The statistical analyses showed no significant differences between prickly pear, jujube and thistle honeys, between heather and alfalfa honey, and between almond, sulla and carob honeys (P > 0.05). However, there was a significant difference between heather, caraway and almond honeys. All honey samples had a lower HMF value than the mentioned limit and no honey had values greater than 40 mg/kg. Several factors, such as storage conditions and floral sources, influence the HMF formation.[Citation34,Citation49,Citation51] Similarly, it is well known that heating honey results in the HMF formation, produced during the catalyzed dehydration of the hexose acid, as fructose and glucose.[Citation52,Citation53]
The activity of invertase is a freshness indicator, whose level depends on geographical and floral origins.[Citation54,Citation55] The values of invertase activity varied from 62.58 to 145.37 units/kg (). The statistical analysis showed that the invertase activity differs significantly (p < 0.05) between the different honeys. These results are consistent with those reported by other studies,[Citation56–Citation58] which evaluated the activity of invertase in nectar honeys. Invertase is a natural honey enzyme that is commonly used as a determining factor of honey freshness, whose level decreases with honey heating and aging.[Citation59] It is worthwhile to mention is that the statistical study showed a positive correlation (r = 0.730, P < 0.01) between the activity of invertase and lycopene.
shows the anthocyanin and lycopene contents in the different honey samples. Anthocyanin values ranged from 8.38 to 24.86 μg/kg and the highest value was found in alfalfa honey followed by that of prickly pear. These results show a significant variation between the examined honeys (P < 0.05), in agreement with those reported by Alqarni, et al.[Citation60]The lycopene content showed a significant difference between the samples (P < 0.05) and ranged between 1.08 carob honey and 6.17 mg/kg for caraway honey. These values were consistent with those reported by Ferreira et al.[Citation33]
The ascorbic acid content in the southern Tunisian honeys ranged from 30.71 to 129.38 mg/kg. While the lowest value was recorded in the almond honey, the highest was found in the prickly pear honey. These results are low compared to those reported by Moniruzzman et al. and Ferreira et al.[Citation33,Citation61] In fact, a study by Wang et al.[Citation62] has reported that the concentration of vitamin C is probably influenced by the extraction mode and the preservation method.
Principal component analysis and cluster analysis
The results of the physicochemical parameters (pH, acidity, water content, water activity, etc.) of the monofloral honeys of Tunisian origin were subjected to a principal component analysis F1 (33.59%) and F2 (23.79%), only explaining 57.35% of the total variance (). The loading-plot analysis showed that the axis of the first main component (F1) was positively correlated with pH, free acidity, total soluble solids content, electrical conductivity, viscosity, while the HMF were negatively correlated with water content, protein content, water activity, vitamin C content, lycopene, activity of invertase and anthocyanin. The axis of the second main component (F2) was found to be positively correlated with water content, electrical conductivity, water activity, vitamin C content, anthocyanin, whereas the HMF contents were negatively correlated with pH, total soluble solids content, acidity, protein content, viscosity, lycopene and activity of invertase.
Figure 1. Principal component analysis (PCA) of the physicochemical properties of southern Tunisian honeys.
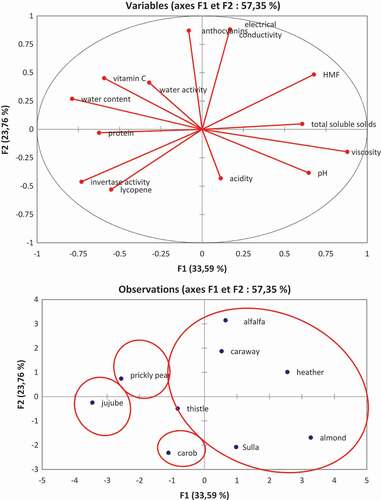
By examining the plot score of the and cluster analysis of the , the honeys samples were divided into four groups. Concerning the first group, it is composed of the alfalfa, caraway, heather, thistle and types, which is positively correlated with electrical conductivity, anthocyanin, total soluble solids content and HMF. As for the second group, it is composed of jujube honey, which is negatively correlated with enzymatic activity, protein content, water content, water activity, and vitamin C content. With respect to the third group, it comprises carob honey, which is correlated with the activity of invertase and lycopene. Finally, the fourth group is made up of prickly pear honey and is negatively correlated with enzymatic activity, protein content, water content, water activity, and vitamin C content.
Figure 2. Cluster analysis of the physicochemical properties of southern Tunisian honeys.
Color parameters
Color is the physical property that is immediately perceived by the consumer. It is a useful criterion for the classification of monofloral honeys. The color parameters of the Tunisian honeys are illustrated in . The luminosity values L * were significantly different from one honey sample to another (P˂0,05) and varied from 25.42 to 63.19. The lowest luminosity values were observed in alfalfa and thistle honey with 25.42 and 25.58, respectively. While the green color parameter (-a*) was present in heather honey, while thistle showed the highest value of the reddish (+a*) color parameter followed by the alfalfa honey. The values of the reddish color parameter (+a*) showed great variability in the different honey samples. Thus, the lowest value (2.71) was noted in heather honey and the highest value (10.75) in thistle honey. The yellow color parameter (+b*) showed also a great variation with values of b* varying between 16.29 and 42.97, corresponding to jujube and almond honeys, respectively.[Citation63]
Table 3. Color parameters (L *.a * andb *) of the monofloral honeys samples of Tunisian origin.
Biochemical characteristics
Sugar composition
The composition in sugars, which depends mainly on the floral and geographical origins, may contribute to the distinction of monofloral honeys.[Citation64] However, many authors have affirmed that the composition in sugars alone is not sufficient to distinguish honey.[Citation61] The results of the sugar composition of the studied honeys are summarized in . Four sugars were identified, namely fructose, glucose, sucrose and maltose in the monofloral honeys of Tunisian origin. The results substantiate that all honey samples contain fructose and glucose, with values varying from 34.33 to 38.18% and 30.38 to 35.51%, respectively. Moreover, the different honeys exhibited significant differences in terms of glucose and fructose concentration (P˂ 0.05), in agreement with Mateo and Bosch-Reig, Fuente et al., Devillers et al.[Citation22,Citation65,Citation66] A high content of fructose was detected in thistle honey, whereas the lowest value was noted in almond honey.
Table 4. Composition in sugar of the monofloral honey samples of Tunisian origin.
In addition, prickly pear honey has a significantly higher content of sugars than the other honeys (P < 0.05), which is in good agreement with the findings of Manzoor et al.[Citation67] The total glucose and fructose content varied between 64.71% and 73.69%, exceeding 60 g/100 g of honey, which is in conformity with the 110/2001 Directive of the European Community.
Sucrose and maltose were at low levels in all samples and varied from 2.28 to 4.48% and 0.00 to 3.99%, respectively Similar results were reported in previous researches.[Citation35,Citation65] Our results clearly confirms that Tunisian honeys are similar to those of Spanish, Australian and Moroccan origin.[Citation68] It is well known that to clarify the crystallization potential of honey, it is requisite to identify the sugars and glucose/water and fructose/glucose ratios.[Citation69] Besides, all examined honey samples of the southern Tunisia were in the liquid state and the fructose/glucose ratio was superior to 1.[Citation70]
Principal component analysis and cluster analysis
The results of the color parameters and the obtained sugars in the 9 types of monofloral honeys of Tunisian origin were subjected to a principal component analysis F1 (40.01%) and F2 (24.40%), (64.41%) of the total variance. The loading-plot analysis showed that the axis of the first main component (F1) is positively correlated with L* and b*, and negatively correlated with fructose, glucose, sucrose, maltose and parameter a*. The axis of the second main component (F2) is positively correlated with fructose, glucose, maltose, reducing sugar and a*, L* and b*, and negatively correlated with sucrose.
By examining the plot score of and cluster analysis of , the studied honeys samples were divided into only three groups. The first group, it is formed by the almond type, which is positively correlated with the parameter L* and b*. The second group is comprised by caraway, heather, carob, jujube, prickly pear, thistle, sulla honeys, and are negatively correlated with maltose and fructose. The third group is composed of alfalfa honey, and is negatively correlated with glucose and a* parameter.
Figure 3. Principal component analysis (PCA) of color parameters and sugars of southern Tunisian honeys.
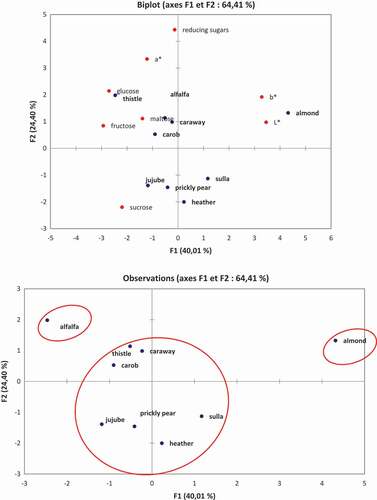
Figure 4. Cluster analysis of color parameters and sugar of southern Tunisian honeys.
Rheological properties
The shear stress evolution was monitored as a function of the shear rate of monofloral honeys of Tunisian origin, with shear rates varying from 0.001 to 100 s −1. Flow curves were obtained for each type of honey (heather, alfalfa, thistle, sulla, jujube, almond, carob, prickly pear and caraway). shows that all tested honey samples exhibit Newtonian behavior at shear rates ranging from 0.001 to 100 s −1 at 25°C. Hence, a linear relationship exists between the shear stress and the shear rate, which is in accordance with Newton’s law given by the following equation:
Figure 5. Analysis of the main components of the textural parameters and the activation energy of honeys of Tunisian origin (heather, alfalfa, caraway, almond, thistle, jujube, carob, sulla and prickly pear) .
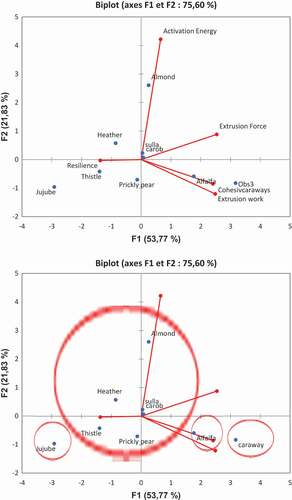
Figure 6. Cluster analysis of the textural parameters and the activation energy of southern Tunisian honeys.
Figure 7. Flow curve: shear stress as a function of shear rate of monofloral honeys of Tunisian origin at 25 ° C.
Where σ is the shear stress (Pa), is the shear rate s−1 and μ is the apparent viscosity of the honey (Pas). The viscosity values at 25 ° C may be obtained from the curve using the slope of the line formed by the shear stress as a function of the shear rate. The lowest viscosity was exhibited by the jujube honey, and the highest by almond honey. The honey viscosity depends on its water content, its origin and its chemical composition.[Citation64,Citation71] The results of this study are in accordance with those reported by several researchers.[Citation72,Citation73] but in contradiction with Juszczak and Fortuna[Citation74] and Dobre et al.[Citation64] who reported a non-Newtonian behavior for heather honey and rapeseed honey respectively.
Effect of temperature on the viscosity of honeys
The results of the apparent viscosity as a function of honey temperature are also studied. Thus, the shear viscosity was found to decrease with the increase in the heating temperature from 25 to 70°C. Furthermore, the viscosity of all Tunisian honey samples showed an exponential decrease with the increase in temperature, but the latter did not affect the Newtonian behavior.
It is worthy to mention that while the greatest variation in viscosity between the different types of honey was observed at 25°C, the smallest ones were noted at temperatures equal to 55 and 70°C. These findings are in agreement with honeys from Australian.[Citation43,Citation45] The decrease in the honey viscosity can be attributed to the high thermal movement of molecules, which lead to a reduction in the intermolecular forces, making the flow more easily and subsequently reducing the viscosity. This phenomenon is consistent with those found in the literature.[Citation45,Citation73,75] The effect of temperature on the honeys’ viscosity was evaluated by applying the Arrhenius law described by the following expression:
Where,
µ: apparent viscosity (Pas);
A: viscosity coefficient independent of temperature (Pas);
Ea: activation energy (J/mol);
R: ideal gas constant (8.32J/mol °°K);
T: absolute temperature (° K).
By applying the natural logarithm on the last expression, the following equation is obtained:
The activation energy (Ea) can be used to measure the sensitivity of apparent viscosity to the temperature changes, and can be determined from the slope Ln μ as a function of 1/T after linearization. Generally, the higher activation energy value reflects the stability of the honeys viscosity. As shown in , the activation energy (Ea) values ranged from 31.75 to 70.99 kJ/mol, with the highest value found in almond honey (P < 0.05) followed by heather, sulla, carob, alfalfa, caraway, prickly pear, thistle and finally jujube (P < 0.05). Moreover, Cohen and Weihs[75] have reported that the activation energy (Ea) is composition-dependent, and it decreases linearly with the increase in moisture content. As previously reported, the individual mono-di-trisaccharides content is another factor that is as important as the activation energy (Ea).[Citation40,Citation42,Citation73,75]
Table 5. Arrhenius law parameters of the monofloral honey samples of Tunisian origin.
Textural analyses
The measurements of the various textural parameters of the honeys are summarized in . The values of the extrusion force varied from 113.5 to 131 g with that of caraway honey was significantly higher (P < 0.05) than that of the other analyzed honeys. For the extrusion work or consistency, the mean values were very high varying between 695.63 to 869.06gs, with caraway honey having the highest value. The resilience mean values were very low ranging from 0 to 0.5, without any significant difference between the samples (P > 0.05).
Table 6. Textural parameters of the different types of monofloral honeys of Tunisian origin.
Principal component analysis and cluster analysis
The results pertaining to the textural parameters obtained on the 9 monofloral honeys of Tunisian origin were subjected to a principal component analysis F1 (53.77%) and F2 (21.83%), which only explain 75, 60% of the total variance (). The loading-plot showed that the axis of the first main component (F1) was positively correlated with the extrusion force, cohesiveness, extrusion work. It also revealed that the activation energy was negatively correlated with the resilience. The axis of the second main component (F2) was positively correlated with the extrusion force, resilience and activation energy and negatively correlated with extrusion work and cohesiveness.
By examining the plot score of and cluster analysis of , honey samples are separated into only four groups. The first group is made up by heather, almond, sulla, carob, thistle and prickly pear. This group is correlated positively with the activation energy and resilience. The second group is formed by jujube honey, and is not correlated with the different parameters. The third group consists of alfalfa honey and is positively correlated with the extrusion force. The fourth groups comprise alfalfa and is positively correlated with the extrusion work and cohesiveness.
Conclusion
The present study determined the characteristics of 9 types of Tunisian honeys harvested from different regions. The results showed that all honeys meet the standards required by the Codex Alimentarius. All examined honey samples were found to have Newtonian behavior. The textural analyses showed that all tested samples had higher extrusion force values. Each of the analyzed parameters accurately indicates the quality of the honey. Thus, they can be classified into three groups: those determining maturity (water content), those indicating floral origin (electrical conductivity, pH) and those showing freshness (HMF and invertase activity).Cluster analysis did not give the same groups for the analysis of physicochemical, color, sugar and textural properties. Indeed, cluster analysis yielded four groups for physicochemical properties, three groups for color and sugar analysis, and four groups for textural analysis. However, this difference is probably due to the composition of the honey itself in turn depends on many factors, such as: the nature of the soil, the breed of bees and the physiological state of the colony. Other factors also affect the composition and nature of honey and its particularities such as: The floral origin of food; Environmental climate, the season of bee rearing and honey production; The mode of honey extraction; The duration and storage conditions, such as temperature and light, condition the activity of honey enzymes and their effectiveness.
Acknowledgments
The authors would like to express their sincere gratitude to Miss. Leila MAHFOUDHI from the English Language Unit at the Faculty of Science of Sfax, Tunisia for his constructive proofreading and language editing services. The authors declare that they do not have any conflict of interesting.
Additional information
Funding
References
- Codex Alimentarius Commission Standard. Codex Standard for Honey, 2001.
- Azeredo, L. D. A. C.; Azeredo, M. A. A.; DE Souza, S. R.; Dutra, V. M. L. Protein Contents and Physicochemical Properties in Honey Samples of Apis Mellifera of Different Floral Origins. Food Chem. 2003, 249–254. DOI:10.1016/S0308-8146(02)00261-3.
- Ouchemoukh, S.; Louaileche, H.; Schweitzer, P. Physicochemical Characteristics and Pollen Spectrum of Some Algerian Honeys. Food Control. 2007, 18, 52–58. DOI: 10.1016/j.foodcont.2005.08.007.
- Mahouachi, M. APIA. 2008, République Tunisienne Ministère de l'agricultutre et des ressources Hydrauliques.
- Taormina, P. J.; Niemira, B. A.; Beuchat, L. R. Inhibitory Activity of Honey against Foodborne Pathogens as Influenced by the Presence of Hydrogen Peroxide and Level of Antioxydant Power. Int. J. Food Microbiol. 2001, 69, 217–225.
- Basualdo, C.; Sgroy, V.; Finola, M. S.; Marioli, J. M. Comparison of the Antibacterial Activity of Honey from Different Provenance against Bacteria Usually Isolated from Skin Wounds. Vet. Microbiol. 2007, 124(3–4), 375–381. DOI: 10.1016/j.vetmic.2007.04.039.
- Martos, I.; Ferreres, F.; Yao, L.; D’Arcy, B.; Caffin, N.; Tomás-Barberán, F. A. Flavonoids in Monospecific Eucalyptus Honeys from Australia. J. Agric. Food Chem. 2000, 48, 4744–4748. DOI: 10.1021/jf000277i.
- AL-Mamary, M.; Al-Meeri, A.; AL-Habori, M. Antioxydant Activities and Total Phenolics of Differents Types of Honey. Nutr. Res. 2002, 22, 1041–1047. DOI: 10.1016/S0271-5317(02)00406-2.
- Kaskoniené, V.; Venskutonis, P. R.; Ceksteryte, V. Carbohydrate Composition and Electrical Conductivity of Different Origins Honeys from Luthuania. LWT. Food Sci. Technol. 2000, 43, 801–807. DOI: 10.1016/j.lwt.2010.01.007.
- Bertoncelj, J.; Dobersek, U.; Jamnick, M.; Golob, T.; Bhuiyan, K. H.; Hossain, M. M.; Bari, M. N.; Khanam, M. R.; ; . 2002. Identification of Bee Plants and Analysis of Honey Collected from Different Plant Sources Pakistan. J. Biol. Sci. 2007, 5(11), 1199–1201.
- Silici, S.; Sagdic, O.; Ekici, L. Total Phenolic Content, Antiradical, Antioxidant and Antimicrobial Activities of Rhododendron Honeys. Food Chem. 2010, 121, 238–243. DOI: 10.1016/j.foodchem.2009.11.078.
- Saxena, S.; Gautam, S.; Sharma, A. Physical, Biochemical and Antioxidant Properties of Some Indian Honeys. Original Research Article. Food Chem. 2010, 118, 391–397. DOI: 10.1016/j.foodchem.2009.05.001.
- Gulzar, A. N.; Nanda, V. Effect of Thermal Treatment and pH on Antioxydant Activity of Saffron Honey Using Response Surface Methodology. J. Food Meas. Characterization. 2015, 10(1), 64–70.
- Boussaid, A.; Chouaibi, M.; Rezig, L.; Hellal, R.; Donsıa, F.; Ferrari, G.; et al. Physicochemical and Bioactive Properties of Six Honey Samples from Various Floral Origins from Tunisia. Arabian J. Chem.. 2014. DOI: 10.1016/j.arabjc.2014.08.011.
- Estevinho, L.; Pereira, A. P.; Moreira, L.; Dias, G. L.; Preira, E. Antioxydant and Antimicrobial Effects of Phenolic Compounds Extracts of Northeast Portugal Honey. Food Chem. Toxicol. 2008, 46, 3774–3779. DOI: 10.1016/j.fct.2008.09.062.
- Rybak-Chmielewska, H.;. Changes in the Carbohydrate Composition of Honey Undergoing during Storage. J. Apicultural Sci. 2007, 51, 39–48.
- Escuredo, O.; Miguez, M.; Fernandez-Gonzalez, M.; Selio, M. C. Nutritional Value and Antioxidant Activity of Honeys Produced in a European Atlantic Area. Food Chem. 2013, 138, 851–856. DOI: 10.1016/j.foodchem.2012.11.015.
- Da Costa Leite, J.; Trugo, I. C.; Costa, I. S.; Quinteiro, I. M. C.; Barth, O. M.; Dutra, V. Dertemination of Oligosaccharides in Brazilian Honeys of Different Botanical Origin. Food Chem. 2000, 70, 93–98. DOI: 10.1016/S0956-7135(99)00115-2.
- International Honey Commission. 1990, Harmonised methods of the European Honey Commission published in Apidologie, extra issue, 1997, 1-59.
- Bentabol, A.; Hernandez-Garcia, Z.; Rodriguez-Galdon, E.; Diaz-Romero, C. Differentiation of Blossom and Honeydew Honeys Using Multivariate Analysis,On the Physicochemical Parameters and Sugar Composition. Food Chem. 2011, 126, 664–672. DOI: 10.1016/j.foodchem.2010.11.003.
- Escuredo, O.; Fernandez-Gonzalez, M.; Serjo, C. Differentiation of Blossom Honey and Honeydew Honey from Northwest Spain. Agriculture. 2012, 2, 25–37. DOI: 10.3390/agriculture2010025.
- Mateo, R.; Bosch-Reig, F. Classification of Spanish Unifloral Honeys by Discriminant Analysis of Electrical Conductivity, Color, Water Content, Sugars and pH. J. Agric. Food Chem. 1998, 46, 393–400.
- Sanz, M. L.; Gonzalez, M.; de Lorenzo, C.; Sanz, J.; Martinez,-Castro, I. A Contribution to the Differentiation between Nectar Honey and Honeydew Honey. Food Chem. 2005, 91, 313–317. DOI: 10.1016/j.foodchem.2004.06.013.
- Soria, A. C.; Gonzalez, M.; de Lorenzo, C.; Martinez-Castro, I.; Sanz, I. Characterization of Artisanal Honeys from Madrid (Central Spain) Based on Their Melissopalynology, Physicochemical and Volatile Composition Data. Food Chem. 2004, 86, 305–312.
- Vela, L.; De Lorenza, C.; Perez, R. Antioxidant Capacity of Spanish Honeys and Its Correlation with Polyphenol Content and Other Physicochemical Properties. J. Sci. Food Agric. 2007, 87, 1069–1075. DOI: 10.1002/jsfa.2813.
- Lutier, P. M.; Vassière, B. An Improved Method for Pollen Analysis of Honey. Rev. Palaeobot. Palynol. 1993, 78, 129–144. DOI: 10.1016/S0308-8146(02)00189-9.
- AOAC, Official Methods of analysis of AOAC International, 17th ed. Association of official Analytical chemists, 2000. Virginia.USA: Arlington.
- Bogdanov, S.; Martin, P.; Lüllmann, C. Harmonised Methods of the European Honey Commission. Apidologie. 2009, extra issue, 1–59, http://www.ihc-platform.net/ihcmethods2009.pdf (Accessed 15 June 2014).
- AOAC, Official Methods of Analysis of AOAC International, 16th ed. Association of official Analytical chemists, 1990. Washingthon,D.C. USA.
- Benakmoum, A.; Abbeddou, S.; Ammouche, A.; Kefalas, P.; Gerasopoulos, D. Valorization of Low Quality Edible Oil with Tomato Peel Waste. Food Chem. 2008, 110, 684–690. DOI: 10.1016/j.foodchem.2008.02.063.
- Giusti-Alonso, M. M.; Wrolstad, R. Current Protocols. In Food Analytical Chemistry; Wrostade, R. E., Ed.; John Wiley and Sons: New york, NY, 2001; pp 1–13.
- Ferreira, I. C. F. R.; Aires, E.; Barreira, J. C. M.; Estevinho, L. M. Antioxydant Activity of Portuguese Honey Samples: Different Contributions of the Entire Honey and Phenolic Extract. Food Chem. 2009, 114, 1438–1443. DOI: 10.1016/j.foodchem.2008.11.028.
- Terrab, A.; Dıez, M. J.; Heredia, F. J. Characterisation of Moroccan Unifloral Honeys by Their Physicochemical Characteristics. Food Chem. 2002, 79, 373–379. DOI: 10.1016/S0308-8146(02)00189-9.
- Ajlouni, S.; Sujirapinyokul, P. Hydroxymethylfurfuraldehyde and Amylase Contents in Australian Honey. Food Chem. 2010, 119, 1000–1005. DOI: 10.1016/j.foodchem.2009.07.057.
- Perez-Arquillué, C.; Conchello, P.; Arin˜, O. A.; Juan, T.; Herrera, A. Quality Evaluation of Spanish Rosemary (Rosmarinus Officinalis) Honey. Food Chem. 1994, 51, 207–210. DOI: 10.1016/0308-8146(94)90258-5.
- Doukani, K.; Gacema, N.; Berlarbi, H. Physicochemical and Phytochemical Characterization of Some Algerian Honeys Types. J. Appl. Phys. Biochemistry Res. 2014, 4, 2277–4793.
- AL-Khalifa, A. S.; AL- Arify, I. A. Physicochemical Characteristics and Pollen Spectrum of Some Saudi Honeys. Food Chem. 1999, 67, 21–25. DOI: 10.1016/S0308-8146(99)00096-5.
- Andrade, P.; Ferreres, F.; Gil, M. I.; Tomas, A. Analyses of Honey Phenolic Acids byHPLC, Its Application to Honey Botanical Characterization. J. Liquid Chromatogr. Relat. Technologies. 1999, 20, 2281–2288. DOI: 10.1080/10826079708006563.
- Lazaridou, A.; Biliaderis, C. G.; Bacandritsos, N.; Sabatini, A. G. Composition, Thermal and Rheological Behavior of Selected Greek Honeys. J. Food Eng. 2004, 64, 9–21. DOI: 10.1016/j.jfoodeng.2003.09.007.
- Gómez-Díaz, D.; Navaza, J. M.; Quintáns-Riveiro, L. C. Rheological Behaviour of Galician Honeys. Eur. Food Res. Technol. 2006, 222, 439–442. DOI: 10.1007/s00217-005-0120-0.
- Al-Malah, K. I. M.; Abu-Jdayil, B.; Zaitoun, S.; AL-Majeed Ghzawi, A. Application of WLF and Arrhenius Kinetics to Rheology of Selected Dark-Colored Honey. J. Food Eng. 2001, 24, 341–357. DOI: 10.1111/j.1745-4530.2001.tb00548.x.
- Mossel, B.; Bhandari, B.; D’arcy, B.; Caffin, N. Use of Arrhenius Model to Predict Rhéological Behaviour in Some Australian Honeys. LWT- Food Sci. Technol. 2000, 33(8), 545–552. DOI: 10.1006/fstl.2000.0714.
- Sopade, P. A.; Bhandari, B.; Halley, P.; DArcy, B.; Doebler, C.; Caffin, N. Glass Transition in Australian Honeys. Food Aust. 2001, 53(9), 399–404.
- Sopade, P. A.; Halley, P.; Bhandari, B.; DArcy, B.; Doebler, C.; Caffin, N. Application of the Williams–Landel–Ferry Model to the Viscosity–Temperature Relationship of Australian Honeys. J. Food Eng. 2002, 56, 67–75. DOI: 10.1016/S0260-8774(02)00149-8.
- Zaitoun, S.; Al-Majeed Ghazwi, A.; Al-Malah, K. I. M.; AbuJdayil, B. Rheological Properties of Selected Light Colored Jordanian Honey. Int. J. Food Properties. 2001, 4, 139–148. DOI: 10.1081/JFP-100002192.
- Escriche, I.; Visquert, M.; Juan-Borras, M.; Fito, P. Influence of Simulated Industrial Thermal Treatments on the Volatile Fractions of Different Varieties of Honey. Original Research Article. Food Chem. 2009, 112, 329–338. DOI: 10.1016/j.foodchem.2008.05.068.
- Fea, S. X.; Pires, J.; Iglesias, A.; Estevinho, M. L. Characterization of Artisanal Honey Produced on the Northwest of Portugal by Melissopalynological and Physico-Chemical Data. Food Chem. Toxicol. 2010, 48, 3462–3470. DOI: 10.1016/j.fct.2010.09.024.
- Fallico, B.; Zappala`, M.; Arena, E.; Verzera, A. Effects of Conditioning on HMF Content in Unifloral Honeys. Food Chem. 2004, 85, 305–313. DOI: 10.1016/j.foodchem.2003.07.010.
- Marceau,J.; Noreau,J.; Houle,E. Les HMF et les qualités du Miel. The Autumn Bee. 1994, 15(2).
- Meda, A.; Lamien, C. E.; Romito, M.; Millogo, J.; Nacoulma, G. Determination of the Total Phenolic, Flavonoid and Proline Contents in Burkina Fasan Honey, as Well as Their Radical Scavenging Activity. Food Chem. 2005, 91, 571–577. DOI: 10.1016/j.foodchem.2004.10.006.
- Duman, A.; Sezer, C.; Oral, N. B. Kars’ta Satis a Sunulan Suzme Ballarin Kalite Niteliklerinin Aras tirilmasi. Kafkas Universitesi Veteriner Fakultesi Dergisi. 2008, 14, 89–94.
- Tosi, E.; Martinet, R.; Ortega, M.; Lucero, H.; Re, E. Honey Diastase Activity Modified by Heating. Food Chem. 2008, 106, 883–887. DOI: 10.1016/j.foodchem.2007.04.025.
- Eu,Council Directive 2001/110 relating to honey. Official Journal of the European Communities. 2001.
- Sancho, M. T.; Muniategui, S.; Huidobro, J. F.; Simal, J. Evaluating Soluble and Insoluble Ash Alkalinity of Soluble and Insoluble Ash and Total Alkalinity of Ash in Honey Using Electrical Conductivity Measurements at 20°C. Apidology. 1992, 23, 291–297. DOI: 10.1051/apido:19920403.
- Manzanares, A. B.; Garcı´A, Z. H.; Galdo, N. B. R.; Rodrı´Guez, E. R.; Romero, C. D. Differentiation of Blossom and Honeydew Honeys Using Multivariate Analysis on the Physicochemical Parameters and Sugar Composition. Food Chem. 2011, 126, 664–672. DOI: 10.1016/j.foodchem.2010.11.003.
- Hasan, S. H.;. Effect of Storage and Processing Temperature on Honey Quality. J. Babylon. 2013, University/Pure and Applied Sciences, 21, 2244–2253.
- Persano Oddo, L.; Piazza, M. G.; Pulcini, P. Invertase Activity in Honey. Apidology. 1999, 30, 57–65. DOI: 10.1051/apido:19990107.
- Cervantes, R.; Gonzalez, S.A.; Sauri, D.E. Les effets du traitements thermique sur la qualité du miel pendant l'entreposage. Ed APIACTA. 2000, 35(4), 162-170.
- Alqarni, A. S.; Owayss, A. A.; Mahmoud, A. A. Physicochemical Characteristics, Total Phenols and Pigments of National and International Honeys in Saudi Arabian. Arabian J. Chem. 2016, 9, 114–120. DOI: 10.1016/j.arabjc.2012.11.013.
- Moniruzzman, M.; Khalil, M. I.; Sulaiman, S. A.; Gan, S. H. Physicochemical andAntioxydant Properties of Malysian Honeys Produced by Apis Cerana, Apis Dorsata and Apis Mellifera. BMC. Complement. Altein. Med. 2013, 13(43), 1472–6882.
- Wang, H. H.; Gheldof, H. H.; Engeseth, J. Effect of Processing and Storage on Antioxidant Capacity of Honey. J. Food Sci. 2004, 69, 96–101.
- Bogdanov, S.; Jurendic, T.; Sieber, R.; Gallman, P. Honey for Nutrition and Health. J. Am. Coll. Nutr. 2008, 27, 677–689.
- Dobre, I.; Georgescu, L. A.; Alexe, P.; Escuredo, O.; Seijo, M. C. Rheological Behavior of Different Honey Types from Romania. Food Res. Int. 2012, 49, 126–132. DOI: 10.1016/j.foodres.2012.08.009.
- Fuente, E.; Malute, R.; Barrena, V.; Castro, M. Carbohydrate Composition of Spanish in Floral Honey. Food Chem. 2011, 129, 1483–1489. DOI: 10.1016/j.foodchem.2011.05.121.
- Devillers, J.; Morlot, M.; Delègue, P.; Doré, J. Classification of Monofloral Honeys Based on Their Quality Control Data. Food Chem. 2004, 86, 305–312. DOI: 10.1016/j.foodchem.2003.09.029.
- Manzoor,M.; Mathivanan, V.; Shah, G. N.; Selvisabhenayakan, L. Physicochemical analysis of Honey of Apis Cerana Indica and Apis Mellifera from Different Regions of anantnag District, Jaminu et Kashmir. 2013, 5, 975-1491.
- Terrab, A.; Dı´Ez, M. J.; Heredia, F. J. Characterization of Moroccan Unifloral Honeys Bytheir Physicochemical Characteristics. Food Chem. 2010, 79, 373–379. DOI: 10.1016/S0308-8146(02)00189-9.
- Deschamps, V. C. Production et Commercialisation Du Miel. Thèse de Doctorat Vétérinaire, Université Paul Sabatier, Toulouse, 1998, 118p.
- Laos, K.; Kirs, Z.; Pall, R.; Martvak, K. The Crystallization Behavior of Estonian Honeys. Agron. Res. 2011, 9, 427–432.
- Ulhas, K. Patil; Muskan, K. Essenstials of Biotechnology International Publishing House; India,New Delhi. 2009.
- Junzheng, P.; Changying, J. General Rheological Model for Natural Honeys in China. J. Food Eng. 1998, 36, 165–168. DOI: 10.1016/S0260-8774(98)00050-8.
- Oroian, M.; Amarici, S.; Escriche, I.; Gutt, G. A. Viscoelastical Model for Honey Using the Time- Temperature Supperposition Principale (TTSP). Food Bioprocess Technol. 2013, 6, 2251–2260. DOI: 10.1007/s11947-012-0893-7.
- Juszczak, L.; Fortuna, T. Rheology of Selected Polish Honeys. J. Food Eng. 2006, 73, 43–49. DOI: 10.1016/j.jfoodeng.2005.03.049.
- Cohen, I.; Weihs, D. Rheology and Micro Rheology of Natural and Reduced-Calorie Israeli Honeys as a Model for High-Viscosity Newtonian Liquids. J. Food Eng. 2010, 10, 366–371. DOI: 10.1016/j.jfoodeng.2010.04.023.