
ABSTRACT
Honey is a natural sweetener produced by honey bees from the secretions of plants. Honey is well-known for its nutritional and medicinal values since prehistoric times. In the present study, 40 honey samples were collected from supermarkets in China. These samples were produced in China and also imported from other countries. These samples were explored for the detection of 16 phenolic acids and 14 flavonoids by employing high-performance liquid chromatography (HPLC). Among the phenolic compounds explored, gallic acid (phenolic acid) and chrysin (flavonoid) were found to be the most dominant phenolic compounds. The phenolic profile of honey samples was greatly influenced by geographical location and floral sources. The classification of honey samples collected from various regions and floral sources (unifloral and multi-floral) were carried out using linear discriminant analysis (LDA) and it was observed that certain phenolic compounds significantly contributed towards the classification of honey samples collected from various geographical origin and floral source. Thus, this systematic study provides a fundamental knowledge of honey quality for therapeutic product development.
Introduction
As one of the oldest and most conventional sweetening foods, honey has also been reported to contain about 200 substances,[Citation1] which include enzymes, flavonoids, phenolic acids, volatile compounds, sugars, proteins (0.5%), moisture (17.5%), vitamins, and minerals (0.04–0.2%). The main constituents of honey are water, glucose, fructose, sucrose, minerals, and proteins.[Citation2] Honey is a sugary natural product produced by honey bees from nectar and exudation of the plants. Honey bees transform nectar of flowers into honey by regurgitation, evaporation and enzymatic alteration of saccharides present in nectar. It is a supersaturated solution of monosaccharides like fructose (about 38–55%) and glucose (about 31%) that provide sweetness to the honey. Honey also contains a wide range of phenolic acids and flavonoids that are known to exhibit antioxidant activity. The taste, color, other physical properties and the overall quality of honey are contributed by the non-volatile compounds that include sugars and phenolic compounds.[Citation3]
Recently, plentiful attention has been paid towards the health-promoting anti-oxidative effects of honey as it is known to be a rich source of both enzymatic (glucose oxidase and catalase) and non-enzymatic antioxidants (L-ascorbic acid, flavonoids, and phenolic acids).[Citation1,Citation2] It has been reported that consuming honey is an effective way to increase total plasma antioxidant and reducing capacity in humans.[Citation4] In addition, antioxidants are molecules that inhibit the oxidation of other molecules by performing chemical oxidation that involves loss of an electron or increasing in the oxidation state.[Citation5] Common antioxidants in honey are gallic acid, caffeic acid, and chlorogenic acid.[Citation6]
Among all substances in honey, phenolic compounds are one of the most important compounds contributed towards the antioxidant activity of honey. As natural antioxidants, phenolic compounds in honeys (especially flavonoids and phenolic acid) constitute a vital group that exhibits scientific significance and responsible for the therapeutic properties of honey.[Citation7] Thus, honey is a rich source of phenolic compounds and used as an important source of phenolic compounds in the human diet. Previous studies have demonstrated a strong relationship between the phenolic content of honeys from various floral sources and their antioxidant capacities.[Citation1,Citation8] The phenolic profile and the quantity of various phenolic compounds vary among honeys based on the different floral sources, geographical factors, environmental factors, seasonal factors and the collection method of nectar. The major influential factor is the floral origins, while the processing, handling, and storage impose a minor impact on the phenolic profile and composition of honey.[Citation2] Besides, phenolic acid and flavonoids are also employed as natural markers for the identification of botanical origin for several kinds of honey.[Citation9]
Geographical factors and floral sources had a great impact on the phenolic compositions. The aims of this study are to identify and quantify the phenolic acids and flavonoids in honey from different botanical origins and geographical regions and finding a correlation. High-performance liquid chromatography with photodiode array detection (HPLC-PDA) was used for the identification and quantification of these compounds.
Materials and methods
Honey samples
A total of 40 commercial honey samples with different commercial brands and from diverse floral sources were collected from the supermarket in Zhuhai and Hong Kong. The honey samples were originated from different geographical regions, i.e. Hong Kong, Spain, Italy, Korea, Mainland China, Canada, Brazil, New Zealand, and Germany. Samples were stored in dark at room temperature and after 2 weeks further chemical analysis was started. The samples information is shown in .
Table 1. Information of honey samples collected
Chemicals
Ethyl acetate, sodium chloride, sodium hydroxide, methanol, acetonitrile, ethylenediaminetetraacetic acid (EDTA), hydrochloric acid (HCl), acetic acid were purchased from Tijian Damao Chemical (Tianjin, China). L-Ascorbic acid and trifluoroacetic acid (TFA) were purchased from Sigma-Aldrich Co. (Shanghai, China). Phenolic acids standards and flavonoid standards were purchased from Shaihai Yuanye (Shanghai, China). The solvents used as mobile phase were of HPLC grade whereas all other chemicals were of analytical grade.
Conjugated phenolic acids
The conjugated phenolic acids were extracted from honey according to the study of Xu et al.[Citation10] Briefly, 0.4 g of honey samples were hydrolyzed by adding 10 mL of solvent which includes 10 mM EDTA, 1% L-ascorbic acid (w/v), and 2 M of sodium hydroxide. The reaction mixtures were acidified by adding 2.8 mL of 7.2 M HCl and vortexed for 5–10 s and extracted with 10 mL ethyl acetate twice. The organic layer was combined and dried in a vacuum dryer at 45°C with 100 mbar until all solvent was evaporated. The residue was re-dissolved in 1.5 mL of 25% methanol (v/v). The 25% methanol solution was filtered through a polyvinyl difluoride (PVDF) syringe filter pore size 0.2 µm prior to HPLC analysis.
A Waters e2695 series separations module equipped with Waters 2998 photodiode array detector was used to analyze the conjugated phenolic acid in honey. The detection wavelength was set at 270 nm. A reverse phase column Zorbax 300SB-C18 (4.6 mm × 250 mm, particle size 5 µm) was used at temperature 40°C. The elution began with a program below, solvent A: 0.1% trifluoroacetic acid (TFA) in deionized water and solvent B: methanol (HPLC grade). The flow rate was kept at 0.7 mL/min. Total running time was 77 min. Solvent B was increased from 5% to 30% in 50 min. Solvent B was further increased to 100% at 66 min and kept at 100% until 77 min. The column was eluted isocratically for 10 min before the next injection.
For the identification of the peaks, 100 µg/mL of stock solution of each individual standard was prepared by dissolving the phenolic acid standards in 25% methanol. One mL of stock solution was used and injected in the HPLC for the identification of peak. Phenolic acids were identified by comparing the retention time. To prepare 100 µg/mL of the standard mixture, 1 mg of each phenolic acid standard compound was mixed together and dissolved in 10 mL of 25% methanol. The stock solution was diluted into eight different concentrations (100, 50, 25, 10, 5, 2.5, 1 and 0.5 µg/mL). Standard curves of each phenolic acid could be obtained by plotting the peak area (y-axis) against the standard concentration (x-axis). The phenolic acid in each sample was calculated in micrograms per gram of honey (µg/g).
Flavonoids
The flavonoids were extracted by ethyl acetate as described in the literature.[Citation11] Briefly, 10 g of honey was dissolved in 50 mL of water to a final concentration of 20% (w/v). The solution was then acidified by adding 0.2 M of HCl and saturated with 30% (w/v) of sodium chloride. The obtained solution was then filtered through cotton to remove any solid particles and extracted three times with ethyl acetate using a separatory funnel. The organic layer was then dried in vacuum dryer at 40°C with reduced pressure 100 mbar until all solution was evaporated. The residue was re-dissolved in 5 mL methanol. Prior to the HPLC analysis, all honey sample solutions were filtered through pore size 0.45 µm polytetrafluoroethylene (PTFE) filters.
Agilent 1200 series HPLC system was used for the flavonoids analysis. Agilent 1260 series infinity diode array detector was used with detection wavelength from 256 nm to 350 nm. Separation of the flavonoids was carried out using a WondaCract ODS-2 reversed phase column (250 mm × 4.6 mm, particle size 5 µm) at room temperature. The flow rate of the gradient elution was 1 mL/min with a solution of 2.0% (v/v) acetic acid (solvent A) and acetonitrile (solvent B) as the mobile phase. The injection volume was 20 µL. The analysis of flavonoids began with 10% of solvent B then increased to 30% from 0 to 20 min. Then, the solvent B was increased to 40% from 20 to 30 min, and then 50% from 30 to 50 min. In addition, the column was eluted with 50% acetonitrile for 10 min before the next injection of sample.
For the identification of the peak, 100 µg/mL of stock solution of each individual standard was prepared by dissolving the flavonoids standards in methanol. One mL of the stock solution was used and injected in the HPLC for the identification of peak. By comparing the retention time, flavonoids could be identified. To prepare 100 µg/mL of the standard mixture, 1 mg of each flavonoid standard compound was mixed together and dissolved in 10 mL of methanol. The stock solution was diluted into different concentrations (100, 50, 25, 10, 5, 2.5, 1 and 0.5 µg/mL). Standard curves of flavonoids could be obtained by plotting peak area (y-axis) against standard concentration (x-axis). Flavonoids in each sample were calculated in micrograms per gram of honey (µg/g).
Statistical analysis
The extraction of phenolic acids and flavonoids were performed in duplicate and further composition analyses were also carried out in duplicates. The data were expressed as a mean ± standard deviation. Statistical analysis was performed using IBM SPSS Statistics (version 22, IBM Corporation, New York, USA). Duncan’s multiple range test was used to compare significant differences among the honey samples. Significant differences were statistically considered at the level of p < 0.05. The Linear discriminant analysis (LDA) using the stepwise method was carried out for the classification and identification of honey samples collected from various regions and floral sources (unifloral and multi-floral) based on their phenolic profile.
Results
Quantification of phenolic acids in honey samples
A total of 40 honey samples were subjected to HPLC to determine phenolic acids. A total of 16 phenolic acids were tested in the study (), three phenolic acids, i.e. salicylic acid, ferulic acid, and sinapic acid were not found in all 40 honey samples. Vanillic acid (5.1 ± 0.04 µg/g) was observed only in Thyme honey from Spain. p-Coumaric acid and syringaldehyde were observed only in Wildflower honey (8.7 ± 0.8 µg/g) from Italy and Goldenrod honey (13.6 ± 2.6 µg/g) from Canada. All honey samples were observed to be an abundant source of the hydroxybenzoic derivative.
Figure 1. High-performance liquid chromatography chromatogram of (a) standard phenolic acid solution (20 μg/mL), (b) manuka honey: 1. gallic acid, 2. protocatechuic acid, 3. 2,3,4-trihydroxybenzoic acid 4. protocatechualdehyde, 5. p-hydroxybenzoic acid, 6. gentistic acid, 7. chlorogenic acid, 8. vanillic acid + caffeic acid, 9. syringic acid, 10. vanillin, 11. p-coumaric acid + syringaldehyde 12. ferulic acid, 13. sinapic acid, 14. Salicylic
As indicated in , gallic acid was the most dominant phenolic acid in the honey samples. Gallic acid was detected in 38 honey samples. The gallic acid content of honey samples ranged from 20.6 ± 7.8 µg/g in Hypericum honey to 66.2 ± 1.1 µg/g in Wolfberry honey. Among all honey samples, some of the honey samples did not exhibit significant differences in gallic acid (p> 0.05). However, the same geographical source with different floral sources exhibited significant differences in gallic acid content (p< 0.05). Among the six honey samples from New Zealand, Beech forest honey contained the highest gallic acid content (43.2 ± 7.3 µg/g). Among the honey samples from Spain, the Forest honey (multifloral honey) contained the highest content of gallic acid (63.6 ± 3.7 µg/g). Among the honey samples from China, Wolfberry honey collected from Guangzhou contain the highest gallic acid content (66.2 ± 1.1 µg/g). Bergamot Blossom honey contained the highest gallic acid content (55.9 ± 4.7 µg/g) among two Italy honey samples. Within the same floral source but different geographical locations Linden tree honey from China (42.5 ± 2.8 µg/g) possessed much higher gallic acid than Linden honey from Germany (29.3 ± 5.2 µg/g). Two Osmanthus honey samples from China contained similar content of gallic acid (29.8 ± 3.4 µg/g and 31.8 ± 1.0 µg/g). The honey samples were grouped according to the origin of the country and an average of gallic acid content of honey samples from five representative regions was observed. The average gallic acid content of honey samples from each representative region is mentioned in descending order: Spain (38.73 µg/g) > Italy (38.45 µg/g) > Germany (36.43 µg/g) > New Zealand (32.87 µg/g) > China (30.98 µg/g).
Table 2. The phenolic acid contents (µg/g) of honey samples
The second dominant phenolic acid in honey was protocatechualdehyde. Protocatechualdehyde was detected in 38 honey samples, but their contents were lower than gallic acid. The protocatechualdehyde value of honey samples ranged from 8.1 ± 0.1 µg/g in Beech forest honey (with beech as main floral source) to 21.7 ± 1.2 µg/g in Eucalyptus honey from Spain. Among all honey samples, most of the honey samples exhibited significant differences in protocatechualdehyde. While most of the honey samples from the same geographical location with different floral source exhibited significant differences (p< 0.05) in protocatechualdehyde. However, some of the honey samples did not exhibit a significant difference (p> 0.05), for instance, Lemon honey (10.0 ± 0.8 µg/g) and Hypericum honey (10.1 ± 0.7 µg/g) from Hubei, China and Manuka honey (18.2 ± 1.9 µg/g) and Rata honey (18.1 ± 1.7 µg/g) from New Zealand. The samples with the same floral source but different geographical locations did not show significant differences in protocatechualdehyde, for example, Linden honey contained similar protocatechualdehyde content between the samples from Germany (11.3 ± 0.2 µg/g) and from China (12.7 ± 2.7 µg/g), and Acacia honey collected from South Korea (16.5 ± 0.9 µg/g) and from China (15.7 ± 0.5 µg/g). The honey samples were also classified into different groups based on different countries, and the average protocatechualdehyde value of the honey samples from five representative regions are presented in a descending order: New Zealand (14.32 µg/g) > China (13.66 µg/g) > Germany (12.73 µg/g) > Spain (10.95 µg/g) > Italy (10.35 µg/g).
The third dominant phenolic acid in honey was p-hydroxybenzoic acid that was detected in 25 honey samples. The p-hydroxybenzoic content was relatively low in all honey samples except Wolfberry honey from China (53.5 ± 9.1 µg/g). The p-hydroxybenzoic acid content of honey samples ranged from 3.5 ± 0.2 µg/g in Bergamot honey from Italy to 53.5 ± 9.1 µg/g in wolfberry honey from China. Among all honey samples, most of the honey samples exhibited significant differences in p-hydroxybenzoic acid. However, three honey samples Wolfberry honey (8.9 ± 0.2 µg/g), Chrysanthemum honey (8.3 ± 0.1 µg/g), and Longan honey (8.7 ± 3.7 µg/g) from China did not exhibit significant differences in p-hydroxybenzoic acid. Within the same floral source but different geographical locations, Linden honey showed no significant differences between samples collected from China (7.1 ± 0.2 µg/g) and Germany (7.8 ± 0.4 µg/g). However, p-hydroxybenzoic acid was not observed in Lemon honey collected from Spain but 15.2 ± 0.1 µg/g of p-hydroxybenzoic was detected in the Lemon honey sample from China. Moreover, p-hydroxybenzoic acid was not detected in Longan honey from Hong Kong, while 8.7 ± 3.7 µg/g was detected in Longan honey from Guilin, China. p-Hydroxybenzoic acid was not found in Acacia honey sample from South Korea and China. In addition, the contents of p-hydroxybenzoic acid of five representative regions were compared in the following decreasing sequence: China (10.69 µg/g) > Germany (8.60 µg/g) > Italy (6.45 µg/g) > New Zealand (4.57 µg/g) > Spain (2.82 µg/g). However, p-hydroxybenzoic acid was commonly found in the honey samples from China. However, only two samples from Spain contain p-hydroxybenzoic acid and three out of five honey samples from New Zealand contained p-hydroxybenzoic acid. UV-Vis spectrum of major phenolic compounds observed in honey samples is shown in .
Figure 2. UV-Vis spectrum of major phenolic compounds present in various honey samples (a) gallic acid, (b) protocatechuic acid, (c) 2,3,4-trihydroxybenzoic acid, (d) protocatechualdehyde, (e) p-hydroxybenzoic acid, (f) gentistic acid, (g) chlorogenic acid, (h) vanillic acid, (i) syringic acid, (j) vanillin, (k) p-coumaric acid, (l) ferulic acid, (m) sinapic acid, (n) Salicylic acid
Quantification of flavonoid in honey samples
A total of 14 flavonoids were tested in this study (). All honey samples under investigation contain more or less flavonoids, but the contents were relatively lower than their phenolic acid content. Some of the flavonoids were only detected in particular honey sample, such as myricetin was only found in Eucalyptus honey (0.53 ± 0.1 µg/g) from Spain. Tangeretin was only observed in Blue Borage honey (0.69 ± 0.001 µg/g) from New Zealand, hesperidin was only found in three honey samples, i.e. Manuka honey (4.7 ± 1.3 µg/g) from New Zealand, wild rose honey (0.91 ± 0.27 µg/g), and wolfberry honey (1.02 ± 0.12 µg/g) from China. Among the flavonoids, chrysin, kaempferol, and quercetin were the most common and frequently observed flavonoid compounds in honey samples under investigation. In fact, honey samples under investigation contained different flavonoids but the concentration was too low to be quantified. This situation was mostly encountered during analysis of Chinese honey. The concentrations were out of the range of the standard curves. Thus, the results were regarded as not detectable.
Figure 3. High-performance liquid chromatography chromatogram of (a) standard flavonoids solution (100 μg/mL), (b) manuka honey: 1. Hesperitin, 2. Naringin, 3. Hesperidin, 4. Quercitrin, 5. Myricetin, 6. Morin, 7. Luteolin + Quercetin 8. Naringenin, 9. Apigenin, 10.Kaempferol, 11. Chrysin, 12. Galangin, 13.Tangeretin
The most abundant flavonoid among all honey samples was quercetin and luteolin. As shown in , quercetin ranged from 37.6 ± 0.2 µg/g in Eucalyptus honey from Spain to 0.56 ± 0.05 µg/g in Pure bee honey from Germany. The second most abundant flavonoid was kaempferol. As shown in , the kaempferol ranged from 0.2 ± 0.04 µg/g in pure bee honey from Germany and Wildflower honey from Spain to 1.95 ± 0.27 µg/g in Manuka honey from New Zealand. Most of the honey samples exhibited significant differences in kaempferol. For the same floral source, the Linden honey from Germany contained kaempferol (1.1 ± 0.18 µg/g) but Linden honey from China did not. Also, the Lemon honey from Spain contained kaempferol (0.32 ± 0.01 µg/g) but Lemon honey from China did not contain kaempferol. Among all the commercial honeys from China, kaempferol was quantified only in Mountain coptis honey (0.49 ± 0.04 µg/g).
Table 3. The flavonoids content (µg/g) in honey samples
Chrysin was observed to be the third main flavonoid in honey samples. Chrysin content was varied from 0.22 ± 0.01 µg/g in Wolfberry honey from China to 1.53 ± 0.14 µg/g in Forest honey from Spain as presented in . Most of the honey samples also exhibited significant differences in chrysin content except four honey samples, i.e. South Clover honey (0.76 ± 0.15 µg/g) and Manuka honey (0.68 ± 0.1 µg/g) from New Zealand, Wildflower honey (0.72 ± 0.05 µg/g) and Orange blossom honey (0.76 ± 0.1 µg/g) from Spain and Goldenrod honey (0.75 ± 0.03 µg/g) from Canada. Moreover, within the same floral source but different locations, chrysin was found in Lemon honey from Spain (0.57 ± 0.05 µg/g) but could not be found in Chinese honey. In addition, chrysin was also observed in Wolfberry honey sample collected from Guangzhou (0.22 ± 0.01 µg/g) but not in Wolfberry honey sample collected from Hubei. Chrysin was detected in all samples from Spain and also exhibit significant differences (p< 0.05), while chrysin was detected only in one sample among the 20 samples collected from China. Myricetin and tangeretin were detected in Eucalyptus honey (0.53 ± 0.1 µg/g) collected from Spain and Blue borage honey (0.69 ± 0.001 µg/g) from New Zealand, respectively. The high content of naringin was detected in Premium acacia honey (11.0 ± 0.38 µg/g) from South Korea and Wildflower honey (19.2 ± 0.15 µg/g) collected from Spain. In addition, Manuka honey observed to contain maximum number of flavonoid compounds under consideration (10 out of 14 tested flavonoids). An attempt was also made to determine morin content, but no honey sample has shown the presence of morin.
The sum total of phenolic acids and flavonoids observed in honey samples are shown in . Manuka honey collected from New Zealand presented highest total phenolic acid content (235.50 ± 16.01 µg/g), followed by Spain’s Forest honey (230.50 ± 22.99 µg/g) and Thyme honey (195.30 ± 25.17 µg/g) collected from Spain. However, Honeysuckle honey from China exhibited least total phenolic acid content (40.00 ± 6.01 µg/g).
Table 4. Total phenolic acids, total flavonoids and total phenolic compounds in honey samples from different countries
Among 19 honey samples from China, flavonoids were detected only in five honey samples. Eucalyptus honey collected from Spain exhibited the highest content of total flavonoid (41.65 ± 10.35 µg/g) followed by Wildflower (33.66 ± 5.74 µg/g) honey from Spain and Forest honey from Spain (23.53 ± 4.07 µg/g). However, Longan honey from Hong Kong contained the lowest flavonoid content (0.86 ± 0.24 µg/g).
Linear discriminant analysis (LDA) for classification of honey samples based on the phenolic profile
The stepwise discriminant analysis was performed to extract the best discriminant variables (phenolic compounds) for the classification of samples based on the geographical region and floral source. The best discriminant variables were selected depending on their influence on the classification of samples based on the Wilks’ lambda criterion. summarizes the observation of discrimination models and cross-validation results for the classification of honey samples according to their geographical origin based on the phenolic profile. It was observed that in the case of model 1 (based on phenolic acid), 2,3,4-trihydroxybenzoic acid was extracted as suitable discriminant variables that resulted in 65.6% correct classification rate and 65.6% cross-validation rate. Model 2 (based on flavonoids) extracted apigenin, chrysin, luteolin+ quercetin as suitable discriminant variables and resulted in 96.6% correct classification rate and cross-validation rate was reached to 90.6%. Model 4 was developed by using total phenolic acids, total flavonoid compounds, and total phenolic compounds values. In this case, total flavonoid compounds were observed as a suitable discriminant variable that resulted in 81.3% correct classification rate and cross-validation rate was reported as 81.3%. The best classification results were observed in the case of model 3 based on all the phenolic acids and flavonoid compounds. This model resulted in 100% correct classification rate. In this case protocatechuic acid (PA), vanillic acid (VA), syringic acid (SA), protocatechualdehyde (PCD), 2,3,4-trihydroxybenzoic acid (TBA), genistic acid (GEA), apigenin, chrysin, luteolin+ quercetin and myricetin were reported as suitable discriminant variables for discriminating the geographical origin of honey samples. Based on these suitable discriminant variables two discriminant functions were developed. These two discriminant functions explained the 100% of the variance and Wilks’ lambda values for function 1 was 0.03 (p= 0.000) and for function 2 was 0.408 (p= 0.009), respectively. The Fisher’s linear discrimination functions for each geographical region were explained as follows:
Table 5. Observation of discrimination models and cross-validation results for geographical classification of honey samples based on the phenolic profile
Group 1 (China) = −1.281 PA − 34.083 VA + 1.220 SA + 3.185 PCD + 0.485 TBA − 0.246 GEA + 100.632 Apigenin + 61.235 Chrysin + 4.832 (Luteolin+ quercetin) − 309.861 Myricetin − 23.655
Group 2 (New Zealand) = −5.853 PA − 192.094 VA + 6.308 SA + 8.613 PCD + 3.251 TBA − 2.764 GEA + 560.136 Apigenin + 375.544 Chrysin + 22.396 (Luteolin+ quercetin) − 1216.476 Myricetin − 297.515
Group 3 (Spain) = −7.587 PA − 244.008 VA + 7.935 SA + 9.840 PCD + 4.439 TBA − 3.682 GEA + 695.291 Apigenin + 498.382 Chrysin + 28.625 (Luteolin+ quercetin) − 1497.170 Myricetin − 476.163
The separation of honey samples collected from China, New Zealand, and Spain was confirmed by plotting the two function scores as shown in . A strong visual clustering of honey samples from three regions was observed. Hence, it was confirmed that the abovementioned 10 variables exhibit constructive information for the geographical classification of honey samples. To determine the prediction capability of the model, validation was carried out by employing leave one out cross validation method and a high predictive ability (90.6%) of the model was observed.
Figure 4. Scatter plot of honey samples (a) from three different regions (b) from four regions
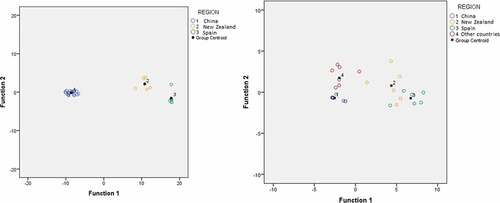
Another model was also developed to discriminate honey samples in four groups, i.e. group 1 (China), group 2 (New Zealand), group 3 (Spain) and group 4 (other countries). The group other countries include South Korea, Germany, Italy, Brazil and Canada. This model employed VA, TBA, p-coumaric acid+syringaldehyde, apigenin, chrysin, luteolin+ quercetin, quercitrin, naringenin as suitable discriminant variables and resulted in 90% correct classification rate and 70% cross-validation rate. A visual clustering of honey samples into four different regions was observed in , but samples from groups 1 and 4 and groups 2 and 3 have some overlaps.
Another attempt has also been made to discriminate honey samples based on the floral origin (unifloral or multifloral). In this case, the stepwise LDA was carried out and hesperitin was identified as suitable discriminant variable that resulted in an efficient classification (87.5%) of honey samples into unifloral or multifloral group and the cross-validation rate was also reached to 87.5%.
Discussion
Phenolic acid contents in honey samples
Previous studies have mentioned a high gallic acid content in many honeys. Gallic acid was also well documented phenolic acid responsible for the antioxidant activity of honeys.[Citation12] A study focused on Australian honeys reported that gallic acid content in these samples varies from 13.9 to 45.2 µg/g,[Citation13] these findings are in agreement with current results. In the present study, almost all honey samples found to be a good source of gallic acid (20.6 ± 7.8 to 63.6 ± 3.7 µg/g) except Loquat honey and Honeysuckle honey from China in which gallic acid was not detected. In a previous study, the Acacia and Linden honey from Serbia reported to contain a low amount of gallic acid. It was below the limit of detection in case of Acacia honey and below the limit of quantification in case of Linden honey.[Citation14] But in the present study, Acacia honey reported to contain 36.9 ± 4.8 µg/g and Linden showed the presence of 42.5 ± 2.8 and 29.3 ± 5.3 µg/g gallic acid. These results revealed that the geographical origin of honey has a great impact on gallic acid content whereas, the same floral source may still result into a similar phenolic profile.
Chlorogenic acid and caffeic acid have also reported to be common phenolic acids that found in honey and also demonstrated their antibacterial function.[Citation15] Both chlorogenic acid and caffeic acid have shown a high occurrence in honey samples in the current study, but the content of these two phenolic acids was observed to be much higher than the previous study.[Citation16] It may be due to the different extraction methods based on the strong alkaline hydrolysis was employed in the current study that was focused to release the conjugated phenolic acid bound with other compounds such as sugar. The high content of these two phenolic acids has been observed in Manuka honey from New Zealand. The Manuka honey is also well-known for its excellent antibacterial activities. Forest honey from Spain and Wildflower honey from Italy also exhibit high quantity of chlorogenic acid and caffeic acid. But these two phenolic acids observed only in a few commercial honey produced in China such as Wild rose honey, Wolfberry honey, and Hypericum honey.
In a previous study, vanillic acid and p-hydroxybenzoic acid were not observed in Manuka honey from New Zealand.[Citation13] However, another study reported the presence of high level of p-hydroxybenzoic acid in Manuka honey from New Zealand.[Citation17] In the present study, vanillic acid was not detected in Manuka honey but p-hydroxybenzoic acid (9.5 ± 3.0 µg/g) was detected in Manuka honey from New Zealand. These results showed that honeys with the similar geographical location and the floral source might still have variation in the compositions of phenolic acids.
If phenolic acid is to be used as a botanical marker, then vanillic acid could be employed as a good chemical marker for identification of Thyme honey from Spain. Furthermore, salicylic acid, sinapic acid, and ferulic acid were not detected in this study. p-Coumaric acid and syringaldehyde were only detected in two honey samples. However, in previous literature, ferulic acid was also detected in commercial honey[Citation18] and a high level of p-coumaric acid was also reported in Polish unifloral honey.[Citation19]
Flavonoids contents in honey
From the result of Ioannis et al.,[Citation11] the Thyme honey from Spain exhibit slightly lower chrysin content (0.73 µg/g) as compared to the Thyme honey investigated in the current study (1.11 ± 0.20 µg/g). The chrysin content of Orange blossom honey (0.69 µg/g) in Ioannis study was also lower compared to the Orange blossom honey explored in the present study (0.76 ± 0.10 µg/g). These results also support the statement that the geographical location has an influence on the flavonoid content of honey, but the influence was not too high because there are other factors such as analytical instrumental differences in the analysis. Moreover, the Ioannis’s study was focused only on four flavonoids, i.e. quercetin, kaempferol, chrysin, and myricetin. But in the current study, 14 flavonoids were considered, thus an extensive flavonoid profile was established.
HPLC analysis of 20 Portuguese heather honey samples reported that the total flavonoid contents of the samples were ranged from 0.6 to 5 mg/kg. The floral source and geographical factor were reported to affect the color and composition of honey samples. Pinocembrin and pinobanksin were reported as the main flavonoids, but it was found that in another geographical region such as Portuguese heather honey, galangin and chyrsin were the main flavonoids.[Citation20] In the present study among the honey samples under investigation, myricetin was the only flavonoid found in Eucalyptus honey although the concentration of this flavonoid was slightly lower compared to the results reported in the literature.[Citation11] Thus, myricetin can be employed as an important botanical marker for Eucalyptus honey. Furthermore, in the current study, tangeretin was observed only in Blue Borage honey and a high content of hesperitin was observed in Manuka honey. Thus, tangeretin and hesperitin can be exploited as botanical markers for identification of Blue Borage honey and Manuka honey from New Zealand, respectively.
Previously an analysis was performed to identify the chemical substances in nectar present in the stomach of the honey bee that collects nectar from heather flowers in Portugal. Quercetin and kaempferol were the main compounds reported in this study revealed that these two compounds mainly came from the floral plant.[Citation20] Although the quantity of quercetin and kaempferol is not too high, it was still mainly found in the honey samples of Spain. Thus, it is believed that quercetin and kaempferol can be employed to identify the floral source of honey in Spain. In the present study, the Orange blossom honey exhibit a significant high contents of quercetin (14.3 ± 3.80 µg/g) more than the honey with same floral source as reported by Ioannis et al.[Citation11] using the same analytical method. Moreover, chrysin, naringenin, and galangin were commonly found in Spanish honey samples. However, tangeretin and hesperidin were absent in Spanish honey, these results were found to be in agreement with a previous study.[Citation21] This showed that the composition of the flavonoids dependent mainly on the geographical location but the amount of flavonoid was mainly related to the floral sources. These kinds of correlations between the floral source and flavonoid quantity were also reported by a previous study.[Citation22]
In the current study, apigenin and chrysin were observed to be the leading flavonoids in the honey samples from New Zealand and Spain, respectively. All the honey samples of New Zealand and Spain exhibit the presence of these two flavonoids. It was observed that apigenin and chrysin are the dominant flavonoids in honeys from New Zealand and Spain. However, quercetin and kaempferol were found too low to detect. Therefore, dominating phenolic compounds would be different depending on a particular region and floral source.
Manuka honey from New Zealand is one of the famous honeys in the world. The present study revealed the presence of significant amount of chrysin and luteolin in the Manuka honey that is consistent with the results reported in the literature.[Citation23] Besides the quercetin was also reported as one of the principle flavonoids of Manuka honey[Citation24] but in the current study, quercetin was not found. In a previous study on Manuka honey, quercetin presented a high variable range from 0.000 to 11.15 µg/g and this high variability in the range of quercetin content was most likely linked to the floral source other than manuka trees from which the nectar or pollen was collected by honey bees.[Citation25] This further verified that the flower contributed towards the compositions of flavonoids in honey. From the results and discussion, it was perceived that flavonoids mainly came from nectar and honey bee, thus the compositions of flavonoids are greatly dependent on the floral sources.
Total phenolic compounds in honey
Distinctive evidence showed that the floral source influenced the phenolic profile. The honey samples were classified according to their countries in . Results showed that the similar geographical location with different floral source leads to a wide variation in total phenolic compounds. Chinese honey had relatively lower phenolic content than the honey produced in other countries especially New Zealand and Spain. The amount of phenolic content could be a kind of marker of honey quality and purity.
As mentioned above, phenolic acids and flavonoids varied with geographical locations and floral origins. These also could be shown in the sum of the phenolic acids and flavonoids. Therefore, each sample consists of a unique phenolic content profile. It was clearly observed from the results of LDA that certain phenolic compounds such as PA, VA, SA, PCD, TBA, GEA, apigenin, chrysin, luteolin+ quercetin, and myricetin can be employed as a suitable classifier to determine the geographical origin and hesperitin can be employed as good classifier for determining the floral source (unifloral or multifloral) of various honey samples .
Conclusion
In this study, 16 phenolic acids and 14 flavonoids were analyzed to identify a botanical marker of different commercial honey available in the local supermarket and compared the variations of the phenolic profile of different honey samples. The phenolic profiles content of various honey samples exhibits a close relationship with the floral source and geographical location. The compositions of phenolic compounds are strongly influenced by the geographical location, while the concentrations of phenolic compounds are dependent on the floral source. However, geographical location and floral source have a significant impact on flavonoid content while possess comparatively less impact on the phenolic acid profile of honey samples. Thus, phenolic acid compounds and flavonoids can be exploited as a botanical marker to identify the floral source and geographical origin of honey samples. The observations of LDA have shown that specific phenolic compounds, i.e. PA, VA, SA, PCD, TBA, GEA, apigenin, chrysin, luteolin+ quercetin, myricetin, and hesperitin can be employed as an indicative compound for determining geographical origin and floral source of various honey samples.
Acknowledgments
The work is jointly supported by grant R201714 from Beijing Normal University-Hong Kong Baptist University United International College and one research grant from Zhuhai Higher Education Construction Project (Zhuhai Key Laboratory of Agricultural Product Quality and Food Safety).
Additional information
Funding
References
- Gheldof, N.; Wang, X. H.; Engeseth, N.; Identification and Quantification of Antioxidant Components of Honeys from Various Floral Sources. J. Agric. Food Chem. 2002, 50(21), 5870–5877.
- Al-Mamary, M.; Al-Meeri, A.; Al-Habori, M. Antioxidant Activities and Total Phenolics of Different Types of Honey. Nutr. Res. 2002, 22(9), 1041–1047. DOI: 10.1016/S0271-5317(02)00406-2.
- Cianciosi, D.; Forbes-Hernández, T. Y.; Afrin, S.; Gasparrin, M.; Reboredo-Rodriguez, P.; Manna, P. P.; Zhang, J.; Lamas, L. B.; Flórez, S. M.; Toyos, P. A.; et al. Phenolic Compounds in Honey and Their Associated Health Benefits: A Review. Molecules. 2018, 23(9), 2322. DOI: 10.3390/molecules23092322.
- Gheldof, N.; Wang, X. H.; Engeseth, N. J. Buckwheat Honey Increases Serum Antioxidant Capacity in Humans. J. Agric. Food Chem. 2003, 51, 1500–1505. DOI: 10.1021/jf025897t.
- Mahdi-Pour, B.; Jothy, S. L.; Latha, L. Y.; Chen, Y.; Sasidharan, S. Antioxidant Activity of Methanol Extracts of Different Parts of Lantana camara. Asian Pac. J. Trop. Biomed. 2012, 2, 960–965. DOI: 10.1016/S2221-1691(13)60007-6.
- Ciulu, M.; Spano, N.; Pilo, M. I.; Sanna, G. Recent Advances in the Analysis of Phenolic Compounds in Unifloral Honeys. Molecules. 2016, 21, 451. DOI: 10.3390/molecules21040451.
- Yao, L.; Juang, Y.; D’Arcy, B.; Singanusong, R.; Datta, N.; Caffin, N.; Raymont, K. Quantitative High-Performance Liquid Chromatography Analyses of Flavonoids in Australian Eucalyptus Honeys. J. Agric. Food Chem. 2004, 52(2), 210–214. DOI: 10.1021/jf034990u.
- Dong, R.; Zheng, Y. N.; Xu, B. J. Phenolic Profiles and Antioxidant Capacities of Chinese Unifloral Honeys from Different Botanical and Geographical Sources. Food Bioproc. Tech. 2013, 6, 762–770. DOI: 10.1007/s11947-011-0726-0.
- Alvarez-Suárez, J. M.; Giampieria, F.; GBattino, M. Honey as a Source of Dietary Antioxidants: Structures, Bioavailability and Evidence of Protective Effects against Human Chronic Disease. Curr. Med. Chem. 2013, 20, 621–638.
- Xu, B. J.; Chang, S. K. C. Total Phenolic, Phenolic Acid, Anthocyanin, Flavan-3-Ol, and Flavonol Profiles and Antioxidant Properties of Pinto and Black Bean (Phaseolus vulgaris L.) As Affected by Thermal Processing. J. Agric. Food Chem. 2013, 57, 4754–4769.
- Ioannis, K. K.; Maria, V. V.; Christos, N.; Anastasia, V. B.; Stavros, K.; Michael, G. K. Floral Authentication of Greek Unifloral Honeys Based on the Combination of Phenolic Compounds, Physicochemical Parameters and Chemometrics. Food Res. Int. 2014, 62, 753–760. DOI: 10.1016/j.foodres.2014.04.015.
- Aljadi, A. M.; Yusoff, K. M. Isolation and Identification of Phenolic Acids in Malaysian Honey with Antibacterial Properties. Turk. J. Med. Sci. 2003, 33(4), 229–236.
- Yaoa, L.; Jiang, Y.; Singanusong, R.; Datta, N.; Raymont, K. Phenolic Acids in Australian Malaleuca, Guioa, Liphostemon, Banksia and Helianthus Honeys and Their Potential for Floral Authentication. Food Res. Int. 2005, 38, 651–658. DOI: 10.1016/j.foodres.2005.01.002.
- Kečkeš, S.; Gašić, U.; Veličković, T. Ć.; Milojković-Opsenica, D.; Natić, M.; Tešić, Ž. The Determination of Phenolic Profiles of Serbian Unifloral Honeys Using Ultra-High-Performance Liquid Chromatography/High Resolution Accurate Mass Spectrometry. Food Chem. 2013, 138, 32–40. DOI: 10.1016/j.foodchem.2012.10.025.
- Estevinho, L.; Pereira, A. P.; Moreira, L.; Dias, L. G.; Pereira, E. Antioxidant and Antimicrobial Effects of Phenolic Compounds Extracts of Northest Portugal Honey. Food Chem. Toxicol. 2008, 46(12), 3774–3779. DOI: 10.1016/j.fct.2008.09.062.
- Moniruzzaman, M.; Yung, A. C.; Rao, P. V.; Hawlader, M. N.; Azlan, S. A.; Sulaiman, S. A.; Gan, S. H. Identification of Phenolic Acids and Flavonoids in Monofloral Honey from Bangladesh by High Performance Liquid Chromatography: Determination of Antioxidant Capacity. Biomed Res. Int. 2014, 1, 737490.
- Oelschlaegel, S.; Gruner, M.; Wang, P.; Boettcher, A.; Koelling-Speer, I.; Speer, K. Classification and Characterization of Manuka Honeys Based on Phenolic Compounds and Methylglyoxal. J. Agric. Food Chem. 2012, 60, 7229−7237. DOI: 10.1021/jf300888q.
- Habib, H. M.; Al, F. T.; Kamal, H.; Souka, U. D. Bioactive Components Antioxidant and DNA Damage Inhibitory Activities of Honey Form Arid Region. Food Chem. 2014, 153, 28–34. DOI: 10.1016/j.foodchem.2013.12.044.
- Jasicka-Misiak, I.; Poliwoda, A.; Dereń, M.; Kafarski, P. Phenolic Compounds and Abscisic Acid as Potential Markers for the Floral Origin of Two Polish Unifloral Honey. Food Chem. 2012, 131, 1149–1156. DOI: 10.1016/j.foodchem.2011.09.083.
- Ferreres, F.; Andrade, P.; Tomás-Barberán, F. A. Natural Occurrence of Abscisic Acid in Heather Honey and Floral Nectar. J. Agric. Food Chem. 1996, 44, 2053–2056. DOI: 10.1021/jf9507553.
- Escriche, I.; Kadar, M.; Marisol, J. Suitability of Antioxidant Capacity, Flavonoids and Phenolic Acids for Floral Authentication of Honey Impact of Industrial Thermal Treatment. Food Chem. 2014, 142, 135–143.
- Yao, L. H.; Jiang, Y. M.; Shi, J.; Tomás-Barberán, F. A.; Datta, N.; Singanusong, R.; Chen, S. S. Flavonoids in Food and Their Health Benefits. Plants Foods Hum. Nutr. 2004, 59(3), 113–122. DOI: 10.1007/s11130-004-0049-7.
- Yao, L.; Datta, N.; Tomás-Barberán, F. A.; Ferreres, F.; Martos, I.; Singanusong, R. Flavonoids, Phenolic Acids and Abscisic Acid in Australian and New Zealand Leptospermum Honeys. Food Chem. 2003, 81(2), 159–168. DOI: 10.1016/S0308-8146(02)00388-6.
- Weston, R. J.; Brocklebank, L. K.; Lu, Y. Identification and Quantitative Levels of Antibacterial Components of Some New Zealand Honeys. Food Chem. 2000, 70(4), 427–435. DOI: 10.1016/S0308-8146(00)00127-8.
- Chan, C. W.; Deadman, B. J.; Manley-Harris, M.; Wilkins, A. L.; Alber, D. G.; Harry, E. Analysis of the Flavonoid Component of Bioactive New Zealand Mānuka (Leptospermum scoparium) Honey and the Isolation, Characterisation and Synthesis of an Unusual Pyrrole. Food Chem. 2013, 141(3), 1772. DOI: 10.1016/j.foodchem.2013.04.092.