
ABSTRACT
In this paper, the authors studied five characteristics of green wheat starch, including amylose and damage starch content, morphology, relative crystallinity, crystallinity pattern and pasting properties. The amylose and damaged starch content varied from 14.57 to 21.00%, and 5.2 to 11.96%, respectively. Green wheat starch exhibited granules oblate, elliptical, round and slightly different from wheat starch. The starches were categorized based on crystal types into A starches and the crystallinity ranges from 19.81 to 28.20%. The starches exhibited a pasting temperature of 81.05–87.55°C, peak viscosity of 12.57–29.05 P, and setback value of 5.67–14.73 P. In addition, we used thermogravimetric-fourier transform infrared spectroscopy (TG-FTIR) to determine the starch content of green wheat starch. The characteristic decomposition temperature range of starch in green wheat was determined by TG to be 225–375°C, and verified by infrared absorption spectroscopy. Starch content of the five green wheat samples was determined by AACC 76–13 and TG method. The results of precision and accuracy test showed that there was no significant difference in the starch content of the green wheat obtained by the two methods.
Introduction
Green wheat, which has a unique ‘green wheat’ flavor and a lot of nutrients, such as dietary fiber and protein, is a traditional Chinese food. Studies have shown that green wheat contains 14.90% protein, 12.88% dietary fiber, 14.44mg/g ferulic acid, 1.04 mg/g flavonoids and a large number of vitamins and minerals. And then green wheat contained starch only 45.17% compared to wheat. It also has great advantages in antioxidants. The price of green wheat is higher than that of wheat, which increases the income of farmers and drives economic growth. Since the green wheat has high moisture content after harvest, it needs to be stored frozen. The treatment is different from roasted green wheat (frikeh), which is a common practice in Middle Eastern countries[Citation1–Citation4]. Meanwhile, new treatments can protect nutrients in green wheat. Green wheat is a whole grain food that is good for the health of human. Due to its low starch content, it is more suitable for people such as diabetes.
Starch is the second largest natural polymer compound next to cellulose. It is widely present in the fruit, tubers and grains of plants. Since starch is widely used in many industries, studying the physicochemical properties of green wheat starch can help to provide a reference. Structure and composition of starch determine their properties. The crystalline structure of the starch granules can be obtained from the X-ray diffraction (XRD) pattern. Jie et al.[Citation5] found that three wheat starch granules are mainly A-type crystals, and A-type starch granules have a wider gelatinization temperature range than B-type. The different structures of wheat starch granules also affect the quality of the flour products[Citation6]. In the wheat starch crystalline structure, gelatinization enthalpy of A-type starch granules was higher than the B-type. The crystal shape of starch is related to crystallinity. Meanwhile, crystals with defective starch have lower solubility[Citation7]. In addition, external effects such as freezing have different effects on A-type and B-type starch granules. Starch gelatinization properties are important indicators reflecting starch quality and have an important impact on the quality of flour products[Citation8]. Percentage of broken starch and the average particle size distribution showed a significant negative correlation with the gelatinization temperature[Citation9]. The interaction between particle morphology, amylose content, relative crystallinity and gelatinization parameters affects the properties of the starch[Citation10]. Some parameters of starch physicochemical properties have great correlation with the properties of starch. Studying the physicochemical properties of green wheat starch can help to understand the starch and improve the utilization of green wheat starch resources.
Thermogravimetric (TG) analysis is widely used in starch research. Phillips and Blazey[Citation11] used the TG method to measure the content of starch in polymer systems and found that it can accurately measure its content. Different heating rates have different effects on the reaction kinetics of corn starch and three different weightless stages are studied[Citation12]. Tian et al.[Citation13] used TG and differential scanning calorimetry (DSC) to analyze the retrogradation of rice starch and pointed out that TG can be used to study starch retrogradation and more accurate. Carroll and Liskowit[Citation14] pointed out that TG analysis is equivalent to a “fingerprint” that can identify starch samples. Nevertheless, the relationship between the weight loss and the temperature of green wheat starch has not yet been explored by TG.
Infrared spectroscopy (FTIR) was used for rapid characterization of selected irradiated starch samples. It can detect intermolecular interactions, especially hydrogen bonding interactions. This molecular interaction plays a crucial role in determining the tertiary structure of starch. Kumar[Citation15] has observed that bound water in starch plays a vital role in the peak position in the FTIR, especially in the fingerprint region. Effect of combined water on the characteristics of starch nanocrystalline -OH stretching belt. FTIR can also be used for starch retrogradation research. Gelation and retrogradation of amylose and amylopectin can be followed using ratio measurements obtained by FTIR[Citation16]. The objective of this study was to research some physicochemical properties of green wheat. The weight loss rate of different Al2O3 powder and green wheat starch ratio was analyzed by TG. And then, starch content of green wheat was calculated. The change of green wheat starch with different temperature was analyzed from the FTIR corresponding TG.
Materials and methods
Materials
Five different varieties of green wheat Ⅰ-Ⅴ (Zhengmai No.7698; Zhongmai No.175; Bainong No.207; Zhengmai No.4; Zhongmai No.895) were provided by the Henan Academy of Agricultural Sciences, Zhengzhou, P. R. China.
Preparation of samples
Vacuum freeze dried the green wheat and crushed through a 100 mesh sieve. Green wheat starch was isolated from green wheat according to the protocols described by Ren[Citation17].
Moisture, starch, amylose and damaged starch content of green wheat
Moisture was quantitatively estimated using the standard AACC 44–16 method. Starch content was determined by polarimetry method[Citation18]. Amylose content was calculated by absorbance by Hoover and Ratnayake[Citation19]. Damaged starch was measured with SDmatic (Chopin Technologies Ltd., FRA).
Morphology and crystalline structure of green wheat starches
A small amount of dried green wheat starch was applied to a 10 nm thick metal film. Then a blown rubber ball was used to blow radially toward the outside of the tray so that the powder can be evenly distributed on the tape. Steaming a gold film on the surface. A gold film was evaporated on the surface and observed with green starch granules by scanning electron microscopy (SEM) (Quanta 250 FEG, FEI Ltd., USA).
Green wheat starch sample was subjected to X-ray diffraction (XRD, CuKα radiation, D/max 2550VB X-ray diffractometer, Rigaku) scanning under the following conditions. The tube flow rate was 40 mA; tube pressure was 40 kV; scanning speed was 10°/min; 5° and 40° were the starting angle and the ending angle, respectively.
Pasting properties of green wheat starches
Pasting properties of green wheat starch were evaluated according to AACC 76–21 by a Rapid Visco Analyzer (RVA-TM, Perten Instruments Ltd., Sweden).
Thermogravimetric analysis and fourier transform infrared (FTIR) measurements of green wheat starches
Thermogravimetric analysis was conducted with a TGA-Q50 (TA Ltd.,USA). The operation was performed from 40°C to 600°C at a heating rate of 10°C min−1 under air. The green wheat starch concentration gradient of 0%, 20%, 40%, 60%, 80% and 100% was prepared with Al2O3 powder. All samples were 10mg.
FTIR spectra (NICOLET-6700 spectrometer, Thermo, USA) was recorded to characterize samples. Samples were scanned by infrared absorption spectrometer using KBr tableting method. Infrared spectrometer had 16 scans with a resolution of 4 cm−1 and a scan interval of 400 ~ 4000 cm−1.
Statistical analysis
Values were analyzed using SPSS (version 20.0, Chicago, USA). Data was exhibited as means ± standard deviations of at least triplicate determinations. Origin Pro 8.6 program (Origin Lab Inc., USA) was also used for statistical analyzes.
Results and discussion
Amylose and damaged starch content of green wheat starches
Starch content of green wheat is mostly between 45% and 50%. It is related to variety and harvest time. Amylose is a form of starch whose content affects the properties of starch. According to the standard curve equation (Y = 0.0028X + 0.0501, R2 = 0.9993, where Y is the absorbance value, and X is the amylose content [%]), the amylose contents of green wheat starches were determined at 720 nm by using the spectrophotometer (). Amylose content of green wheat is lowest at 14.57%, and highest at 21.00%, which is relatively lower than those of other cereal starch varieties[Citation17]. Amylose molecules easily exhibit aging because of their long and linear features. Therefore, green wheat starch ages at lower rate and degree compared with wheat starch. The difference in pasting characteristic curve is due to the difference in amylose content. When the starch is gelatinized and then cooled, starch begins to retrogradation. Amylopectin has an inhibitory effect on amylose retrogradation[Citation20]. The damaged starch of green wheat is lowest at 5%, and the highest can reach 11.96%. These values are higher than wheat. It may be that the starch is easily destroyed when it is immature. The more damaged starch content, the greater water absorption of green wheat flour. When there is a lot of broken starch, the green wheat dough is sticky, the internal tissues are not soft, and it is prone to collapse. Moreover, the lower gelatinization enthalpy and the higher melting enthalpy of the amylose-lipid complex[Citation21]. Due to the low starch content and high dietary fiber value, it is an ideal food for people such as diabetes.
Table 1. Moisture, starch, amylose and damaged starch content of green wheat
Morphological characteristics of green wheat starches
The morphology of five kinds of green wheat starch granules were observed by SEM (). Green wheat starch is stored in the endosperm in a granular state, and the starch granules are formed in the plastid. Particles are divided into different types according to their diameter[Citation21]. As shown by scanning electron microscopy, A-type starch with a particle size of about 20 μm and a flat shape, and a particle size of about 5 μm is a B-type starch. The green wheat is mainly composed of A-type and B-type starch. B-type starches begin to grow on the 11th day after the flowering period. The content of B-type starch reduced in that B-type starch began to burst[Citation23]. But compared to wheat, there are more B-type starches in green wheat. There is a significant difference between the physical and chemical properties of the two types of starch. Some of the green wheat starch is the same as wheat, but other green wheat starch shapes are not very regular, like the kidney type. Sometimes these kidney-type starches will have “creases” across the starch. Compared with wheat starch granules, green wheat starch has more ring lines around the green wheat starch granules. Some green wheat starch granules have a “hat” shape. The surface of the green wheat starch granules is also not as smooth as wheat. A-type starch is mainly oblate, elliptical and round. While B-type starch is more diversified, like balls and even includes the damaged part of A-type starch. Its degree of incompleteness and edge damage are higher than that of A-type. Meanwhile B-type starch has a deeper concave surface, compared to the smooth surface of A-type starch.
Figure 1. Scanning electron microscopy images of green wheat starch granules: a-e. green wheat starch Ⅰ-Ⅴ
Crystalline structures of green wheat starches
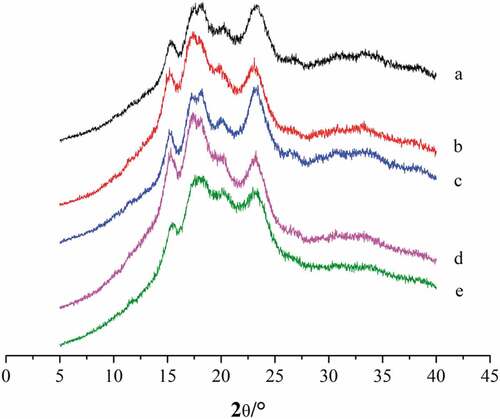
Starch is a natural polycrystalline polymer, which is composed of crystalline and non-crystalline areas. The crystallinity of starch and starch derivatives directly affects the application properties of starch products. The structure of starch granules can be divided into three structures: amorphous, submicron and microcrystalline, which have different X-ray diffraction characteristics and properties[Citation20]. The crystal can produce a diffraction effect on the X-ray, and the diffraction can be used to determine the structure of the crystalline substance at the atomic level, providing a detailed number of structures. Ordinary natural starch is divided into three basic crystalline types: A, B, and C. Type A crystalline structure characterized by cereals such as corn, wheat, and rice starch. Its obvious diffraction peaks at 2θ values of 15, 17, 18, and 23°. While type B crystalline structure characterized by tuber, fruit, stem starch such as potato, sago and banana. The diffraction peaks are at 5.6, 17, 22, and 24°. There is also a type C crystalline structure between A and B, such as beans and other root starches[Citation24]. The XRD patterns of starch in different green wheat varieties were similar, showing a typical type A crystallinity structure (). The main performance is: 2θ angles have strong diffraction peaks around 15, 17, 18 and 23°. Among them, the diffraction peaks around 17° and 18° are connected doublets, and there are weak diffraction peaks around 20°. The crystallinity of five kinds of green wheat starch were 25.16% (Ⅰ), 21.73% (Ⅱ), 28.20% (Ⅲ), 19.81% (Ⅳ) and 20.00% (Ⅴ). These values are significantly lower than wheat starch[Citation25].
Figure 2. X-ray diffraction pattern of five kinds of green wheat starches: a-e. green wheat starch Ⅰ-Ⅴ
Pasting properties of green wheat starch
The pasting properties of starch from different sources are different. The pasting temperature of the five kinds of green wheat starch is more than 80°C (). The highest is 87.55°C. Peak viscosity is a measure of the pasting properties that reflects the viscosity of the starch. The peak viscosity of green wheat starch is above 10.00 P, and the highest can reach 29.05 P. It is much higher than the peak viscosity of other crop starch, such as wheat, corn[Citation17]. Indicates that the maximum viscosity of starch after pasting of green wheat starch is extremely high. Setback values can reflect the stability and retrogradation trend of starch paste. The setback values of the five kinds of green wheat starch are generally high, and the starch is easy to retrogradation.
Table 2. Pasting properties of green wheat starches
shows the Pearson correlation coefficients for the relationship between starch content, amylose content, damaged starch content, crystallinity and pasting properties. The results showed that the green wheat starch content and damaged starch content were not significantly correlated with all RVA parameters. This phenomenon may be due to the fact that green wheat starch has not yet been grown. There is a significant positive correlation between amylose content and peak time. The crystallinity showed significant negative correlations with peak viscosity and peak time. Zhu[Citation26] believed that crystallinity is closely related to pasting temperature; Li et al.[Citation27] found that amylose content has a significant relationship with the values of peak time, peak viscosity, pasting temperature, trough viscosity, final viscosity and setback. These differences may be due to different grains or varieties.
Table 3. Correlation analysis of the starch, amylose and damaged content, and crystallinity with their pasting properties
Analysis of green wheat starch by TG
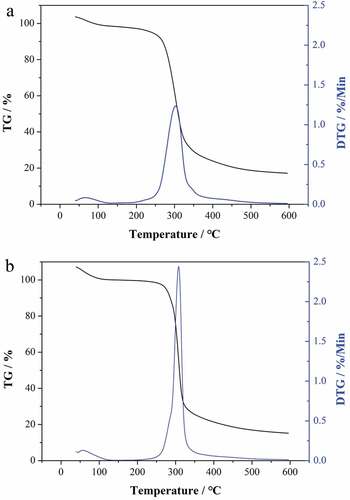
In order to investigate the thermal decomposition process of green wheat starch, the TG of different varieties of green wheat starch show that the TG profiles of different varieties green wheat are not much different. Green wheat Ⅰ is selected as a sample (). Thermal decomposition process of green wheat starch have three stages (). the first stage (T < 225°C) mass loss (about 6.615%) was due to the evaporation of volatile substances, mainly the evaporation of water; the second stage (225°C≤T ≤ 375°C) mass loss is due to the decomposition of starch; the third stage (T > 375°C) mass loss is due to the occurrence of carbonization. This may be due to complete decomposition of the intermediate product after decomposition of the starch. Rapid dehydration and decomposition of the glucose cyclic hydroxyl group at the beginning of the second stage forms water molecules[Citation28]. At this stage, C-C-H, C-O, C-C bonds and the main chain were broken. The main decomposition gas products are H2O, CO, CO2 and some compounds like CH4 and C2H4[Citation29]. Peaks in the 225°C-375°C range on the TG curve may be produced by a single reaction or a combination of multiple reactions. The decomposition temperature range of starch is from 225°C to 375°C. The decomposition rate is the highest at 308°C. When the temperature is raised to 600°C, 99.95% of the starch has completely decomposed.
Figure 3. TG and DTG curves of green wheat Ⅰ (a) and green wheat starch Ⅰ (b)
Analysis of green wheat starch by FTIR
FTIR spectra of green wheat Ⅰ is shown in . The band near 3412 cm−1 is attributed to the stretching vibration of O-H and the N-H stretching vibration of amino acids. This part mainly reflected carbohydrates (cellulose, polysaccharides), proteins in green wheat. Band at 2925 cm−1 is attributed to the stretching vibration of methyl C-H. The peak at 1653 cm−1 is characterized the stretching vibration of H-O-H in water molecules. Peak occurring at 1383cm−1 is attributed to -CH3 deformation vibration and O-H in-plane bending vibration. Several discernible absorbancies at 1156 cm−1 and 1080 cm−1 is attributed to the stretching vibration of C-O, C-C and C-O-C anti-symmetric stretching vibration. The absorption peak near 1020 cm−1 is attributed to C-OH stretching vibration. The absorption band near 575 cm−1 is attributed to the vibration mode of the glucose pyran ring skeleton[Citation30,Citation31]. The infrared spectrum of green wheat is very similar to wheat, rice and corn[Citation32,Citation33].
Figure 4. FTIR spectra of green wheat Ⅰ (a) and a:green wheat starch Ⅰ; b:burning green wheat starch Ⅰ at 225°C; c:burning green wheat starch Ⅰ at 375°C (b)
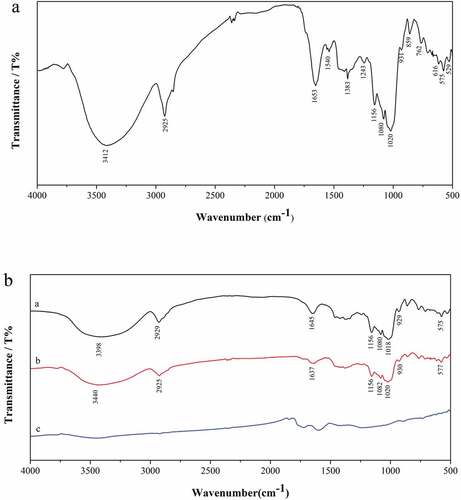
In order to further prove, the characteristic decomposition interval of starch, the residue of the green wheat starch before and after the characteristic decomposition temperature is analyzed by FTIR. The peak shape and peak position of the FTIR spectrum before decomposition of the green starch to 225°C are basically the same as those of the original starch. However, the characteristic absorption peak of the starch disappeared after the decomposition to 375°C. It is proved that the decomposition temperature range of green wheat starch is 225°C-375°C. It is consistent with the experimental results of TG ().
Analysis of green wheat starch content by TG
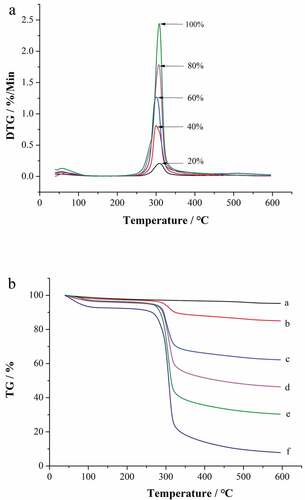
It can be seen from that with the increase of starch content, the peak area and weight loss rate of the corresponding interval increase sequentially. There is a positive correlation between the two, which is quantitatively provided by using the characteristic peak area of the starch and the weight loss rate of the characteristic interval.
Figure 5. DTG spectra of different proportions of green wheat starch-Al2O3 (a) and TG curves of green wheat starch-Al2O3. a:Al2O3; b-e:20%, 40%, 60%, 80% green wheat starch content of starch-Al2O3; f:green wheat starch (b)
The linear equation was made according to (Y = 0.5679X + 0.713, R2 = 0.9992). It is feasible and reliable to evaluate the level of starch content by the weight loss rate. The starch content of five different varieties samples is determined by AACC 76–13 and TG respectively. The results are shown in . It can be seen from Table Ⅰ that the relative error between the measured value of the green wheat starch content with AACC 76–13 and TG was less than 1%, and the results are satisfactory. Description the TG is applicable to the determination of starch content in different varieties of green wheat. The content of starch in the same green wheat sample Ⅰ is determined by AACC 76–13 and TG and measured in parallel five times. The comparison results of the measured values of the two methods are shown in . The results are highly reproducible.
Table 4. Different varieties of green wheat starch content results
Table 5. Five times measurement of green wheat starch I using AACC 76–13 and TG
In order to test the precision and accuracy of the TG method, it is necessary to perform an F test and a t test on the experimental results. F = 1.60< F4,4 = 6.39 (P = .90). It shows that there is no significant difference in the precision of the data obtained by the two methods. t (= 0.44) <t0.10,8 (= 1.86) (P = .90). So, there is no significant difference between the mean values of the two sets of experimental data. Therefore, the TG method can be used to measure the starch content of green wheat. From the comprehensive analysis of the results of TG and FTIR, it can be inferred that the measurement of starch content can be determined by this method.
Conclusion
Five different sources of green wheat starches showed specific particle morphology, crystal type, starch composition and pasting properties. Green wheat starch, amylose, and damaged starch content ranged from 45.17 to 63.97%, 14.57 to 21.00%, and 5.2 to 11.96%, respectively. Among them, the content of amylose in green wheat III was the highest, and the content of damaged starch in green wheat IV was the highest. The granule morphology of green wheat starch was mainly oblate, elliptical and round. The five kinds of green wheat starch were all A-type crystalline structure, and the crystallinity ranges from 19.81 to 28.20%. The green wheat starches exhibited a pasting temperature of 81.05–87.55°C, peak viscosity of 12.57–29.05 P, and setback value of 5.67–14.73 P. The characteristic decomposition range of the green wheat starch on the thermal analysis curve was determined by TG to be 225°C-375°C. The results were verified by FTIR spectroscopy and consistent with the TG. There was a positive correlation between the green wheat starch content and the weight loss rate of the characteristic decomposition interval, and the correlation was good. A mathematical model for determining the green wheat starch content by TG method was established, Y = 0.5679X + 0.713 (R2 = 0.9992). Different varieties of green wheat can use the same equation to calculate the starch content of green wheat according to the weight loss rate of TG curve in the characteristic interval (225°C-375°C). This method can be used to determine the content of starch.
Additional information
Funding
References
- Al-Mahasneh, M. A.; Rababah, T. M.; Bani-Amer, M. M.; Al-Omari, N. M. Fuzzy and Conventional Modeling of Open Sun Drying Kinetics for Roasted Green Wheat. Int. J. Food Prop. 2013, 16(1), 70–80. DOI: 10.1080/10942912.2010.528108.
- Al-Mahasneh, M. A.; Bani Amer, M. M.; Rababah, T. M. Modeling Moisture Sorption Isotherms in Roasted Green Wheat Using Least Square Regression and Neural-fuzzy Techniques. Food Bioprod. Process. 2012, 90(2), 165–170. DOI: 10.1016/j.fbp.2011.02.007.
- Al-Mahasneh, M. A.; Rababah, T. M. Effect of Moisture Content on Some Physical Properties of Green Wheat. J. Food Eng. 2007, 79(4), 1467–1473. DOI: 10.1016/j.jfoodeng.2006.04.045.
- Rosner, A.;. Roasting Green Wheat in Galilee. Gastronomica. 2011, 11(2), 66–68. DOI: 10.1525/gfc.2011.11.2.66.
- Jie, Z.; Guanglei, L.; Haiyan, G.; Zhengang, R. Comparison of A and B Starch Granules from Three Wheat Varieties. Molecules. 2011, 16(12), 10570–10591. DOI: 10.3390/molecules161210570.
- Shibanuma, K.; Takeda, Y.; Hizukuri, S.; Shibata, S. Molecular Structures of Some Wheat Starches. Carbohydr. Polym. 1994, 25(2), 111–116. DOI: 10.1016/0144-8617(94)90146-5.
- Lan, X.; Li, Y.; Xie, S.; Wang, Z. Ultrastructure of Underutilized Tuber Starches and Its Relation to Physicochemical Properties. Food Chem. 2015, 188, 632–640. DOI: 10.1016/j.foodchem.2015.05.025.
- Crosbie, G. B.;. The Relationship between Starch Swelling Properties, Paste Viscosity and Boiled Noodle Quality in Wheat Flours. J. Cereal Sci. 2015, 13(2), 145–150. DOI: 10.1016/S0733-5210(09)80031-3.
- Asmeda, R.; Noorlaila, A.; Norziah, M. H. Relationships of Damaged Starch Granules and Particle Size Distribution with Pasting and Thermal Profiles of Milled MR263 Rice Flour. Food Chem. 2016, 191, 45-51. DOI: 1016/j.foodchem.2015.05.095.
- Maaran, S.; Hoover, R.; Donner, E.; Liu, Q. Composition, Structure, Morphology and Physicochemical Properties of Lablab Bean, Navy Bean, Rice Bean, Tepary Bean and Velvet Bean Starches. Food Chem. 2014, 152(2), 491–499. DOI: 10.1016/j.foodchem.2013.12.014.
- Phillips, E.; Blazey, S. Quantitative Thermogravimetric Analysis of Starch Contents in Several Polymer Systems. Thermochim. Acta. 1991, 192(24), 191–197. DOI: 10.1016/0040-6031(91)87161-O.
- Yuan, C. M.; Li, C.; Li, G.; Zhang, P. H. Determination of Kinetic Parameters of Maize Starch in Air Using Thermogravimetric Analysis. Adv. Mater. Res. 2012, 508, 114–117. DOI: 10.4028/www.scientific.net/AMR.508.
- Tian, Y.; Li, Y.; Xu, X.; Jin, Z. Starch Retrogradation Studied by Thermogravimetric Analysis (TGA). Carbohydr. Polym. 2011, 84(3), 1165–1168. DOI: 10.1016/j.carbpol.2011.01.006.
- Carroll, B.; Liskowitz, J. W. Thermogravimetric Behavior of Starches. J.agric.food Chem. 1976, 15(4), 701–703. DOI: 10.1021/jf60152a025.
- Kumar, S. V.; Kumar, V. A. S.; Kumar, S. The Influence of Bound Water on the FTIR Characteristics of Starch and Starch Nanocrystals Obtained from Selected Natural Sources. Starch ‐ Stärke. 2018, 1700026. DOI: 10.1002/star.201700026
- Goodfellow, B. J.; Wilson, R. H. A Fourier Transform IR Study of the Gelation of Amylose and Amylopectin. Biopolymers. 2010, 30(13–14), 1183–1189. DOI: 10.1002/bip.360301304.
- Ren, S.;. Comparative Analysis of Some Physicochemical Properties of 19 Kinds of Native Starches. Starch - Stärke. 2017, 1600367. DOI: 10.1002/star.201600367
- Peris-Tortajada, M.;. Measuring Starch in Food. Starch Food. 2004, 57(3–4), 185–207.
- Wrolstad, R. E. Handbook of Food Analytical Chemistry – Water, Protein, Enzymes, Lipids, and Carbohydrates; Wiley-Interscience, 2005.
- Wang, S.; Li, C.; Copeland, L.; Niu, Q.; Wang, S. Starch Retrogradation: a Comprehensive Review. Compr. Rev. Food Sci. Food Saf. 2015, 14(5), 568–585. DOI: 10.1111/crf3.2015.14.issue-5.
- León, A. E.; Barrera, G. N.; Pérez, G. T.; Ribotta, P. D.; Rosell, C. M. Effect of Damaged Starch Levels on Flour-thermal Behaviour and Bread Staling. Eur. Food Res. Technol. 2006, 224(2), 187–192. DOI: 10.1007/s00217-006-0297-x.
- Stoddard, F. L.;. Genetics of Starch Granule Size Distribution in Tetraploid and Hexaploid Wheats. Aust. J. Agric. Res. 2003, 54(7), 637–648. DOI: 10.1071/AR03016.
- Bechtel, D. B.; Zayas, I.; Kaleikau, L.; Pomeranz, Y. Size-distribution of Wheat Starch Granules during Endosperm Development. Cereal Chem. 1990, 67(1), 59–63.
- Tester, R. F.; Karkalas, J.; Qi, X. Starch-composition, Fine Structure and Architecture. J. Cereal Sci. 2004, 39(2), 151–165. DOI: 10.1016/j.jcs.2003.12.001.
- Zhang, B. J.; Li, X. X.; Liu, J.; Xie, F. W.; Chen, L. Supramolecular Structure of A- and B-type Granules of Wheat Starch. Food Hydrocolloids. 2013, 31(1), 68–73. DOI: 10.1016/j.foodhyd.2012.10.006.
- Zhu, P.; Study on functional properties of rice starches and correlation analysis. ( MA thesis). China: Zhejiang University, 2015, p. 52
- Li, C.; Feng, C.; Wang, Y.; Zhang, R.; Guo, W.; Zhu, X.; Peng, Y. Differences and Correlations of Starch Physicochemical Properties among Different Wheat Cultivars. Acta Agron. Sin. 2007, 33, 1129–1134.
- Pineda-Gómez, P.; D F, C.; Ramos-Rivera, D. Thermo-alkaline Treatment. A Process that Changes the Thermal Properties of Corn Starch. Procedia Food Sci. 2011, 1(6), 370–378. DOI: 10.1016/j.profoo.2011.09.057.
- Liu, X.; Yu, L.; Xie, F.; Li, M. Kinetics and Mechanism of Thermal Decomposition of Cornstarches with Different Amylose/amylopectin Ratios. Starch - Stärke. 2010, 62(3–4), 8. DOI: 10.1002/star.200900202.
- Xu, J.; Zhou, C. W.; Wang, R. Z.; Yang, L.; Du, S. S.; Wang, F. P.; Ruan, H.; He, G. Q. Lipase-coupling Esterification of Starch with Octenyl Succinic Anhydride. Carbohydr. Polym. 2012, 87(3), 2137–2144. DOI: 10.1016/j.carbpol.2011.10.035.
- Kizil, R.; Irudayaraj, J.; Seetharaman, K. Characterization of Irradiated Starches by Using FT-raman and FTIR Spectroscopy. J. Agric Food Chemi. 2002, 50(14), 3912–3918. DOI: 10.1021/jf011652p.
- Barron, C.; Rouau, X. FTIR and Raman Signatures of Wheat Grain Peripheral Tissues. Cereal Chem. 2008, 85(5), 619–625. DOI: 10.1094/CCHEM-85-5-0619.
- Shirley, K.; Julianabernardi, O.; Paulofernando, D. ATR-FTIR Spectroscopy and Chemometric Analysis Applied to Discrimination of Landrace Maize Flours Produced in Southern Brazil. Int. J. Food Sci. Technol. 2010, 45(8), 1673–1681. DOI: 10.1111/j.1365-2621.2010.02313.x.