
 ?Mathematical formulae have been encoded as MathML and are displayed in this HTML version using MathJax in order to improve their display. Uncheck the box to turn MathJax off. This feature requires Javascript. Click on a formula to zoom.
ABSTRACT
Five different chocolate types (i.e. extra dark, dark, milk, white, and ruby) were characterized and compared for the acoustical and textural characteristics. Acoustic properties were described in terms of longitudinal and transversal wave velocities. These velocities were used for the evaluation of elastic constants namely Young modulus and Poisson ratio. The values of the Young moduli are significantly higher than those obtained using uniaxial compression and tensile tests. At the same time, the values of Poisson ratio are in reasonable agreement with results of these methods. Texture characteristics were evaluated using of the compression test at loading rates (crosshead velocity) 1, 10 and 100 mm/min. Results are presented in form of stress vs strain. The stress-strain dependences obtained from the compression test exhibited two different regions of the sensitivity of stress to the applied strain. The linear dependence stress- strain is taken as the evidence of the elastic behavior of the tested material. The extent of this region was given by the strain, which was the same for all tested chocolates. Its value increased with the loading rate. The stress-strain behavior in this region was only slightly dependent on the loading rate with exception of the ruby and dark chocolates. The stress-strain dependence in the following region was significantly dependent on the strain rate. Values of the strain rate sensitivity were evaluated. The order of the tested chocolates according to the values of stress at the given strain was identical with that obtained using of the elastic wave velocities.
Introduction
Chocolate is defined as a semi-solid suspension, made of sugar and cocoa (in the form of fine solid particles) disperse in fat phase of cocoa butter. The structure of the chocolates is very complex. Cocoa butter is polymorphic with 6 ways of crystalline forms designated as polymorphs I–VI (structurally different with same chemically identical).[Citation1] C-2: References should be number format Dark, milk and white chocolate are the three main types that differ in the content of cocoa solids, milk fat and cocoa butter. This is the reason for the different contents of fats, carbohydrate and proteins.[Citation2] In 2017, the Belgian-Swiss company Barry Callebaut brought to the world market ruby chocolate which is still waiting to be approved as the fourth type of chocolate.[Citation3]
Rheological and textural properties of the three types of chocolate were studied in many papers, see e.g.[Citation4,Citation5] The rheological properties of chocolate are very important for the production of high-quality products with a well-defined texture.[Citation6] Textural properties represent one of the three main acceptability factors, in addition to appearance and flavor, that consumers use to evaluate chocolate quality. The texture is examined using sensory evaluation or by instrumental methods, see e.g.[Citation7] A commonly used method of measuring the textural properties of foods is the compression test based on the similarity to the chewing effect in the mouth. The meaning of this test for the understanding of the chocolate behavior during the oral processing is described, e.g. by.[Citation8] The comprehensive data on the chocolate behavior during the compression test were obtained by.[Citation9] These dates are also needed for the development of chocolate constitutive equation, which can be used in computational models enabling the numerical simulation of the oral process. The next advantages of the uniaxial compression test are that it does not require creating a specific sample shape or size and does not require attaching the sample to the test apparatus. This test has been applied to investigate hardness[Citation10] as well as chocolate texture as a function of composition, fat content or storage conditions[Citation11–13,Citation14]. The aim of this paper consists in the detail analysis of the behavior of different types of chocolates (extra dark, dark, milk, white, ruby) during the compression test. The values of used strain rates are relevant to lower values of the strain rates occurring during the mastification, which lies between 0.1 and 2.5s−1 as reported, e.g. by.[Citation15] In order to obtain some more detail view on the chocolate properties, the basic acoustics properties have been also evaluated.
Material and experimental procedure
Material
Five chocolate masses were used for the experiments – extra dark chocolate (EDC), dark chocolate (DC), milk chocolate (MC), white chocolate (WC), and ruby chocolate (RC). The EDC (Domori, Italy) contains 100% cocoa components (Morogoro, Tanzania). The DC, MC, and WC (Belcolade, Switzerland) contain 55.5%, 36.5%, and 28% cocoa components. The RC (Callebaut, Belgium) contains 47.3% cocoa components. Further characteristics (nutritional data) of these chocolate masses are given by.[Citation16] The specimens of cylindrical shape (14 mm in diameter and 7 mm in height) have been prepared.
Acoustic properties
The acoustic properties characterized by velocities of the longitudinal wave and transversal wave were measured. The velocities of the longitudinal wave cL and transversal wave cT were measured ultrasonically by pulse echo method using µDiSP system (Physical Acoustics Corporation, NJ, USA). The longitudinal wave velocity was determined with 3.5 MHz Gamma probe (Aerotech, Czech Republic), the transversal velocity was determined with normal incidence shear wave transducer V154 (Olympus, Japan) operating at 2.25 MHz. The knowledge of these velocities enables to evaluate the elastic behavior of the tested material in terms of Poisson’s ratio ν (EquationEquation 1a(1a)
(1a) ), Young’s modulus E (EquationEquation 1b
(1b)
(1b) ), shear modulus G (EquationEquation 1c
(1c)
(1c) ), and bulk modulus K (EquationEquation 1d
(1d)
(1d) ) according to the relations[Citation17]:
where ρ is the material density.
Uniaxial compression test
The compression tests were conducted using of TIRATEST 27,025 testing machine (TIRA Maschinenbau, Germany). A cylindrical sample of height lo and cross section Ao is compressed between two parallel metal plates at a fixed crosshead speed v. The force F and the compression are measured during compression and both quantities are recorded. The force-deformation data may easily be transformed into normalized quantities such as stress and strain. The Cauchy or engineering strain and Hencky’s natural or “true” strain are of common use in representing compression curves.[Citation18] The Cauchy strain measure, ε gives the relative deformation with respect to the initial sample height l0:
Hencky’s strain εH (often denoted as “true” strain) derives from the integration of the infinitesimal strain and reads:
The force F can be converted to the ultimate or engineering stress σ and/or to the true stress σtrue. The ultimate (engineering) stress is simply given as:
The true stress is evaluated using of the instantaneous cross section A. Its value is mostly obtained using assumption on the constant volume of the specimen[Citation19]:
The true stress is than expressed as:
The engineering strain rate is given as:
The true strain rate can be expressed as:
Compression tests were performed at the crosshead speeds (loading rates) 1, 10 and 100 m/s. For each loading rate, the test was repeated five times. To these loading rates correspond the constant engineering strain rates, see EquationEquation (7)(7)
(7) : 0.0024, 0.024 and 0.24 s−1. Specimens were compressed approximately to one half of the specimen length, i.e. to engineering strain 0.5. During the compression, the true strain rate increases. Example of the dependence
is shown in the . For each specimen, force displacement data were logged with time and were converted to stress-strain data using EquationEquations. (2)
(2)
(2) , (Equation3
(3)
(3) ), (Equation4
(4)
(4) ) and (Equation6
(6)
(6) ). All compression tests as well as the measurement of acoustics properties were performed at the temperature 10°C.
Figure 1. The dependence of the true strain rate on the engineering strain for white chocolate.
Statistical analysis
The experimental data were processed by MATLAB R2018b (MathWorks, Natick, MA, USA), which includes moduli for the statistical analysis and curve fitting. An analysis of variance (ANOVA) using a 95% significance level was employed to identify significant differences between the different types of chocolate. The results were presented as averages.
Results and discussion
Acoustic properties
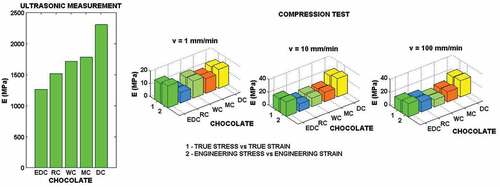
The results of density, velocities of the longitudinal wave cL and transversal wave cT of chocolate are given in the . Theoretical values of elastic properties of chocolate evaluated using of EquationEquations (1a(1a)
(1a) -Equation1d
(1d)
(1d) ) are given in the . According to the value of longitudinal wave velocity, the order of the different types of chocolate since minimum to maximum value is:
Table 1. Acoustical properties of the tested chocolates.
Table 2. Elastic properties of the tested chocolates.
If we use the values of transversal stress wave the order of chocolates is:
The order of chocolates according to the values of elastic moduli E, G a K is given by relation (9).
Compression loading
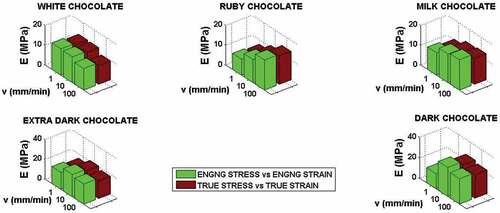
In the , example of compression curve in terms of stress versus strain is displayed. It is obvious that the true stress is lower than the engineering stress. Owing to the dependence of the true strain on the strain rate the dependence of the true stress on the true strain should be expressed as 3D curve, see the lower part of the . The stress-strain curves for all used loading velocities and chocolates are presented in the .
Figure 2. Example of the stress-strain curve for white chocolate. The difference between engineering and true stress strain dependences is shown in the upper part of the figure. The lower part shows the loading history of the specimen in the space strain-strain rate – stress.
Figure 3. (a.) Stress-strain curves at loading rate 1mm/min, (b.) Stress-strain curves at loading rate 10mm/min, (c.) Stress-strain curves at loading rate 100mm/min.
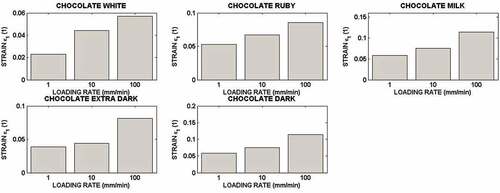
All curves exhibit two regionss of the stress-strain dependence. Some exception one can observe for the dark chocolate where some decrease of the stress at the end of compression occurs. In the first region , the stress rapidly increases with the strain. The difference between engineering stress and true one is very small, if not negligible. The extent of this region given by strain increases with the loading rate as it is shown in the . The analysis of these data shows that there is no statistically significant difference among tested chocolates. This limit strain ε1 increases with the loading rate.
Figure 4. Effect of loading rate on the extent of the first region of the stress-strain curve.
The difference between engineering and true stress is significant in the following region where the stress-strain curve exhibits much smaller steepness in comparison with the region I. This character of the stress strain curve is typical for many engineering materials.[Citation20] The first region is commonly interpreted as the region of elastic strain where the stress depends on the strain linearly. The second region is than connected with the permanent strain and other not reversible structure changes of the specimen material. The detail analysis of the curves in region I shows that the stress increases linearly with strain as:
This equation is valid both for the engineering and true values of stress and strain. Coefficients of EquationEquation (11)(11)
(11) are given in the .
Table 3. Parameters of linear function describing the engineering stress vs engineering strain dependence in the first region.
Table 4. Parameters of linear function describing the true stress vs true strain dependence in the first region.
Parameter b gives the slope of the initial linear region. This slope defines the material property known as the Young modulus E.[Citation21] This moduli is defined as:
It means that this moduli is equal to parameter b in the EquationEquation (11)(11)
(11) , thus E ≡ b. The values of moduli E are displayed in the . Analysis of these data shows that there is no statistically significant difference among chocolates Ruby, Extra Dark, Milk and White. Significant difference was found for the dark chocolate. Its E moduli is higher than that for remaining tested chocolate. The moduli E evaluated from the engineering stress-engineering strain curves are slightly higher than those evaluated from the true stress-true strain curves.
Figure 5. Parameters of non linear function describing the dependence true stress vs true strain in the second region.
The values of E moduli found in the given paper are lower than those obtained by[Citation9] from the compression tests performed at similar strain rates as in the present paper. Our results are similar to those reported by.[Citation21] In this paper, results of tensile uniaxial tests are presented. All elastic moduli obtained from the uniaxial stress loading are significantly lower than those obtained from the acoustical properties using EquationEquation (1b)(1b)
(1b) . This discrepancy was also reported for watermelon flesh – see.[Citation22] The values of the Poisson ratio νis similar to that obtained from the uniaxial tension test.[Citation21] E moduli found for chocolates white, ruby and milk exhibit an increase with the loading rates ().
Figure 6. Parameters of linear function describing the engineering stress vs engineering strain dependence in the second region.
This behavior is typical for viscoelastic materials. The viscoelastic properties of the milk chocolate were reported in paper of.[Citation9] In this paper, the constitutive equation describing the viscoelastic behavior of the chocolate was developed. The validity of this equation is limited to relatively small strain rates. Its extension to higher strain rates represents a problem of the next study.
The effect of the loading rate on the stress-strain curves is illustrated in the (engineering stress and strain) and in the (true stress-true strain). It is evident that in the region where the stress increases with strain linearly is this rate dependence significantly lower than that for larger strains. The true stress versus true strain in this region
, is fitted by non-linear function:
Figure 7. (a.) Effect of the loading rate on the stress vs strain dependence – engineering approach, (b.) Effect of the loading rate on the stress vs strain dependence – true values of stress and strain.
Values of coefficients of EquationEquation (13)(13)
(13) are given in the . The data engineering stress-engineering strain can be for some cases also fitted by linear function, see as an example. The linear approximation may be used for the most of experimental records σ (ε). The parameters of the linear functions (EquationEquation 11
(11)
(11) ) in region
are given in the . The sensitivity of the stress to the strain rate is given as:
Figure 8. Example of linear fit of engineering stress vs engineering strain.
Table 5. Best fittings parameters of EquationEquation (13)(13)
(13) and determination coefficients (R2) for true stress – true strain.
Table 6. Best fittings parameters of EquationEquation (11)(11)
(11) in the region
and determination coefficients (R2). Engineering stress-Engineering strain.
The procedure of the strain rate sensitivity is thus based on the dependence stress versus strain rate for a given value of strain. In this paper, we obtain data for the three values of strain rates. In the , the points stress vs strain rates are plotted. The used values of strain are higher than the maximum value of strain ε1.
Figure 9. Stress vs strain rate for different values of strain.
Owing to limited number of used strain rates, it is impossible to evaluate parameter according to EquationEquation (14)(14)
(14) . For chocolates: white, ruby and milk, the stress increases with strain rate. The value of stress is increased by the factor about three. Experimental data suggest the possible dependence
. The increase in the stress with strain rate for the dark chocolate is very similar with exception of higher values of strain. The dependence stress versus strain rate observed at chocolate extra dark exhibits another features. This is a consequence of the different shape of the stress-strain curve in comparison with remaining types of chocolate. The data describing the strain rate sensitivity were obtained from the data engineering stress versus engineering strain. The conclusions following from the data true stresstrue strain are qualitatively the same.
Conclusion
In the given paper, the behavior of five types of chocolate under quasi-static compression at three values of loading rate. The experiments were evaluated using both engineering stress-strain as well as true stress-strain curves. The curves exhibit two region of the deformation behavior. In the first region, since zero to some value of strain, the stress is linear function of the strain. The extent of this region is independent on the type of tested chocolate. The extent of this region increases with the loading rate. The stress in this region is only slightly dependent on the strain rate. Similarly as in some up to known works the slope of the stress-strain curve in the first region can be taken as the Young modulus E. The highest value of this modulus was obtained for the Dark chocolate. The values of elastic moduli for remaining chocolates are the same. These conclusions are the same both for engineering approach as well as for the true stress-strain representation. The obtained elastic moduli are significantly lower than those reported in some up to known papers. The values of this modulus are much lower than those obtained from the results of ultrasonic tests. This discrepancy may be given by the viscoelastic behavior of the tested chocolates. This hypothesis may be verified by the use of stress relaxation tests. At the same time, the results of the ultrasonic tests gives value of the Poisson ratio similar to that obtained from the compression test. In the second region, the increase of stress with strain is significantly lower than that in the first region. The sensitivity stress to the strain rate in the given region is much higher than that in the first region. The stress is mostly non-linear function of the strain. From this point of view, the strain behavior of tested chocolates during the compression exhibited very similar features like strain behavior of the most engineering materials (metals, polymers, etc.).
Ethical Review
This study does not involve any human or animal testing.
Informed consent
Written informed consent was obtained from all study participants.
Acknowledgments
This research was supported by the Internal Grant Agency of the Faculty of AgriSciences no. AF-IGA-2020-TP006 “Modelling of rheological properties of liquid and semi-liquid food raw materials and foods showing non-Newtonian behaviour” and by the European Regional Development Fund under Grant No. CZ.02.1.01/0.0/0.0/15_003/0000493 (Centre of Excellence for Nonlinear Dynamic Behaviour of Advanced Materials in Engineering).
Disclosure statement
No potential conflict of interest was reported by the authors.
Additional information
Funding
References
- Schenk, H.; Peschar, R. Understanding the Structure of Chocolate. Radiat. Phys. Chem. 2004, 71(3–4), 829–835. DOI: 10.1016/j.radphyschem.2004.04.105.
- Afoakwa, E. O.; Paterson, A.; Fowler, M. Factors Influencing Rheological and Textural Qualities in Chocolate - a Review. Trends Food Sci. Technol. 2007, 18(6), 290–298. DOI: 10.1016/j.tifs.2007.02.002.
- Tuenter, E.; Sakavitsi, M. E.; Rivera-Mondragón, A.; Hermans, N.; Foubert, K.; Halabalaki, M.; Pieters, L. Ruby Chocolate: A Study of Its Phytochemical Composition and Quantitative Comparison with Dark, Milk and White Chocolate. Food Chem. 2021, 343. DOI: 10.1016/j.foodchem.2020.128446.
- Afoakwa, E. O.; Paterson, A.; Fowler, M.; Vieira, J. Particle Size Distribution and Compositional Effects on Textural Properties and Appearance of Dark Chocolates. J. Food Eng. 2008, 87(2), 181–190. DOI: 10.1016/j.jfoodeng.2007.11.025.
- Glicerina, V.; Balestra, F.; Dalla Rosa, M.; Romani, S. Microstructural and Rheological Characteristics of Dark, Milk and White Chocolate: A Comparative Study. J. Food Eng. 2016, 169, 165–171. DOI: 10.1016/j.jfoodeng.2015.08.011.
- Servais, C.; Ranc, H.; Roberts, I. D. Determination of Chocolate Viscosity. J. Texture Stud. 2003, 34(5–6), 467–497. DOI: 10.1111/j.1745-4603.2003.tb01077.x.
- Chen, L.; Opara, U. L. Texture Measurement Approaches in Fresh and Processed Foods - a Review. Food Res. Int. 2013, 51(2), 823–835. DOI: 10.1016/j.foodres.2013.01.046.
- Bikos, D.; Samaras, G.; Cann, P.; Masen, M.; Hardalupas, Y.; Charalambides, M. N.; Hartmann, C.; German, J.; Vieira, J. Effect of Structure on the Mechanical and Physical Properties of Chocolate Considering Time Scale Phenomena Occurring During Oral Processing. Food Struct. Neth. 2022, 31, 100244. DOI: 10.1016/j.foostr.2021.100244.
- Bikos, D.; Samaras, G.; Cann, P.; Masen, M.; Hardalupas, Y.; Hartmann, C.; Vieira, J.; Charalambides, M. N. Effect of Micro-Aeration on the Mechanical Behaviour of Chocolates and Implications for Oral Processing. Food Funct. 2021, 12(11), 4864–4886. DOI: 10.1039/D1FO00045D.
- Beckett, S. T. The Science of Chocolate, 2nd; The Royal Society of Chemistry, 2008; DOI: 10.1039/9781847558053.
- Tscheuschner, H. D.; Markov, E. Instrumental Texture Studies on Chocolate: I. Methods of Measurement and Texture Characteristics. J. Texture Stud. 1986, 17(1), 37–50. DOI: 10.1111/j.1745-4603.1986.tb00712.x.
- Tscheuschner, H. D.; Markov, E. Instrumental Texture Studies on Chocolate II. Compositional Factors Influencing Texture. J. Texture Stud. 1989, 20(3), 335–345. DOI: 10.1111/j.1745-4603.1989.tb00444.x.
- Andrae-Nightingale, L. M.; Lee, S. -Y.; Engeseth, N. J. Textural Changes in Chocolate Characterized by Instrumental and Sensory Techniques. J. Texture Stud. 2009, 40(4), 427–444. DOI: 10.1111/j.1745-4603.2009.00190.x.
- Lapčíková, B.; Lapčík, L.; Salek, R.; Valenta, T.; Lorencová, E.; Vašina, M. Physical Characterization of the Milk Chocolate Using Whey Powder. LWT. 2022, 154. DOI: 10.1016/j.lwt.2021.112669.
- Panda, S.; Chen, J.; Benjamin, O. Development of Model Mouth for Food Oral Processing Studies: Present Challenges and Scopes. Innovative Food Sci. Emerging Technol. 2020, 66, 102524. DOI: 10.1016/j.ifset.2020.102524.
- Kumbár, V.; Kouřilová, V.; Dufková, R.; Votava, J.; Hřivna, L. Rheological and Pipe Flow Properties of Chocolate Masses at Different Temperatures. Foods. 2021, 10, 11. DOI: 10.3390/foods10112519.
- Millett, J. C. F.; Bourne, N. K.; Stevens, G. S. Taylor Impact of Polyether Ether Ketone. Int. J. Impact Eng. 2006, 32(7), 1086–1094. DOI: 10.1016/j.ijimpeng.2004.09.008.
- Peleg, M. A Note on the Various Strain Measures at Large Compressive Deformations. J. Texture Stud. 1984, 15(4), 317–326. DOI: 10.1111/j.1745-4603.1984.tb00389.x.
- Casiraghi, E. M.; Bagley, E. B.; Christianson, D. D. Behavior of Mozzarella, Cheddar and Processed Cheese Spread in Lubricated and Bonded Uniaxial Compression. J. Texture Stud. 1985, 16(3), 281–301. DOI: 10.1111/j.1745-4603.1985.tb00697.x.
- Black, J. T.; Johser, R. A. DeGarmo’s Materials and Processes in Manufacturing, Wiley, 864 p. ISBN-13 978-1118987674
- Svanberg, L.; Ahrné, L.; Lorén, N.; Windhab, E. A Method to Assess Changes in Mechanical Properties of Chocolate Confectionery Systems Subjected to Moisture and Fat Migration During Storage. J. Texture Stud. 2012, 43(2), 106–114. DOI: 10.1111/j.1745-4603.2011.00320.x.
- Ikeda, T.; Choi, P.; Ishii, T.; Arai, I.; Osawa, M. Firmness Evaluation of Watermelon Flesh by Using Surface Elastic Waves. J. Food Eng. 2015, 160, 28–33. DOI: 10.1016/j.jfoodeng.2015.03.020.