
 ?Mathematical formulae have been encoded as MathML and are displayed in this HTML version using MathJax in order to improve their display. Uncheck the box to turn MathJax off. This feature requires Javascript. Click on a formula to zoom.
ABSTRACT
This research is part of an effort to enhance fermented whey proteins’ quality and nutritional value. In this research, we investigated the feasibility of using a natural fermentation approach on whey proteins. We determined the protein digestibility, non-nutritive compounds (including phenolic compounds and saponins), and microbiological quality of water kefir-fermented whey proteins. Due to the water kefir-induced fermentation of whey proteins, the protein digestibility improved from 88.48 to 94.33%. The protein quality of fermented whey proteins has been modified after the water kefir fermentation, as observed with the changes in the secondary protein structure components, especially α-helices (decreased from 10.58 to 8.52%) and random coil (increased from 12.25 to 17.33%). In addition, their water solubility, surface hydrophobicity, and surface charge changed significantly (P < .05) during the fermentation time; 88.44 to 94.11%, 387.23 to 272.7 a.u. and −30.06 to −34.93 mV, respectively. Furthermore, water kefir is an excellent source of fermenting microorganisms, including lactic and acetic acid bacteria and yeast. Thus, the water kefir fermentation approach could be an effective, practical, non-thermal approach for altering whey proteins.
Introduction
Recently, fermented dairy products have been increasingly widely consumed worldwide and have shown substantial consumption. Fermented food provides nutritional and health benefits.[Citation1] The popularity of fermented food could mainly be due to beneficial probiotics, bioactive metabolites, and postbiotic materials.[Citation2,Citation3] Intake of these can contribute to a healthy lifestyle and improve life expectancy. In addition, fermentation reduces anti-nutritional factors/compounds (such as saponins, amylase inhibitors, protease inhibitors, and phytic acid), which can help minimize protein digestibility difficulty.[Citation4] Typically, fermentation techniques can increase the nutritional value of products and improve their nutrient bioavailability.[Citation1]
Kefir grains are abundant in good bacteria strains, such as lactic acid bacteria (LAB) and acetic acid bacteria (AAB), which were proven to be effective in the removal of toxic, depletion of anti-nutritional factors, utilization of galactose and lactose contents, elevation in plant protein digestibility, increase in phenolic compounds and decrease in aglycone content.[Citation2,Citation4–6] Fermentation is a good strategy for boosting bioactive compounds, enhancing health functionalities, and modifying food matrixes using fermenting bacterial strains and their enzymes.[Citation7] Çabuk et al.[Citation6] demonstrated that fermentation with Lactobacillus delbrueckii increased pea protein digestibility from 80 to 85% after 5 days of fermentation.
Whey proteins are a natural by-product of the dairy industry and contribute around 20% of total bovine proteins. They are used to produce dairy products, such as cheese and yogurt. They are also extensively used as a supplement in the bodybuilding industry due to some features, including resistance to pepsin digestion, desirable functional properties, and excellent nutritional value.[Citation8,Citation9] Unfortunately, whey proteins have limited use in some food industries due to their performance under external conditions such as temperature, mineral levels, and pH. Various studies studied the effects and modification of treatments involving thermal, pH, chemical, physical, and ionic strength on whey proteins to improve their functional properties.[Citation1,Citation7,Citation10]
The study’s primary objective was to create high whey proteins that are easy to digest and improved with phenolic compounds. Recently, the demand for dairy-based fermented foods has grown in many countries.[Citation11] Fermented whey proteins may be an excellent value-added whey protein-based product since the process does not involve any chemical modifications. In addition, the fermented whey proteins do not create any additional problems related to allergies, lactose intolerance, and environmental issues. Therefore, developing a model for synthesizing fermented whey proteins with improved nutritional quality and high-quality proteins could help address the United Nations Sustainable Development Goal (SDG), i.e., SDG 2 Zero Hunger and SDG 3 Good Health and Well-Being. This study is the first research to evaluate the effects of the naturally occurring fermenting microorganisms in water kefir on the digestibility, quality, and structure of whey proteins.
Material and methods
Whey protein powder with a protein content of 86.63% ± 1.54 (determined using the Kjeldahl method, AOAC method 930.29)[Citation12] was purchased from LAC Global Brands (Malaysia, Penang) Sdn. Bhd. Fresh kefir grains were purchased from an online store (IHerb, Moreno Valley, USA). These materials were transported to the laboratories using appropriate manners as suggested by the sellers and kept refrigerated at 4°C.
Preparation of fermented whey proteins
Before the natural fermentation, water kefir was made by combing brown sugar (100 g) and kefir seeds (50 g) in distilled water (1,000 mL) before being kept in a refrigerated incubator (Faithful, SPX−70 BIV, Shanghai, China) for 72 days at 25°C Alrosan et al.[Citation4] During the incubation, the mixture was shaken thrice (every 8 hr) daily to keep the kefir seeds viable. The water kefir was then isolated from the kefir seeds using a sterile sieve.
The natural fermentation was performed in triplicate using a combination of water kefir (5 mL) and distilled water (95 mL) mixed with whey proteins (1%, w/v) in glass flasks. These mixtures were then incubated for 5 days at 25°C in the SPX−70 BIV refrigerated incubator. The mixtures were shaken thrice daily (every 8 hr) during the incubation. To determine the changes in the physicochemical, protein quality, composition, and microbial properties of the fermented whey protein mixtures, samples were collected every 24 ± 1 hr for 5 days (Days 1, 2, 3, 4, and 5). Unfermented whey proteins represented Day 0. All samples were analyzed in triplicate.
Total soluble solids (TSS) and pH
A digital refractometer (Hanna Instruments, HI96841, Woonsocket, USA) and a pH meter (Apera Instruments, PH820, Columbus, USA) were used to measure the TSS (expressed as °Brix) and pH, respectively, of the unfermented and fermented whey proteins.
Protein digestibility
The protein digestibility of the unfermented and fermented whey proteins was carried out following the procedure outlined by Almeida et al.[Citation13] Samples (250 mg) and pepsin (1.5 mg/mL) were dispersed in HCl (15 mL, 0.1 M) before being heated at 37°C for 3 hr using a water bath (Memmert, WB22, Schwabach, Germany). The mixtures were added with sodium azide (1 mL, 0.005 M) and NaOH (7.5 mL, 0.5 M) to suppress microorganisms’ growth in the protein. Pancreatin (10 mg) and phosphate buffer (10 mL, 0.2 M, pH 8.0) were added to the mixtures. Finally, the mixtures were incubated at 37°C for 24 hr. After the incubation, the mixtures were centrifuged (CN Meditech, CNME060222, Nanjing, China) at 10,000 ×g for 20 min. The protein digestibility (expressed in %) of the unfermented and fermented whey proteins was calculated using EquationEq. 1(1)
(1) .
where, NT, NB, and NS represent the nitrogen content of the samples before and after centrifugation and blank, respectively. Nitrogen content was determined using the Kjeldahl method (AOAC Method 930.29).[Citation12]
Nitrogen solubility index (NSI)
NSI of the unfermented and fermented whey proteins was performed using the procedure described by Alrosan et al.[Citation14] In brief, the protein samples (200 mg) were combined with distilled water (18 g). The pH of the mixtures was adjusted to pH 7.0 using 0.1 M HCl. After pH adjustment, the mixtures were stirred (1,000 rpm) using a magnetic stirrer (OHAUS, GUARDIAN 5000, New Jersey, United States). After stirring for an hr, the weight of the protein samples was corrected to 1% (w/v) using distilled water. Supernatants were collected after centrifugation at 10,000 ×g for 20 min using the CNME060222 centrifuge. Finally, the NSI of the unfermented and fermented whey proteins was calculated using EquationEq. (2)(2)
(2) .
where, NT, NB, and NS represent the nitrogen content of the samples before and after centrifugation and blank, respectively. Nitrogen content was determined using the Kjeldahl method AOAC.[Citation12]
Secondary protein structures
The secondary protein structures (β-sheets, random coils (RC), α-helices, and β-turns) of the unfermented and fermented whey proteins were determined using Fourier transform infrared (FTIR) spectroscopy (Shimadzu, IRAffinity−1S, Kyoto, Japan) based on the method described by Alrosan et al.[Citation14] The FTIR spectra were analyzed in the amide I region for β-sheets, RC, α-helices, and β-turns at the range between 1,600–1,639, 1,640–1,649, 1,650–1,660, and 1,661–1,699 cm−1, respectively.
Zeta potential
The surface charge of the unfermented and fermented whey proteins was performed according to the method described by Johnston et al.[Citation15,Citation16] using a zeta potential analyzer (Malvern Panalytical, Mastersizer 2000, Malvern, UK). The refractive index for whey protein samples and distilled water was 1.450 and 1.330, respectively.
Surface hydrophobicity
The surface hydrophobicity of the unfermented and fermented whey proteins was measured according to Johnston et al.[Citation15] with slight modifications. The protein samples were diluted with 10 mM sodium phosphate from 0.1 to 0.01% to prepare the calibration curve. Protein samples (100 mg) were diluted with 10 mM sodium phosphate in beakers and stirred using the GUARDIAN 5000 magnetic stirrer for 2 hr at room temperature. The diluted protein samples (4 mL), 8-anilino−1-naphthalene sulfonic acid (ANS; 20 μL, 8 mM), and 10 mM sodium phosphate were mixed and vortexed for 10 sec. The mixtures were left in the dark for 15 min for reaction. Fluorescence spectra (Agilent Instruments, Cary Eclipse, Santa Clara, USA) were obtained at emission and excitation wavelengths of 470 and 390 nm, respectively. The slit wavelength was 1 nm. The fluorescence intensity of protein dispersions of each concentration without ANS and blank ANS were also determined and used to subtract the intensities of samples containing ANS.
Phenolic compounds
Phenolic compounds of the unfermented and fermented samples were carried out according to Alrosan et al.[Citation4] In brief, protein dispersions (1 mL) blended with methanol (8 mL) were prepared. The mixtures were then sonicated (Elma Electronic, EP10H, Hamburg, Germany) for 3 min at 35°C. Then, the mixtures were kept at 4°C until the residues turned white. The mixtures were centrifuged at 10,000 ×g for 15 min using the CNME060222 centrifuge. The supernatants collected were filtered using a syringe filter (0.22 µm) before HPLC analysis. The sample preparation was carried out in a dark environment.
The phenolic compounds were separated using an HPLC system (Agilent, 1200 series, New Jersey, USA) equipped with an Agilent ZORBAX Eclipse Plus C18 column (4.6 mm × 250 mm). The injection volume was set at 40 µL, and a 0.7 mL/min flow rate was used. Acetonitrile (mobile phase A) and acetic acid (1%) diluted in distilled water (mobile phase B) were used as mobile phases. Phenolic compounds were measured at two different wavelengths, 254 and 272 nm. These phenolic compounds were quantified using standard curves for caffeic acid, catechin, chlorogenic acid, epicatechin, ferulic acid, gallic acid, quercetin, rutin, and sinapic acid.
Total phenolic content (TPC)
The TPC of the unfermented and fermented samples was determined using the Folin- Ciocalteu method following the procedure described by Alrosan et al.[Citation4] Protein sample (100 µL), distilled water (8.4 mL), and Folin – Ciocalteu substance (500 µL) were mixed in the test tube using the vortex for 4 min. Next, sodium carbonate (1 mL, 5%) was added to the mixture and placed on the vortex for 4 min. Finally, the mixture was placed in the dark for 1 hr before the read at wavelength 725 nm using a UV-vis spectrophotometer (Shimadzu, UV−3600, Tokyo, Japan). The results of the TPC were expressed as mg of gallic acid equivalent per 100 g (mg GAE/100 g).
Total saponin content (TSC)
The TSC of the unfermented and fermented samples was measured using a UV-vis spectrophotometer according to the procedure described by Xiao et al.[13] In brief, the protein samples (400 µL), vanillin – glacial acetic acid (200 µL, 5%), and perchloric acid (800 µL) in glass tubes, followed by heating in the water bath at 70°C for 15 min before being cooled in an ice bath. The protein sample (500 µL) was read at wavelength 546 nm using the UV−3600 UV-vis spectrophotometer. The result of the TSC was express of oleanolic acid per 100 g (mg OAE/100 g).
Simple sugars
The unfermented and fermented samples’ glucose, sucrose, and fructose contents were determined using HPLC based on Alrosan et al.[Citation4] Protein samples (1 mL) were combined with 1 mL distilled water and then vortex for 10 min, followed by centrifugation at 15,000 ×g for 10 min using the CNME060222 centrifuge. The supernatants were filtered using membrane filters with 0.45 µm pore size. The 1200 series HPLC system with a COSMOSIL Sugar-D column (4.6 mm × 250 mm) separated the glucose, fructose, and sucrose in the filtered supernatants. The column temperature, flow rate, and injection volume were set at 40°C, 1.2 mL/min, and 20 µL, respectively. The glucose, fructose, and sucrose were quantified using respective standard curves.
Microbiological quality
The spread plate method was used to determine the AAB, LAB, and yeast count of the unfermented and fermented samples Alrosan et al.[Citation3] Each sample was diluted, and 1 mL of each dilution was daubed on the solid medium by spreading it twice. Potato dextrose agar (PDA) under aerobic conditions at 25°C for 48 hr was used to determine the yeasts content. Meanwhile, MRS agar at 37°C for 24 hr under anaerobic conditions was used to determine the LAB and AAB contents.
Statistical analysis
The data analysis was conducted using SPSS program version 23.0 (IBM, Chicago, USA). Duncan’s multiple range test and one-way ANOVA were used; differences were considered significant at P < .05.
Results and discussions
Total soluble solids (TSS) and pH of fermented whey protein mixtures
The activity of LAB and AAB and their enzymes present in the water kefir led to the increase in acidity of the fermented whey protein mixtures throughout the fermentation period. The acidity of fermented whey protein mixtures during the fermentation with water kefir increased significantly (P < .05). The pH value changed from 6.89 ± 0.01 to 4.27 ± 0.01 until Day 2 of the fermentation period (). The release of some small fragments, such as amino acids and ammonium (NH4+), was attributed to these findings. According to Cabuk et al.[Citation6] and Jia et al.,[Citation17] LAB, AAB, and their enzymes significantly increase acidity throughout fermentation. On Day 5 of the fermentation, the pH value of the fermented whey protein mixtures reached around 3.44 ± 0.01. Similar results have been reported in existing studies reported by Alrosan et al.,[Citation3] Jia et al.,[Citation17] and Azi et al.[Citation2]
Table 1. Changes in the pH, total soluble solids (TSS, °Brix), protein digestibility (%), and sugar profile (g/L) of unfermented (Day 0) and fermented whey proteins (Day 1 to 5).
The TSS of the whey protein mixtures decreased significantly (P < .05) from 1.50 (ay 0) to 1.40 (Day 1) and then decreased to reach around 1.2 on Day 4 (). These results attributed the activity of some bacteria strains, such as AAB, LAB (Lactobacillus spp), and yeast, throughout the water kefir fermentation. Similar research by Azi et al.[Citation2] demonstrated that water kefir plays a significant role in decreasing the TSS of the soy-whey protein complexes, from 9.20 to 4.43 °Brix, after 5 days of fermentation. Furthermore, a study by dos Santos et al.[Citation18] reported that water kefir fermentation at 4% (w/v) led to a drop in the TSS, from 1.88 to 1.45 °Brix, of soymilk after fermentation (5 days at 25°C) with kefir.
Nitrogen solubility index (NSI) of fermented whey protein mixtures
The NSI of fermented whey proteins increased significantly (P < .05) from 89.44 ± 2.95 to 94.11 ± 1.82 until the end of the fermentation, i.e., Day 5 (). Solubility is an important functional property that plays a significant role in other functionalities of proteins, and it is considered a parameter in the production and processing of food.[Citation19] According to Tang et al.[Citation20] the increased protein solubility in water could be due to changes in the structure of globular proteins that increased the number of charged groups. However, Gantumur et al.[Citation21] demonstrated that increased protein solubility in water was possible following protein breakdown through fermentation. It was reported that solubility increased from 88.85 ± 0.86 to 94.78 ± 1.39 after treatment with fermentation by S. cerevisiae yeast.
Table 2. Changes in the solubility (%), surface hydrophobicity (a.u.), and surface charge (mV) of unfermented (Day 0) and fermented whey proteins (Day 1 to 5).
Protein quality of fermented whey protein mixtures
Protein digestibility
The protein digestibility of protein is crucial in evaluating its nutritional value. In this current study, the digestibility of whey proteins was reported to be ~ 88.48% (). Our findings are consistent with previous research, which observed that whey protein can be digested to around 88.48%.[Citation21] The digestibility of fermented whey proteins improved significantly (P < .05) throughout the fermentation with water kefir fermentation from 88.48 ± 0.94 (unfermented) to 94.33 ± 2.05% on Day 5. According to Alrosan et al.,[Citation3] the digestibility of quinoa proteins increased from 78 to over 87% after being treated with water kefir due to the activity of the fermenting microorganisms (LAB, AAB, and yeast) present naturally in water kefir. These results were consistent with our findings, given that water kefir is an excellent source of bacteria (Streptococcus, Leuconostoc, Lactococcus, and Lactobacillus) and a variety of yeasts (Kluyveromyces, Candida, and Saccharomyces).[Citation1,Citation2,Citation5,Citation22] Pranoto et al.[Citation23] reported that natural fermentation was effective on the sorghum protein digestibility, increasing it from 40.8 to 80.1% (). The protein digestibility of fermented whey proteins did not increase sginificantly from Day 2 to Day 5. However, the overall increase in whey protein digestibility of suggests depletion in the protein cross-linking of the fermented whey proteins with other compounds, such as phenolic compounds, saponin, and tannins.[Citation6,Citation24] In that regard, fermentation by Lactobacillus plantarum plays a significant role in the proteolytic activity during the fermentation, which is attributed to breaking down the protein into small fragments such as peptides and amino acids (). Lactobacillus spp. could contribute to cell-envelope proteinases throughout the fermentation.[Citation25] It has already been observed that protein could be broken down into oligopeptides (small peptides) throughout the fermentation with Lactobacillus involving various intracellular peptidases, exopeptidase, and proline-specific peptidases. A study by Jia et al.[Citation17] showed that Lactobacillus spp. fermentation could increase the hydrolysis of ovomucoid and ovalbumin throughout the fermentation period. Our findings are consistent with studies by Alrosan et al.[Citation3] and Ayala-Nino et al.,[Citation26] which showed that fermentation by Lactobacillus spp. leads to enhancing the digestibility of protein.
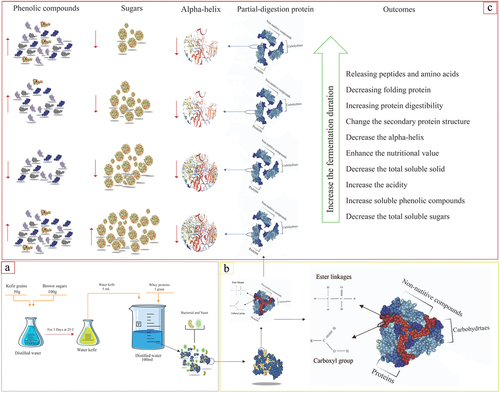
Figure 1. A schematic diagram illustrating the changes to the whey proteins in this study. (a) preparation of water kefir (50 g of kefir grains with 100 g of brown sugar in 1,000 mL) at 25°C and kefir water-based fermented whey proteins (1 g of casein protein, 5 mL of water kefir, and 95 mL of distilled water). (b) Illustration of the linkages between carbohydrates, protein, and non-nutritive compounds. (c) Outcomes of the water kefir fermentation on the whey proteins.
Secondary protein structures
The secondary protein structures of fermented whey proteins were measured during the 5 days of the water kefir fermentation using FTIR spectroscopy in the 1,600–1,700 cm−1 region (). The secondary protein structures of the unfermented whey proteins (Day 0) were observed to be β-sheets (33.70%), RC (12.25%), β-turns (43.48%), and α-helices (10.58%). A study by Alrosan et al.[Citation13] reported values of β-turns (44.89%), RC (12.75%), β-sheets (32.06%), and α-helices (10.30%), which are consistent with the current findings. The α-helices and RC ratio changed significantly (P < .05) throughout fermentation. In contrast, the β-turns and β-sheets ratio of fermented whey proteins showed insignificant differences (P > .05) during fermentation. This outcome indicates that the protein digestibility of whey proteins was increased after the water kefir fermentation. It has already been reported by Carbonaro et al.,[Citation27] the percentage of β-sheets increased during fermentation, indicating a decrease in protein digestibility.
Table 3. Changes in the percentage of secondary protein components (β-sheet, random coil (RC), α-helix, and β-turn) of unfermented (Day 0) and fermented (from Day 1 to 5) whey proteins based on FTIR measurements.
In particular, the α-helixes of the fermented whey proteins were modified during the 5 days of fermentation (), which indicates partial digestibility of fermented whey proteins because of yeasts, LAB, and AAB that are found in the water kefir. In this study, the α-helices ratio of fermented whey proteins decreased significantly (P < .05) from 10.58 to 8.52% on Day 0 (unfermented whey proteins) until the end of the water kefir fermentation. This finding provides clear evidence for enhancement of the protein digestibility of fermented whey proteins. It was reported by Wang et al.[Citation28] and Alrosan et al.[Citation4] that decreasing the α-helix ratio of proteins can improve protein digestibility. Meanwhile, the ratio of RC of fermented whey proteins increased significantly (P < .05) throughout the water kefir fermentation from 12.25 to 17.33% on Day 5.
This upward trend suggested that the whey proteins had accumulated. These findings are compatible with previous research that observed a decrease in the ratio of α-helix and an increase in the RC ratio throughout the fermentation, which leads to improved quality of the fermented protein. In this study, secondary protein structures of the fermented whey proteins were modified considerably more than in previous studies by Yasar et al.[Citation29] and Wang et al..[Citation28] Consequently, it is hypothesized that microbial fermentation has more significant positive effects on the secondary structure of fermented whey proteins than those that use high-heat and high-pressure food processing procedures such as extrusion, frying, and pelleting. According to Salazar-Villanea et al.,[Citation30] Yasar et al.,[Citation29] and Alrosan et al.,[Citation4] fermentation plays a significant role in changing secondary protein structure components, such as decreasing α-helices and increasing RC throughout the fermentation. The findings of this study are compatible with those of previous studies. These changes in modifications of protein structures during fermentation significantly enhance the quality of the fermented protein.[Citation29] Our findings demonstrated that the protein quality of fermented whey proteins has increased. Salazar-Villanea et al.[Citation30] reported that extending the fermentation period decreased the ratio of protein α-helix to β-sheet and enhanced the protein digestibility of fermented protein. In this study, the proportion of α-helix to β-sheet decreased throughout the fermentation time, ~25.11% on Day 2.
Non-nutritive compounds of fermented whey protein mixtures
Phenolic compounds are non-nutritive substances that have been reported to have the potential to play a significant role in the quality of protein.[Citation31] The phenolic compounds, which could be linked with macronutrients, such as protein and carbohydrates, by ester linkages, can be broken down throughout the fermentation process (). Phenolic compounds detected in unfermented whey proteins () were due to the presence of water kefir seed, which contains TPC ranging from 59.66 to 69.96 mg GAE/g.[Citation32] Overall, the TPC of fermented whey proteins remains relatively constant after fermentation. TPC in the protein suspension was raised. The TPC of fermented whey proteins increased, but insignificantly (P > .05), to 8.50 ± 1.15 mg GAE/100 g on Day 2.
Table 4. Changes in the total phenolic content (TPC, expressed in mg GAE/100 g) and phenolic compounds (mg/100 g) of unfermented (Day 0) and fermented (from Day 1 to 5) whey proteins.
Microbial fermentation releasing bound phenols could be one of the causes of the increase.[Citation33,Citation34] This result follows the outcomes of previous studies, whereby it was reported that TPC and some phenolic compounds increased because of the activity of the fermenting microorganisms and their enzyme presence in water kefir during fermentation.[Citation1,Citation5,Citation35] However, during fermentation, bacteria and their enzymes could break down some phenolic complexes to convert them to soluble phenolic compounds and simple sugars (), as proposed by dos Santos et al.,[Citation18] and Alrosan et al..[Citation4] It was reported by Aiello et al.,[Citation36] Tu et al.,[Citation5] and Alrosan et al.[Citation3] that water kefir fermentation can contribute to increasing the TPC throughout the fermentation based on the microorganisms and their enzymes. Lai et al.[Citation37] demonstrated that TPC increased from 4.60 ± 0.28 to 5.96 ± 0.17 mg GAE/g after the LAB fermentation in the initial period. In this study, the TPC declined during the last 3 days of the fermentation. This result is attributed to the degradation and hydrolysis of phenolic compounds by fermenting microorganisms, especially Lactobacillus strains, that present naturally in water kefir.[Citation38]
Rutin, caffeic acid, quercetin, catechin, chlorogenic acid, ferulic acid, gallic acid, sinapic acid, and synirgic acid were obtained in the fermented protein solution during fermentation (). The concentrations of all these phenolic compounds, except rutin, altered significantly (P < .05) during the water kefir fermentation. Certain phenolic compounds, such as quercetin, gallic acid, and catechin, have increased throughout the fermentation with Lactobacillus spp. This increment was believed to be due to the release of soluble phenolic compounds during fermentation. Significantly higher (P < .05) phenolic compounds were obtained on Day 3 during the water kefir fermentation. Additionally, the levels of rutin increased from 0.207 ± 0.005 mg/100 g to 0.216 ± 0.013 mg/100 g on Day 3 and then declined to 0.209 ± 0.002 mg/100 g on Day 5. The change in certain phenolic compounds could be attributed to the Lactobacillus spp. since they were reported to be capable of changing the forms of phenolic compounds.[Citation38] It has already been demonstrated that fermentation with LAB could increase TPC in soy, whereby the gallic acid content increased due to the degradation of tannins by tannases produced by LAB.[Citation39] In nature, phenolic compounds may occur as complex compounds with insoluble phenol that can form ester bonds with proteins and carbohydrates. (). These phenolics are connected to proteins and carbohydrates through their hydroxyl and carboxyl groups via ester bonds.[Citation1,Citation4] It was reported by Ajila et al.[Citation40] and dos Santos et al.[Citation18] that fermentation plays a significant role in releasing soluble sugar and phenolic compounds throughout the fermentation.
Surface charge of fermented whey protein mixtures
The surface charge of fermented and unfermented protein was examined during the water kefir fermentation since the surface charge could affect the functional properties of the protein. Zeta potential results showed the fermented whey proteins have a negative charge, between −30.06 to −34.93 mV (). The surface charge did not differ significantly (P > .05) between unfermented (Day 0) and fermented whey proteins on Day 1 of the water kefir fermentation. Our findings are consistent with the results accordingly by Alrosan et al.[Citation13] and Wang et al.,[Citation41] whereby the surface charge of whey proteins is reported to be approximately −34 mV. However, a gradual decrease in the surface charge of the fermented whey proteins throughout the fermentation was observed. The low negative values of surface charge detected on Day 0 meant that high amounts of sugars significantly increased the positive charge of amino acid residue.[Citation42] The microorganisms’ use of sugars as a source of energy for development and growth resulted in reduced total sugars in the protein throughout the water kefir fermentation. Thus, this is clear evidence to indicate that small particles of whey proteins were formed during the fermentation. Our findings are consistent with those of a study on whey protein concentrates conducted by Zhang et al.[Citation42]
Surface hydrophobicity of fermented whey protein mixtures
The surface hydrophobicity of fermented and unfermented whey proteins was monitored throughout the 5 days of water kefir fermentation (). The surface hydrophobicity of unfermented whey protein was around 387.23 ± 10, which decreased significantly (P < .05) to 272 ± 18 on the last day of the fermentation. Our findings are consistent with the results reported in the studies by Alrosan et al.[Citation13] and Wang et al.[Citation41] The decrease in the level surface hydrophobicity of fermented whey proteins is because of the unfolding of casein protein molecules based on microorganisms and their enzyme,[Citation21] exposing hydrophobic amino acids, which are hidden deep within the molecules of whey proteins.[Citation43] Moreover, the partial denaturation of whey proteins causes a decreased level of surface hydrophobicity based on the exposed hydrophobic group.[Citation44] On Day 5 of fermentation, the fermented whey proteins showed decreased surface hydrophobicity, linked to a modification in their protein structure.[Citation28] Furthermore, the increase in the negative charge of fermented protein led to a decrease in surface hydrophobicity. It resulted in the decreased binding level of ANS to ligands.[Citation45]
Simple sugars of fermented whey protein mixtures
Brown sugar has been widely used to increase the beneficial effects of water kefir. The typical composition of brown sugar predominantly consists of sucrose (~85%), with the remaining being fructose and glucose.[Citation18] The presence of fructose, glucose, and sucrose in the protein solution was observed during the water kefir fermentation. The findings from this study showed that throughout the water kefir fermentation in whey protein mixtures, sucrose levels significantly (P < .05) decreased around 0.09 ± 0.002 g/L on Day 2 (). In contrast, the glucose and fructose increased due to the enzymatic hydrolysis of sucrose during the initial fermentation period (Day 1). Fermenting microorganisms in the water kefir can derive the energy necessary for developing and expanding their colonies from simple sugars.[Citation23] The glucose, fructose, and sucrose levels decreased significantly (P < .05) on Day 3 of fermentation and continued to decrease until Day 5. These findings agree with previous studies by Tu et al.[Citation5] and Alrosan et al.[Citation3] Meanwhile, the quantities of fructose and glucose had increased in the fermented whey proteins on Day 2 of the water kefir fermentation (), followed by a gradual decrease in the glucose, fructose, and sucrose levels until the last day (Day 5).
Microbial quality of fermented whey protein mixtures
Water kefir has an excellent composition of various microorganisms, such as LAB (Streptococcus, Lactococcus, and Lactobacillus spp.), as well as AAB and yeasts (Kluyveromyces, Saccharomyces, and Candida).[Citation1,Citation5,Citation22] The protein solution used in this study provides an ideal environment for the development and growth of LAB, AAB, and yeasts. Yeasts are responsible for a significant portion of the utilization of sucrose as a source of energy, whereby they can convert sucrose into fructose and glucose, ultimately leading to ethanol production Azi et al.[Citation2] Nevertheless, glucose and fructose are the primary carbon sources for LAB, compared to AAB, which utilizes ethanol. The AAB, LAB, and yeasts have a corporative relationship during the water kefir fermentation.[Citation46]
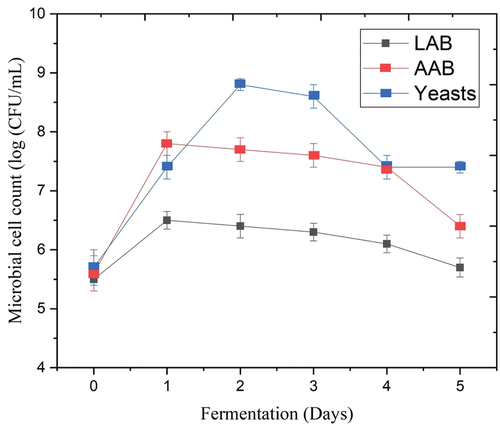
The LAB, AAB, and yeasts in the fermenting medium were numeration during the fermentation period (). The level of the AAB and yeast reached over 5.5 log CFU/mL and continued to increase significantly (P < .05) after 2 days of the water kefir fermentation to ~ 7 log CFU/mL. Meanwhile, the level of the LAB increased significantly (P < .05) to ~ 6.6 log CFU/mL on Day 1 and then decreased significantly until Day 5 (). The present investigation demonstrates that the microbial activity of the LAB, AAB, and yeasts found in water kefir is consistent with findings reported by Tu et al.[Citation5] Azi et al.,[Citation2] and Alrosan et al.[Citation3] In this study, the level of the yeasts increased from ~ 5.6 log CFU/mL on Day 0 and reached ~ 8.7 log CFU/mL on Day 2, and decreased to reach ~ 7.6 log CFU/mL at the end of the final day of the water kefir fermentation.
Figure 2. Microbial activity of lactic acid bacteria (LAB), acetic acid bacteria (AAB), and yeasts in the fermenting medium throughout the water kefir fermentation of whey proteins.
Conclusion
In this study, it was possible to successfully ferment whey proteins by employing water kefir as the starter culture. Natural fermentation using water kefir can enhance the protein digestibility of fermented whey proteins. The diverse fermenting microorganisms in water kefir (LAB, AAB, and yeast) are hypothesized to work synergistically to modify the whey proteins. These microorganisms could compensate for the limitations of individual fermenting microorganisms. These fermenting microorganisms and their natural enzymes have been linked to the degradation of protein complexes, as evidenced by a reduction in secondary protein structures. For example, α-helix decreased by ~ 1-fold following the fermentation process. Protein digestion of fermented whey proteins was improved after 2 days of water kefir fermentation. In future studies, further investigation is needed to discover the feasibility of other microbial or natural fermentation types to gain deeper insight into the processes contributing to whey proteins’ quality and fermentation behavior. Finally, although the results of this study show promising enhanced functionalities of fermented whey proteins, potential health side effects, which are equally important, were not investigated in this study.
Ethical approval
This article contains no studies with human participants or animals performed by authors.
Acknowledgments
The Fundamental Research Grant Scheme (FRGS/1/2019/STG01/USM/02/8) awarded by the Malaysian Ministry of Higher Education supported this project. The research was also partially funded by the Researchers Supporting Project number (RSP2023R502), King Saud University, Riyadh, Saudi Arabia. In addition, we gladly appreciate and thank the anonymous referees for their valuable remarks and recommendations for enhancing the manuscript.
Disclosure statement
No potential conflict of interest was reported by the author(s).
Additional information
Funding
References
- Alrosan, M.; Tan, T. C.; Koh, W. Y.; Easa, A. M.; Gammoh, S.; Alu’datt, M. H. Overview of Fermentation Process: Structure-Function Relationship on Protein Quality and Non-Nutritive Compounds of Plant-Based Proteins and Carbohydrates. Crit. Rev. Food Sci. Nutr. 2022. DOI: 10.1080/10408398.2022.2049200.
- Azi, F.; Tu, C.; Rasheed, H. A.; Dong, M. Comparative Study of the Phenolics, Antioxidant and Metagenomic Composition of Novel Soy Whey‐Based Beverages Produced Using Three Different Water Kefir Microbiota. Int. J. Food Sci. Technol. 2020, 55(4), 1689–1697. DOI: 10.1111/ijfs.14439.
- Alrosan, M.; Tan, T. C.; Easa, A. M.; Gammoh, S.; Alu’datt, M. H.; Aleid, G. M.; Alhamad, M. N.; Maghaydah, S. Evaluation of Quality and Protein Structure of Natural Water Kefir-Fermented Quinoa Protein Concentrates. Food Chem. 2023, 404, 134614. DOI: 10.1016/j.foodchem.2022.134614.
- Alrosan, M.; Tan, T. C.; Easa, A. M.; Gammoh, S.; Alu’datt, M. H.; Stankovic, M. Effects of Fermentation on the Quality, Structure, and Nonnutritive Contents of Lentil (Lens culinaris) Proteins. J. Food Qual. 2021, 2021, 1–7. DOI: 10.1155/2021/5556450.
- Tu, C.; Azi, F.; Huang, J.; Xu, X.; Xing, G.; Dong, M. Quality and Metagenomic Evaluation of a Novel Functional Beverage Produced from Soy Whey Using Water Kefir Grains. LWT. 2019, 113, 108258. DOI: 10.1016/j.lwt.2019.108258.
- Çabuk, B.; Nosworthy, M. G.; Stone, A. K.; Korber, D. R.; Tanaka, T.; House, J. D.; Nickerson, M. T. Effect of Fermentation on the Protein Digestibility and Levels of Non-Nutritive Compounds of Pea Protein Concentrate. Food Technol. Biotechnol. 2018, 56(2), 257–264. DOI: 10.17113/ftb.56.02.18.5450.
- Alrosan, M.; Tan, T. C.; Easa, A. M.; Gammoh, S.; Alu’datt, M. H. Recent Updates on Lentil and Quinoa Protein-Based Dairy Protein Alternatives: Nutrition, Technologies, and Challenges. Food Chem. 2022, 383, 132386. DOI: 10.1016/j.foodchem.2022.132386.
- Liu, H.; Li, Q.; Jiang, S.; Zhang, M.; Zhao, D.; Shan, K.; Li, C. Exploring the Underlying Mechanisms on NaCl-Induced Reduction in Digestibility of Myoglobin. Food Chem. 2022, 380, 132183. DOI: 10.1016/j.foodchem.2022.132183.
- Naclerio, F.; Seijo, M. Whey Protein Supplementation and Muscle Mass: Current Perspectives. Nutr. Diet. Suppl. 2019, 11, 37–48. DOI: 10.2147/NDS.S166195.
- Alrosan, M.; Tan, T. C.; Easa, A. M.; Gammoh, S.; Alu’datt, M. H. Molecular Forces Governing Protein-Protein Interaction: Structure-Function Relationship of Complexes Protein in the Food Industry. Crit. Rev. Food Sci. Nutr. 2022, 62(15), 4036–4052. DOI: 10.1080/10408398.2021.1871589.
- Mukherjee, A.; Gómez-Sala, B.; O’Connor, E. M.; Kenny, J. G.; Cotter, P. D. Global Regulatory Frameworks for Fermented Foods: A Review. Front Nutr. 2022, 9, 902642. DOI: 10.3389/fnut.2022.902642.
- Association of Official Analytical Chemists (AOAC). Official Methods of Analysis of AOAC, 19th ed.; AOAC International: Rockville, USA, 2012.
- Almeida, C. C.; Monteiro, M. L. G.; da Costa-Lima, B. R. C.; Alvares, T. S.; Conte-Junior, C. A. In vitro Digestibility of Commercial Whey Protein Supplements. LWT – Food. Sci. Technol. 2015, 61(1), 7–11. DOI: 10.1016/j.lwt.2014.11.038.
- Alrosan, M.; Tan, T. C.; Easa, A. M.; Gammoh, S.; Alu’datt, M. H. Mechanism of the Structural Interaction Between Whey and Lentil Proteins in the Unique Creation of a Protein Structure. J. Food Sci. 2021, 86(12), 5282–5294. DOI: 10.1111/1750-3841.15974.
- Johnston, S. P.; Nickerson, M. T.; Low, N. H. The Physicochemical Properties of Legume Protein Isolates and Their Ability to Stabilize Oil-In-Water Emulsions with and without Genipin. J. Food Sci. Technol. 2015, 52(7), 4135–4145. DOI: 10.1007/s13197-014-1523-3.
- Xiao, Y.; Xing, G.; Rui, X.; Li, W.; Chen, X.; Jiang, M.; Dong, M. Enhancement of the Antioxidant Capacity of Chickpeas by Solid State Fermentation with Cordyceps Militaris SN-18. J. Funct. Foods. 2014, 10, 210–222. DOI: 10.1016/j.jff.2014.06.008.
- Jia, J.; Ji, B.; Tian, L.; Li, M.; Lu, M.; Ding, L.; Liu, X.; Duan, X. Mechanism Study on Enhanced Foaming Properties of Individual Albumen Proteins by Lactobacillus Fermentation. Food Hydrocolloid. 2021, 111, 106218. DOI: 10.1016/j.foodhyd.2020.106218.
- dos Santos, J. M.; Quináia, S. P.; Felsner, M. L. Fast and Direct Analysis of Cr, Cd and Pb in Brown Sugar by GF AAS. Food Chem. 2018, 260, 19–26. DOI: 10.1016/j.foodchem.2018.03.106.
- Jiang, S.; Ding, J.; Andrade, J.; Rababah, T.; Almajwal, A.; Abulmeaty, M. M.; Feng, H. Modifying the Physicochemical Properties of Pea Protein by Ph-Shifting and Ultrasound Combined Treatments. Ultrason. Sonochem. 2017, 38, 835–842. DOI: 10.1016/j.ultsonch.2017.03.046.
- Tang, S. Q.; Du, Q. H.; Fu, Z. Ultrasonic Treatment on Physicochemical Properties of Water-Soluble Protein from Moringa Oleifera Seed. Ultrason. Sonochem. 2021, 71, 105357. DOI: 10.1016/j.ultsonch.2020.105357.
- Gantumur, M. A.; Sukhbaatar, N.; Shi, R.; Hu, J.; Bilawal, A.; Qayum, A.; Tian, B.; Jiang, Z.; Hou, J. Structural, Functional, and Physicochemical Characterization of Fermented Whey Protein Concentrates Recovered from Various Fermented-Distilled Whey. Food Hydrocolloid. 2023, 135, 108130. DOI: 10.1016/j.foodhyd.2022.108130.
- Ziarno, M.; Hasalliu, R.; Cwalina, A. Effect of the Addition of Milk Protein Preparations on Selected Quality Parameters and Nutritional Characteristics of Kefir. Appl. Sci. 2021, 11(3), 966. DOI: 10.3390/app11030966.
- Pranoto, Y.; Anggrahini, S.; Efendi, Z. Effect of Natural and Lactobacillus Plantarum Fermentation on in-Vitro Protein and Starch Digestibilities of Sorghum Flour. Food Biosci. 2013, 2, 46–52. DOI: 10.1016/j.fbio.2013.04.001.
- Chandra-Hioe, M. V.; Wong, C. H.; Arcot, J. The Potential Use of Fermented Chickpea and Faba Bean Flour as Food Ingredients. Plant Foods Hum. Nutr. 2016, 71(1), 90–95. DOI: 10.1007/s11130-016-0532-y.
- Yang, H.; Qu, Y.; Li, J.; Liu, X.; Wu, R.; Wu, J. Improvement of the Protein Quality and Degradation of Allergens in Soybean Meal by Combination Fermentation and Enzymatic Hydrolysis. LWT. 2020, 128, 109442. DOI: 10.1016/j.lwt.2020.109442.
- Ayala-Niño, A.; Rodríguez-Serrano, G. M.; Jiménez-Alvarado, R.; Bautista-Avila, M.; Sánchez-Franco, J. A.; González-Olivares, L. G.; Cepeda-Saez, A. Bioactivity of Peptides Released During Lactic Fermentation of Amaranth Proteins with Potential Cardiovascular Protective Effect: An in vitro Study. J. Med. Food. 2019, 22(10), 976–981. DOI: 10.1089/jmf.2019.0039.
- Carbonaro, M.; Maselli, P.; Nucara, A. Relationship Between Digestibility and Secondary Structure of Raw and Thermally Treated Legume Proteins: A Fourier Transform Infrared (FT-IR) Spectroscopic Study. Amino Acids. 2012, 43(2), 911–921. DOI: 10.1007/s00726-011-1151-4.
- Wang, Z.; Li, Y.; Jiang, L.; Qi, B.; Zhou, L. Relationship Between Secondary Structure and Surface Hydrophobicity of Soybean Protein Isolate Subjected to Heat Treatment. J. Chem. 2014, 2014, 475389. DOI: 10.1155/2014/475389.
- Yasar, S.; Tosun, R.; Sonmez, Z. Fungal Fermentation Inducing Improved Nutritional Qualities Associated with Altered Secondary Protein Structure of Soybean Meal Determined by FTIR Spectroscopy. Meas. 2020, 161, 107895. DOI: 10.1016/j.measurement.2020.107895.
- Salazar-Villanea, S.; Hendriks, W.; Bruininx, E.; Gruppen, H.; Van Der Poel, A. Protein Structural Changes During Processing of Vegetable Feed Ingredients Used in Swine Diets: Implications for Nutritional Value. Nutr. Res. Rev. 2016, 29(1), 126–141. DOI: 10.1017/S0954422416000056.
- Oomah, B. D.; Caspar, F.; Malcolmson, L. J.; Bellido, A.-S. Phenolics and Antioxidant Activity of Lentil and Pea Hulls. Food. Res. Int. 2011, 44(1), 436–441. DOI: 10.1016/j.foodres.2010.09.027.
- Yilmaz-Ersan, L.; Ozcan, T.; Akpinar-Bayizit, A.; Sahin, S. The Antioxidative Capacity of Kefir Produced from Goat Milk. Int. J. Chem. Eng. Appl. 2016, 7(1), 22–26. DOI: 10.7763/IJCEA.2016.V7.535.
- Đorđević, T. M.; Šiler-Marinković, S. S.; Dimitrijević-Branković, S. I. Effect of Fermentation on Antioxidant Properties of Some Cereals and Pseudo Cereals. Food Chem. 2010, 119(3), 957–963. DOI: 10.1016/j.foodchem.2009.07.049.
- Liyana-Pathirana, C. M.; Shahidi, F. Importance of Insoluble-Bound Phenolics to Antioxidant Properties of Wheat. J. Agric. Food. Chem. 2006, 54(4), 1256–1264. DOI: 10.1021/jf052556h.
- Gunenc, A.; Yeung, M. H.; Lavergne, C.; Bertinato, J.; Hosseinian, F. Enhancements of Antioxidant Activity and Mineral Solubility of Germinated Wrinkled Lentils During Fermentation in Kefir. J. Funct. Foods. 2017, 32, 72–79. DOI: 10.1016/j.jff.2017.02.016.
- Aiello, F.; Restuccia, D.; Spizzirri, U. G.; Carullo, G.; Leporini, M.; Loizzo, M. R. Improving Kefir Bioactive Properties by Functional Enrichment with Plant and Agro-Food Waste Extracts. Fermentation. 2020, 6(3), 83. DOI: 10.3390/fermentation6030083.
- Lai, L.-R.; Hsieh, S.-C.; Huang, H.-Y.; Chou, C.-C. Effect of Lactic Fermentation on the Total Phenolic, Saponin and Phytic Acid Contents as Well as Anti-Colon Cancer Cell Proliferation Activity of Soymilk. J. Biosci. Bioeng. 2013, 115(5), 552–556. DOI: 10.1016/j.jbiosc.2012.11.022.
- Adebo, O. A.; Gabriela Medina-Meza, I. Impact of Fermentation on the Phenolic Compounds and Antioxidant Activity of Whole Cereal Grains: A Mini Review. Molecules. 2020, 25(4), 927. DOI: 10.3390/molecules25040927.
- Muñoz, R.; de las Rivas, B.; de Felipe, F. L.; Reverón, I.; Santamaría, L.; Esteban-Torres, M.; Curiel, J. A.; Rodríguez, H.; Landete, J. M. Biotransformation of Phenolics by Lactobacillus Plantarum in Fermented Foods. In Fermented Foods in Health and Disease Prevention; 1st, Frías, J., Martínez-Villaluenga, C., and Peñas, E.; Eds; Academic Press; Cambridge, USA, 2017; p. 63–83. DOI: 10.1016/B978-0-12-802309-9.00004-2.
- Ajila, C.; Brar, S.; Verma, M.; Tyagi, R.; Valéro, J. Solid-State Fermentation of Apple Pomace Using Phanerocheate Chrysosporium–Liberation and Extraction of Phenolic Antioxidants. Food Chem. 2011, 126(3), 1071–1080. DOI: 10.1016/j.foodchem.2010.11.129.
- Wang, R.; Xu, P.; Chen, Z.; Zhou, X.; Wang, T. Complexation of Rice Proteins and Whey Protein Isolates by Structural Interactions to Prepare Soluble Protein Composites. LWT. 2019, 101, 207–213. DOI: 10.1016/j.lwt.2018.11.006.
- Zhang, J.; Liu, D.; Liu, Y.; Yu, Y.; Hemar, Y.; Regenstein, J. M.; Zhou, P. Effects of Particle Size and Aging of Milk Protein Concentrate on the Biophysical Properties of an Intermediate-Moisture Model Food System. Food Biosci. 2020, 37, 100698. DOI: 10.1016/j.fbio.2020.100698.
- Hiller, B.; Lorenzen, P. C. Functional Properties of Milk Proteins as Affected by Maillard Reaction Induced Oligomerisation. Food. Res. Int. 2010, 43(4), 1155–1166. DOI: 10.1016/j.foodres.2010.02.006.
- Li, T.; Wang, C.; Li, T.; Ma, L.; Sun, D.; Hou, J.; Jiang, Z. Surface Hydrophobicity and Functional Properties of Citric Acid Cross-Linked Whey Protein Isolate: The Impact of pH and Concentration of Citric Acid. Molecules. 2018, 23(9), 2383. DOI: 10.3390/molecules23092383.
- Shilpashree, B. G.; Arora, S.; Chawla, P.; Tomar, S. K. Effect of Succinylation on Physicochemical and Functional Properties of Milk Protein Concentrate. Food. Res. Int. 2015, 72, 223–230. DOI: 10.1016/j.foodres.2015.04.008.
- Gulitz, A.; Stadie, J.; Wenning, M.; Ehrmann, M. A.; Vogel, R. F. The Microbial Diversity of Water Kefir. Int. J. Food Microbiol. 2011, 151(3), 284–288. DOI: 10.1016/j.ijfoodmicro.2011.09.016.