
ABSTRACT
There is a global trend towards including children with special needs in mainstream schools instead of placing them in special schools. However, the numbers of students in special schools varies greatly among regions due to variations in educational systems, funding arrangements – and the incentives that are associated with these arrangements – and demographic trends. In the Netherlands, a new policy aimed at inclusive education was introduced in 2014, together with financial measures to equalise funding for students with special needs across the country. The present study explored the effects of this equalisation policy, as well as the demographic trend of population decline, on dropout rates and participation rates in special education (namely, special schools for mainstream education and schools for special education). The data were retrieved from nation-wide registration systems. The results showed that population decline did not affect participation rates in special education, whereas decreases in funding did result in greater declines in participation rates in special education. Moreover, decreases in funding also resulted in higher dropout rates in areas with growing student populations. Although the reform of funding arrangements resulted in lower participation in special education, higher dropout rates might be a cost of this shift towards inclusive education.
Over the last decade, the costs for educating students with special needs have risen in most countries (see e.g. Parrish et al. Citation2003; Graham and Sweller Citation2011), including the Netherlands (Minne, Webbink, and Van der Wiel Citation2009). The primary cause of this rise in costs seems to be the increasing numbers of students who participate in special education (Parrish et al. Citation2003). Funding arrangements and the incentives that are associated with these arrangements are found to play a key role in the number of students who participate in special education (Meijer Citation1999). The aim of the present study was to explore how funding arrangements can affect inclusive education by taking a 2014 policy reform in the Netherlands as a case study and to examine how this reform affected participation rates in special schools for mainstream education and schools for special education. Thereafter, we plan to elaborate on the various types of funding arrangements and the Dutch situation regarding policy reforms related to inclusive education.
Inclusive education in the Netherlands: financial and educational reforms
In several countries, the funding mechanisms of inclusive education have been reformed recently in response to the rising costs caused by growing numbers of students in special education and to growing concerns about the incentives in funding mechanisms for referring students with special needs to special education (Ferrier et al. Citation2007). About 4.5% of the Dutch students in primary education have special needs, which is comparable to other European countries (OECD Citation2012). In 2010, 38% of Dutch students with special needs were educated in mainstream schools. This number is lower than in all other European OECD countries, except France and Denmark (OECD Citation2012). The other students with special needs either attend special schools for mainstream education or schools for special education (Van Leeuwen, Thijs, and Zandbergen Citation2009). In special schools for mainstream education, students are taught the same subjects as their peers in mainstream schools. However, classes at special schools are smaller (Van Bergen et al. Citation2016) and, as a result, students can receive more guidance. In special schools for mainstream education, the secondary education focuses on practical training that prepares students to take part in society as independently as possible (Van Leeuwen, Thijs, and Zandbergen Citation2009). Particularly students with a learning disability more often attend special schools for mainstream education, whereas the majority of students with behavioural or physical problems attend schools for special education (Smits and Schoonheim Citation2016). The schools for special education are especially accommodated for students with a severe learning disability, chronic illness or serious behavioural problems. To diminish the growth in the number of students participating in schools for special education, the Dutch educational and funding system has undergone some major reforms since 1995.
Before 1995, funding for students in mainstream and special education was separated by distinct regulations and based on an input model, meaning the funding was based on the number of students with special needs in special education. For every student labelled as a special needs student, the schools received additional funding. The concern was that this focus on individual needs and corresponding individual budgets might create incentives for parents and educators to have students labelled as having special needs (Elster Citation1992). A study by Greene and Forster (Citation2002) indeed showed that more students were identified as having special needs and more students were placed in special education in states where schools had a financial incentive based on an input model. Thus, input-based funding does not encourage inclusive practices (Meijer Citation1999).
In 1995, the Together to School Again policy changed the funding mechanisms to a throughput model. In this type of model, budgets for special needs education are allocated to regional institutions by an institute on a central level. The allocation of funding is based on the total number of students in a region rather than on the number of students with special needs in that region. This allowed for the reallocation of some of the funding for special needs students in special schools for mainstream education to mainstream schools. For schools for special education, however, funding was still based on the number of students that were referred to these schools. With this throughput model, the actual allocation of funding within a region thus asks for a close collaboration between mainstream and special education. Therefore, the throughput model is regarded as the preferred model to enhance inclusive education (Meijer Citation1999; European Agency for Development in Special Needs Education Citation2013). A potential drawback of the model, however, is the centralised aspect of it. Money is divided among regions by the government, yet the actual decision on allocation to schools and students with special needs are made on a regional level (Pijl Citation2014). Therefore, the government cannot be sure the money is used to actually support inclusive education for students with special needs (Levačić and Downes Citation2004). The funding is available regardless of the activities that are undertaken (Meijer Citation1999). As part of the 1995 Together to School Again policy, new and strict criteria were implemented to prevent the increase of referrals to schools for special education, but it appears that the criteria were used inconsistently (Pijl Citation2016), and the number of students in special education kept rising (Koopman and Ledoux Citation2013).
In 2003, the funding for students in schools for special education was again changed by the Backpack policy. With this policy, students that met certain criteria received a so-called pupil-bound budget. Students and their parents could then decide on the best way to use this budget to meet the student’s needs. Students thus could use their funding to attend the school of their choice. Although the funding arrangements were different from the arrangements before 1995, for schools, funding was again based on the number of students that met particular criteria, so in effect, the Backpack policy again introduced an input model. The number of students in special education rose rapidly after the introduction of the Backpack policy (Smeets Citation2007). In addition, the number of students in mainstream education who were diagnosed with special needs also increased. Although this increase could be interpreted as the new system being more inclusive, experts pointed out that most of these students were already in mainstream schools or special schools for mainstream education, only without the additional funding (Pijl Citation2016).
In another attempt to make the Dutch educational system more inclusive, the Education Act for Students with Special Needs was introduced in 2014. The major principle of this act is that students, including students with special needs, should attend mainstream schools when possible. To prevent school dropouts, this act holds schools responsible for the enrolment of students in education. To achieve these goals, cooperation between schools and professionals was assumed to be essential. Therefore, regional partnerships Footnote1 were established to improve the sharing of resources and knowledge and to stimulate collaboration between schools. There are currently 77 regional partnerships for primary education and 75 for secondary education.
Historically, participation rates in special schools for mainstream education and schools for special education are relatively low in some regions in the Netherlands, whereas other regions show higher participation rates (see e.g. Roelfsema et al. Citation2011; Tierolf and Oudenampsen Citation2013), which is reflected in the participation rates of the regional partnerships. A review study has shown that there is no reason to assume that these regional differences are related to differences in student populations (Hover Citation2010). More likely, the differences are related to regional policy differences regarding the diagnostics of special needs and referrals to special education (Florian and McLaughlin Citation2008; Lambrechts et al. Citation2010).
Transition from an input model to a throughput model
Together with the enactment of the Education Act for Students with Special Needs in 2014, the funding arrangements were again changed. That is, the funding system transformed once again from an input model into a throughput model. Funding for special needs education was no longer based on the number of students with special needs served by a regional partnership, but on the total number of students served by that regional partnership. As a result, budgets for students with special needs were equalised across the country. Thus, in regional partnerships in which participation rates in special education were already low, this throughput policy resulted in increased budgets. Regional partnerships with high participation rates, on the other hand, had to deal with decreased budgets.
shows the distribution of equalisation rates in the regional partnerships in both primary and secondary education on the x-axis. All dots on the left of the vertical line represent regional partnerships with negative equalisation rates, whereas dots on the right represent regional partnerships with positive equalisation rates.
Figure 1. Distribution of equalisation rates (x-axis) and population rates (y-axis) in regional partnerships in primary and secondary education.
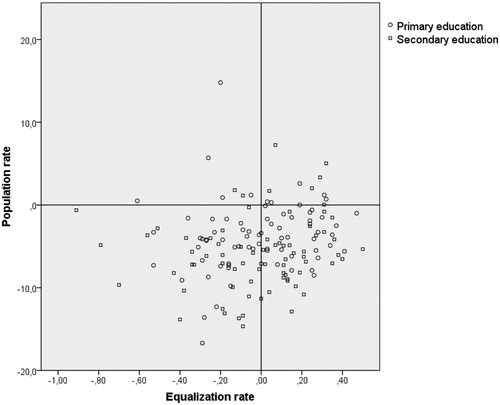
Although the throughput model is suggested to be the optimal way to realise inclusive education, a risk of the transition to a throughput model is that regions with many special needs students receive insufficient funding to support these students, possibly resulting in higher student dropout rates in the short term (Fletcher-Campbell et al. Citation2003). Moreover, the effects of financial and educational reforms might vary depending on a country’s context given certain demographic and contextual factors (Chong and Cheah Citation2010; OECD Citation2015). As in many other countries, in the Netherlands, the population of school-aged people from 0 to 20 years of age has decreased. It went down by 2.7% between 2011 and 2015, and is expected to further decrease in the coming years (Statistics Netherlands Citation2012). The rate of population decline, however, varies across regions and thus across regional partnerships, with greatest population decline rates in rural areas (Haartsen and Venhorst Citation2010). shows population rates in regional partnerships in both primary and secondary education. Population rates are plotted on the y-axis, with regional partnerships with student population decline below the horizontal line. The few regional partnerships with growing student populations are plotted above the horizontal line.
Declining student populations might interact with the inclusive education policy (Jepma and Beekhoven Citation2015). For example, the prospects of population decline put pressure on schools to apply strategies to retain students and meet the critical student intake numbers defined by the government (Inspectorate of Education Citation2012). In the report by the Dutch Inspectorate of Education (Citation2012), school leaders reported a number of actions that were taken to prevent the decline of student populations in schools. One of the strategies that was most often applied was to expand the type of educational activities offered by the mainstream schools, so that the needs of a wider range of students could be met and referral to special education could be circumvented in some cases. A second strategy was to intensify guidance for students with special needs, so that early dropout was prevented.
The present study
Studies examining data on financial allocation are needed to evaluate the efficiency and consequences of funding policies within countries regarding the inclusion of students with special needs (European Agency for Special Needs and Inclusive Education Citation2016). Although policies regarding the allocation of funding for inclusive education might be as important as the actual amount of funding (Parrish Citation2002), studies examining the role of funding allocation on inclusive practices are scarce (Fletcher-Campbell et al. Citation2003). Moreover, evaluative studies examining the effects of these reforms – such as the present study – should adopt a comprehensive approach in which not only financial information, but also the relevant demographic and contextual information, is taken into account (OECD Citation2015). For the Dutch context, Pijl (Citation2016) described the effects of the different funding models (until 2014) on the number of students with special needs in segregated settings. The aim of the present study was to explore the effects of the funding arrangement introduced in 2014 and demographic trends on dropout rates and participation rates in special for mainstream education and school for special education in the Netherlands. In particular, we aimed to answer the following research questions:
How have participation rates in special education and dropout rates in mainstream education developed since the Education Act for Students with Special Needs came into effect in 2014?
What has the effect of funding arrangements and demographic trends been on these developments?
Method
Data
The data were retrieved from the Open Education Data web portal (www.data.duo.nl). This portal brings together demographic, administrative and contextual information about students in all types of education. We chose to use enrolment data of 2012 as a starting point for our analyses. Although the specific funding arrangements from the Education Act for Students with Special Needs were not introduced until 2014, the regional partnerships were already established in the preceding years and enrolment data for these regional partnerships from the 2011/2012 school year was used as starting point for equalisation policy. The 2015/2016 school year was chosen for the outcome data, because that school year contained the most recent dropout data that was available.
In 2012, the data comprised information about 1,571,330 primary school and 1,006,720 secondary school students. The majority of these students were enrolled in mainstream primary or secondary education (respectively, n = 1,498,056 and n = 942,054). A total of 67,518 students were enrolled in special schools for mainstream education, including primary (n = 39,929) and secondary (n = 25,789) education. Moreover, 70,422 students were enrolled in schools for special education, including primary (n = 33,345) and secondary (n = 37,077) education. For each of these students, the datasets also provide information on the regional partnership that the student belongs to.
Measures
Participation rates
We define the indicator participation rates as the number of students enrolled in specials schools for mainstream education and schools for special education compared to the entire student population. Therefore, this rate was calculated by dividing the number of students enrolled in special schools for mainstream education and schools for special education within a regional partnership by the total number of students within that regional partnership. Next, we calculated growth rates for each regional partnership. These growth rates were calculated by extracting the participation rate in 2012 from the participation rate in 2015. A positive number thus indicates a growth in participation rate, whereas a negative number is indicative of a decrease in participation rate.
Dropout rates
The indicator for dropout rates includes two types of dropouts: first, students who live within the area of the regional partnership but are not registered at any school; second, students who are registered at a school but did not attend classes for a period of at least four weeks without a specific reason. Students who were absent due to medical reasons, for example, are not considered dropouts. The dropout rates in the current paper represent the average number of both types of dropouts in a regional partnership, as reported in the four quarterly self-reports for the 2015/2016 school year, divided by the total number of students per regional partnership in that year.
Estimated change in population rates
The change in population rates is calculated by dividing the estimated number of students in a regional partnership for 2020 by the number of students in that partnership in 2015. These numbers are based on the numbers of students in previous years and regional demographic developments, as retrieved from the Open Education Data web portal (www.data.duo.nl). Positive numbers thus represent a growing student population, whereas negative numbers represent a declining student population.
Equalisation rates
Equalisation rates indicate whether a region, or more specifically a regional partnership, receives more or less funding due to the reform of funding arrangements. When the funding arrangements changed from an input model to a throughput model in 2014, the financial support allocated to a regional partnership was calculated by multiplying the number of students within the partnership by a standard amount of funds per student. The equalisation rate per regional partnership was calculated by dividing the new budget by the former budget. Negative rates thus indicate a decrease in budget, whereas positive rates indicate an increase in budget.
Data analyses
This paper investigates how participation and dropout rates in the Netherlands have developed between 2012 and 2015, years which include the 2014 Education Act for Students with Special Needs. Therefore, we first compared participation rates for special schools for mainstream education and schools for special education between 2012 and 2015. Additionally, we analysed the change in participation rate with a two-way repeated measures ANOVA. Next, descriptive statistics of dropout rates, estimated population rates and equalisation rates were inspected, as well as correlations between these measures and changes in participation rates. Ultimately, we performed regression analyses to study the effects of estimated changes in population rates and equalisation rates on changes in participation rates and dropout rates. For these regression analyses, dummy variables were created for both independent variables.
Separate regression analyses were performed to examine changes in participation rates in special schools for mainstream education on the one hand, and schools for special education on the other. A third regression analysis was performed with dropout rates as the dependent variable. In the first step, the dichotomised variables of (1) estimated population rates (decline; growth), (2) equalisation rates (negative; positive) and (3) level of education (primary; secondary) were included as predictors. In Step 2, we included two-way interactions between the three predictor variables. Ultimately, in Step 3, the three-way interaction between estimated population rates, equalisation rates and level of education was included.
Results
Participation rates and dropout rates
presents descriptive statistics of the participation rates of the regional partnerships in primary education and secondary education in 2012 and 2015. In addition, dropout rates in primary and secondary education are displayed. The results show that in primary education, participation rates have significantly decreased between 2012 and 2015 for both special schools for mainstream education and schools for special education, yet the change is larger for special schools. In contrast, participation rates in the secondary special schools for mainstream education increased between 2012 and 2015. Changes in participation rates between 2012 and 2015 in secondary schools for special education were non-significant. The results, however, also show a wide variation in participation rates and the change thereof between regional partnerships in both types of education. The results also show variation in dropout rates in regional partnerships in both primary and secondary education. The percentage of dropouts, however, is generally low, with a mean of 0.02% in primary education and 0.002% in secondary education.
Table 1. Participation rates (in percentages) and dropout rates (in percentages) of the regional partnerships in primary (n = 77) and secondary education (n = 75).
Population rates and equalisation rates
Descriptive statistics for estimated changes in population rates and equalisation rates are presented in . Regional partnerships again show variation in the estimated changes in population rates. Overall, the number of students at Dutch primary and secondary schools is estimated to decline by 3.8% in primary and 5.9% in secondary education between 2015 and 2020. With regard to equalisation rates, the descriptive statistics in shows that the total budget for students with special needs did not change substantially, yet the distribution over regional partnerships was changed. In both primary and secondary education, 38 regional partnerships in primary education and 34 regional partnerships in secondary education experienced negative equalisation rates, whereas the other regional partnerships experienced positive equalisation rates.
Table 2. Estimated population rates and equalisation rates of the regional partnerships in primary (n = 77) and secondary education (n = 75).
Relationships between (changes in) participation, dropout, population and equalisation rates
presents correlations between all measures for primary and secondary education separately. The change in participation rates in special primary or secondary schools for mainstream education did not correlate with the change in participation rates in schools for special education. The changes in participation rates in both types of education also did not correlate with dropout rates. In secondary education, however, dropout rates did correlate with estimated population rates: the higher the estimated rate of population decline, the lower the dropout rates.
Table 3. Correlations between changes in participation and dropout rates, estimated population change, and equalisation rates for the regional partnerships in primary (n = 77) and secondary education (n = 75).
In primary education, the estimated change in population rates correlated positively with the change in participation rates in special schools for mainstream education, whereas this correlation was non-significant in secondary education. Thus, the greater the estimated decline in population, the greater the decline in participation in special primary schools for mainstream education, but not in special secondary schools for mainstream education. In addition, equalisation rates were found to be correlated with changes in participation rates in primary education: regional partnerships with negative equalisation rates showed declines in participation rates in both specials primary schools for mainstream education and schools for special education. However, in secondary education, equalisation rates were only correlated with participation rates in schools for special education, whereas the correlation with participation rates in special schools for mainstream education was non-significant.
The effects of equalisation and population rates on the development of participation rates
Regressions analyses were performed to examine the predictive role of estimated population rates and equalisation rates in relation to the changes in participation rates and dropout rates. To examine whether the effects differed for primary and secondary education, educational level (primary; secondary) was added as a third predictor variable. In the second step, two-way interactions between the three predictor variables were added. In the third step, a three-way interaction was added. presents the results.
Table 4. Standardised regression coefficients for the role of population and equalisation rates in changes in participation rates in special schools and special education.
Concerning participation rates in special schools for mainstream education, results show a significant main effect for level of education. Participation rates in special primary schools for mainstream education decreased, whereas participation rates in special secondary schools for mainstream education increased. In the final model, there were no significant effects for estimated changes in population rates or for equalisation rates (Model 2), nor was there a significant interaction between the three predictor variables (Model 3). Altogether, the full model explains 35% of the variability in change in participation rates in special schools for mainstream education.
With regard to changes in participation rates in schools for special education, the results showed a main effect of equalisation rates in Model 1. Generally, regional partnerships with negative equalisation rates showed decreasing participation rates in schools for special education, whereas regional partnerships with positive equalisation rates showed stable or slightly increasing participation rates. The significant interaction between equalisation rates and level of education in Model 2 and Model 3, however, showed that the effect of equalisation rates on change in participation rates in special education differed for regional partnerships in primary and secondary education. With a significant effect of equalisation rates on the change in participation rates in special education in secondary education and a marginal trend (p = .074) in primary education, the results indicated that the effect of equalisation rates was stronger in secondary than in primary education. The full regression model explains 26% of the variability in change in participation rates in schools for special education.
The effect of equalisation and population rates on dropout rates
presents the results of the regression analysis examining the predictive role of estimated changes in population rates and equalisation rates on dropout rates. Again, educational level was included as a separate predictor variable. The three-way interaction effect in the final model was found to be significant. This indicates that the effect of equalisation rates differs for regions with differing estimates of population rates, but this effect is not the same in primary and secondary education. Regression analyses for the two levels of education separately, indicated that there is no predictive effect of estimated change of population rates (β = .20; t = 1.49; p = .140) nor of equalisation rates (β = −.08; t = −0.37; p = .715) on dropout rates in secondary education. The interaction effect of estimated change of population rates by equalisation rates was also non-significant (β = −.06; t = −0.27; p = .785). In primary education, on the other hand, both main effects (β = .36; t = 3.45; p = .001 and β = −.44; t = −2.96; p = .004, respectively) as well as the interaction effect were significant (β = −.50; t = 3.42; p = .001). That is, in regional partnerships with positive equalisation rates, dropout rates in primary education were low in both partnerships with estimated decreases and partnerships with estimated increases in population rates. In contrast, dropout rates in primary education were lower in regional partnerships with negative equalisation rates and decreasing estimated population rates, whereas dropout rates were higher in regional partnerships with negative equalisation rates and increasing estimated population rates. shows that 42% of the variability in dropout rates can be explained by the predictors in Model 3.
Table 5. Standardised regression coefficients for the effect of estimated change in population and equalisation rates on changes in dropout rates.
Discussion
Following the global trend towards inclusive education, the Netherlands introduced the Education Act for Students with Special Needs in 2014 to promote the inclusion of students with special needs in mainstream education. Another important goal of this act was to reduce dropout rates. The aim of this study was to examine the effects of this major policy change and accompanying changes in funding arrangements on changes in participation rates in special schools for mainstream education and schools for special education, as well as on the number of dropouts in mainstream education. Secondly, we aimed to examine the relationship between changes in population rates and funding arrangements on the one hand and special education participation rates and mainstream education dropout rates on the other in the 152 regional partnerships in the Netherlands. Overall, the results showed a decrease in participation rates and lower dropout rates in primary education. Dropout rates were lower in secondary education as well, but participation in special secondary education did not decrease. The changes in participation rates in special education were not found to be predicted by demographic trends of population decline. In contrast, the equalisation rates were found to be predictive of participation rates, yet in special education only. With regard to dropout rates, the results showed an interaction between equalisation rates and demographic trends in primary education, with higher dropout rates in regions with a combination of increasing student population rates and decreasing financial support.
The development of participation rates in special schools for mainstream education and schools for special education
Generally, participation rates in primary education in special schools for mainstream education and schools for special education have decreased over the period from 2012 to 2015, which includes the introduction of the 2014 Education Act for Students with Special Needs. In secondary education, on the other hand, participation rates have not decreased. Participation in special schools for mainstream education increased, whereas participation rates in schools for special education remained stable. This might be due to the more complex organisational structure of secondary education, because of which teachers are less willing to include students with special needs (Van Leeuwen, Thijs, and Zandbergen Citation2009). In addition, the results showed that dropout rates were generally low. This is in accordance with studies showing that more than 99% of all students between the ages 4 and 15 are enrolled in education in the Netherlands (Ministry of Education, Culture and Science Citation2007).
The effect of population rates and equalisation rates on the development of participation rates
Although the results showed a general decrease of participation rates in schools for mainstream education and schools for special education for primary education and increasing or stable rates for secondary education, participation rates were found to vary greatly between regions. In both levels of education (primary and secondary), participation in schools for special education decreased in a number of regions, whereas it increased in other regions. The changes in participation rates in both special schools for mainstream education and schools for special education was not affected by estimates of population declines.
Conversely, equalisation rates were found to be predictive of participation rates in schools for special education. In general, participation in schools for special education decreased in regions with negative equalisation rates, whereas regions with positive equalisation rates showed stable or slightly increasing participation in schools for special education. These findings are in line with the intentions of the financial equalisation policy to reduce differences in participation rates in schools for special education between regions within the Netherlands. In contrast, equalisation rates were not found to predict participation rates in special schools for mainstream education. Costs per students are two times higher in special schools for mainstream education than in mainstream schools, whereas in schools for special education, costs per students are four times higher than in mainstream schools (Minne, Webbink, and Van der Wiel Citation2009). A reduction in the number of students in schools for special education yields the greatest gains and is therefore more cost-effective in regions with negative equalisation rates. Moreover, most students who left schools for special education enrolled in special schools for mainstream education. As a result, the effect of equalisation rates on participation rates in special schools for mainstream education might be masked by the enrolment of students from schools for special education.
The effect of equalisation rates and population rates on dropout rates
Similar to the variation in participation rates, results showed generally lower dropout rates, though there was major variation in dropout rates between regions. This variation in dropout rates was found to be predicted by population rates as well as equalisation rates, yet only in primary education and not in secondary education. According to a report by the Dutch Inspectorate of Education (Citation2012), schools with declining student populations are at a greater risk for declining quality of education. Declining student populations often result in classrooms in which students from different years and levels are combined. According to school leaders, this demands more advanced skills from teachers, which results in an increase in workload (Smeets et al. Citation2013). Moreover, small schools have limited access to specialists and assistants within their school environment. These consequences are expected to have a greater impact in primary than in secondary education, since schools in secondary education in general have higher numbers of students to start with (Jepma and Beekhoven Citation2015). The results of the present study seem to indicate that schools for secondary education indeed experience less pressure to respond to population declines than schools for primary education. Although negative equalisation rates were related to decreases in participation rates in secondary schools for special education, it did not relate to higher dropout rates. This might indicate that students who left schools for special education were successfully enrolled in either schools for mainstream education or special schools for mainstream education, thereby preventing actual dropouts. The increase in participation rates in special schools for secondary education seems to support this explanation. However, the number of 16- and 17-year-olds with an exemption from schooling has also increased over the last few years (Berling, Lubberman, and Witteman-van Leenen Citation2016). Thus, the low number of dropouts in secondary education might also be reduced because students at risk for dropping out were exempt from schooling. In contrast to the lack of effects in secondary education, both population and equalisation rates were found to have an effect on dropout rates in primary education. Regional partnerships with positive equalisation rates showed low dropout rates, regardless of whether the population was estimated to grow or decline. In areas with growing student populations, there is no demographic incentive to expand activities in order to prevent the dropout of students. Regional partnerships with positive equalisation rates in areas with growing student populations nevertheless also show low dropout rates. A possible explanation for this is that in these regional partnerships, additional budgets for children with special needs are used to intensify guidance for students with special needs, which helps to prevent dropout.
The results suggest that the demographic trend of population decline also encouraged regions with negative equalisation rates to prevent dropout of students with special needs, even though budgets for students with special needs were reduced. In regions with estimates of growing population rates and negative equalisation rates, on the other hand, dropout rates were found to be higher. Especially in these regions, more students make the transition from special to mainstream education. According to principals and school leaders, this transition has resulted in an increase in problems in mainstream education (De Boer and Van der Worp Citation2016). Regional partnerships, however, have limited budgets to support students with special education needs and there is no demographic incentive to prevent dropouts of these students. To help schools to use their resources to more effectively respond to the increasing number of students with special needs in mainstream education, support and guidance should be provided to mainstream schools (National Council for Special Education Citation2014). Moreover, Meijer (Citation1999) proposes a combination of a throughput model and an output model in which funding is related to dropout rates or student outcomes to effectively realise the goals of inclusive education. An additional evaluation might provide an incentive for preventing dropouts, which is currently missing. The results of the present study suggest that without this type of evaluation, high dropout rates might be a cost of the shift towards inclusive education.
Limitations and suggestions for future research
This study provides insights into the interaction between funding arrangements and demographic trends in realising inclusive education in the Netherlands. Nonetheless, the study has several limitations. First, the number of dropouts was self-reported by the regional partnerships. Although the Dutch Inspectorate of Education supports the general definition of dropouts as students that do not attend school for a combination of reasons, regional partnerships might still apply varying definitions to define the number of dropouts. Therefore, the registration of dropouts by the regional partnerships is potentially biased. Nonetheless, the registration is a good indication of the number of students for whom the regional partnerships have duty to address the problem of dropouts. Secondly, the participation rates in this study were calculated based on enrolment numbers of 2012 and 2015. The Education Act for Students with Special Needs was introduced in August 2014 and was still in its infancy in 2015. The effects of this policy change may need more time to show up. Thirdly, we do not know how changes in funding arrangements relate to specific investments. Ultimately, we cannot conclude from this study which effects the decreasing participation rates in special schools for mainstream education and schools for special education have on students’ academic or social–emotional development. Future research is needed to gain more insights into these effects of the 2014 Education Act for Students with Special Needs. Combining quantitative data (e.g. student enrolment) with qualitative data (e.g. teacher interviews) could provide valuable information about the underlying processes.
Conclusion
The present study aimed to evaluate the influence of funding arrangements and demographic trends in the realisation of inclusive education in the Netherlands. In primary education, this study showed decreasing participation rates in special schools for mainstream education as well as in schools for special education. In secondary education, however, participation rates in special schools for mainstream education increased and participation rates in schools for special education remained stable. The financial equalisation policy that was introduced simultaneously did affect the participation rates of students with special needs in schools for special education. Regional partnerships with negative equalisation rates showed the greatest declines in participation rates in schools for special education. However, the demographic trend of population decline did not affect changes in participation rates in special schools for mainstream education or schools for special education. The results of the present study, however, do indicate that the shift towards inclusive primary education seems to result in higher dropout rates in regions with growing student populations. Therewith, the costs of the intended effect of negative equalisation on participation rates in areas with growing student populations seems to be that there are more dropouts. The present study shows that funding arrangements and changes in population rates both play a role in realising inclusive education, yet, the mechanisms behind this are complex.
Disclosure statement
No potential conflict of interest was reported by the authors.
Notes on contributors
Joyce Gubbels, PhD, is postdoctoral researcher at Maastricht University and the Dutch Inspectorate of Education. Her research focuses on inclusive education, with a special interest in special needs students, giftedness, and language education.
Karien M. Coppens, PhD, is a researcher and project manager at Maastricht University. Her research focuses on preschool education, inclusive education, data use in education, and the collaboration between policy, practice, and research.
Inge de Wolf, PhD, is coordinating inspector ‘State of Education’ and system-level supervision at the Dutch Inspectorate of Education and professor of Education Systems at Maastricht University. Her research focuses on education systems, evaluation methods, school quality, school careers, teacher quality, value-added measures, and accountability systems.
Notes
1 Regional partnerships are associations in which schools work together to provide education to all children within their region. Regional partnerships have a ‘duty of care’, the duty to make sure that every child is offered ‘appropriate education’ in one of the partnership schools. This can be either a mainstream school, a special school for mainstream education or a school for special education. Regional school partnerships have the freedom to divide the budget for extra support among partnership schools to fulfill their duty of care (Smits and Schoonheim Citation2016).
References
- Berling, L., J. Lubberman, and H. Witteman-van Leenen. 2016. Onderzoek naar de groei van vrijstellingen ‘5 onder a’ [Research into the growth of ‘5 under a’ exemptions for schooling]. Amsterdam: Regioplan.
- Chong, S. N. Y., and H. M. Cheah. 2010. “Demographic Trends: Impacts on Schools.” New Horizons in Education 58: 1–15.
- De Boer, A. A., and A. J. Van der Worp. 2016. De impact van passend onderwijs op het SO/SBO en het VSO [The Impact of Inclusive Education Special Primary and Secondary Education and Special Schools for Primary Education.]. Groningen: Rijksuniversiteit Groningen.
- Elster, J. 1992. Local Justice: How Institutions Allocate Scarce Goods and Necessary Burdens. New York: Russel Sage Foundation.
- European Agency for Development in Special Needs and Inclusive Education. 2016. Financing of Inclusive Education: Background Information Report. Odense: European Agency for Development in Special Needs and Inclusive Education.
- European Agency for Development in Special Needs Education. 2013. Organisation of Provision to Support Inclusive Education: Literature Review. Odense: European Agency for Development in Special Needs Education.
- Ferrier, F., M. Long, D. Moore, C. Sharpley, and J. Sigafoos. 2007. Investigating the Feasibility of Portable Funding for Students with Disabilities. Melbourne: Monash University.
- Fletcher-Campbell, F., S. J. Pijl, C. Meijer, A. Dyson, and T. Parrish. 2003. “Distribution of Funds for Special Needs Education.” International Journal of Educational Management 17: 220–233. doi:10.1108/09513540310484940.
- Florian, L., and M. J. McLaughlin. 2008. Disability Classification in Education: Issues and Perspectives. Thousand Oaks, CA: Corwin Press.
- Graham, L. J., and N. Sweller. 2011. “The Inclusion Lottery: Who’s in and Who’s out? Tracking Inclusion and Exclusion in New South Wales Government Schools.” International Journal of Inclusive Education 15: 941–953. doi:10.1080/13603110903470046.
- Greene, J. P., and G. Forster. 2002. Effects of Funding Incentives on Special Education Enrollment. Civic Report. New York: Manhattan Institute for Policy Research.
- Haartsen, T., and V. Venhorst. 2010. “Planning for Decline: Anticipation on Population Decline in the Netherlands.” Tijdschrift Voor Economische en Sociale Geografie 101: 218–227. doi: 10.1111/j.1467-9663.2010.00597.x
- Hover, C. 2010. Literatuuronderzoek verevening voor expertmeeting ECPO: Een eerste bouwsteen voor het advies over verevening van de ECPO [Literature Review Equalization for Expert Meeting ECPO: A First Element for the ECPO Equalization Advice]. The Hague: Smets & Hover.
- Inspectorate of Education. 2012. Krimpbestendige onderwijskwaliteit. Regio-onderzoek in Zuid-Nederland naar de gevolgen van krimp [Educational Quality Resistant to Population Decline. Regional Study in South-Netherlands to the Effects of Population Decline]. Utrecht: Inspectorate of Education.
- Jepma, I. J., and S. Beekhoven. 2015. Richting en inrichting van Passend onderwijs in samenwerkingsverbanden. Deelonderzoek A: Stand van zaken samenwerkingsverbanden Passend onderwijs primair onderwijs en voortgezet onderwijs [Trends and set-up of Inclusive education in regional partnerships. Substudy A: State of affairs regional partnerships Inclusive education primary education and secondary education]. Utrecht: Sardes.
- Koopman, P., and G. Ledoux. 2013. Kengetallen passend onderwijs [Key figures inclusive education]. Amsterdam: SCO.
- Lambrechts, E. D. C. M., I. A. van Berckelaer-Onnes, J. Gispen, J. L. Peschar, J. C. van der Wolf, R. Gonggrijp, and C. M. van Rijswijk. 2010. Verevening als verdeelmodel bij de bekostiging van speciale onderwijszorg [Equalization as Model for Funding of Special Education]. The Hague: ECPO.
- Levačić, R., and P. Downes. 2004. Formula Funding of Schools, Decentralization and Corruption: a Comparative Analysis. Paris: International Institute for Educational Planning.
- Meijer, C. J. W. 1999. Financing of Special Needs Education. A Seventeen-country Study of the Relationship Between Financing of Special Needs Education and Inclusion. Middelfart: European Agency for Development in Special Needs Education.
- Ministry of Education, Culture and Science. 2007. Key Figures, 2003-2007. The Hague: Ministry of Education, Culture and Science.
- Minne, B., D. Webbink, and H. Van der Wiel. 2009. Zorg om zorgleerlingen: Een blik op beleid, aantal en kosten van jonge zorgleerlingen [Concerns about Special Needs Students: A View on Policy, Numbers, and Costs of Young Special Needs Students]. The Hague: CPB Netherlands Bureau for Economic Policy Analysis.
- National Council for Special Education. 2014. Delivery for Students with Special Educational Needs. A Better and More Equitable Way. A Proposed New Model for Allocating Teaching Resources for Students with Special Education Needs. An NCSE Working Group Report. Trim: National Council for Special Education
- OECD. 2012. CX3.1 Special Education Needs (SEN). Accessed January 30, 2017. http://www.oecd.org/social/family/50325299.pdf.
- OECD. 2015. Education Policy Outlook 2015: Making Reforms Happen. Paris: OECD. doi:10.1787/9789264225442-en.
- Parrish, T. 2002. “Fiscal Policies in Support of Inclusive Education.” In Whole-school Success and Inclusive Education: Building Partnerships for Learning, Achievement and Accountability, edited by W. Sailor, 213–227. New York: Teachers College Press.
- Parrish, T., J. Harr, J. Anthony, A. Merickel, and P. Esra. 2003. State Special Education Finance Systems, 1999-2000. Part II Special Education Revenues and Expenditures. Palo Alto, CA: Center for Special Education Finance.
- Pijl, S. J. 2014. “How Special Needs Funding can Support Inclusive Education.” In The SAGE Handbook of Special Education. 2nd ed. Vol. 1, 251–261, edited by L. Florian. Los Angeles: Sage.
- Pijl, S. J. 2016. “Fighting Segregation in Special Needs Education in the Netherlands: The Effects of Different Funding Models.” Studies in the Cultural Politics of Education 37: 553–562. doi: 10.1080/01596306.2015.1073020
- Roelfsema, M. T., R. A. Hoekstra, C. Allison, S. Wheelwright, C. Brayne, F. E. Matthews, and S. Baron-Cohen. 2011. “Are Autism spectrum Conditions More Prevalent in an Information-technology Region? A School-based Study of Three Regions in the Netherlands.” Journal of Autism Developmental Disorders 42: 734–739. doi: 10.1007/s10803-011-1302-1
- Smeets, E. 2007. Speciaal of apart [Special or Separated]. Nijmegen: ITS.
- Smeets, E., G. Ledoux, H. Blok, C. Felix, A. Heurter, J. van Kuijk, and M. Vergeer. 2013. Op de drempel van Passend onderwijs. Beleid en aanbod rond specifieke onderwijs behoeften in zes samenwerkingsverbanden [At the doorstep of Inclusive education. Policy and possibilities Regarding Specific Educational Needs in Six Regional Partnerships]. Nijmegen: ITS/ Kohnstamm Instituut/Universiteit van Amsterdam.
- Smits, J., and J. Schoonheim. 2016. Violations of the Right to Inclusive Education. An Analysis of the Current Situation in the Netherlands. Amsterdam: In1School. http://www.in1school.nl/images/kennis-opinie/onderzoeken-in1school/Violations-Right-Inclusive-Education-DEF.pdf.
- Statistics Netherlands. 2012. Kerncijfers van de bevolkingsprognose, 2010-2060. [Key Figures of the Population Forecast, 2010–2016]
- Tierolf, B., and D. Oudenampsen. 2013. Kinderen met een handicap in Tel. Kerngegevens per provincie, gemeente en wijk [Children with a Physical Disability in Count. Data Per Province, Municipality, and District]. Utrecht: Verwey-Jonker Instituut.
- Van Bergen, K., M. Paulussen – Hoogeboom, A. Mack, H. Rossing, and Y. Van der Ploeg. 2016. Groepsgrootte in het voortgezet onderwijs [Group Size in Secondary Education]. Amsterdam: Regioplan.
- Van Leeuwen, B., A. Thijs, and M. Zandbergen. 2009. Inclusive Education in the Netherlands. Enschede: National Institute for Curriculum Development.