
ABSTRACT
The pathophysiology of most neurodegenerative diseases includes aberrant accumulation of protein aggregates. Recent evidence highlights the role of protein degradation pathways in neurodegeneration. Concurrently, genetic tools have been generated to enable zebrafish, Danio rerio, to be used as an animal model to study neurodegenerative processes. In addition to optical clarity and fast ex utero development, the zebrafish brain is relatively small and has conserved structures with its mammalian counterparts. To take advantage of this model organism and to aid further studies on autophagy and neurodegeneration, we created a stable transgenic zebrafish line that expresses eGFP-Map1lc3b specifically in post-mitotic neurons under the elavl3 promoter. This line is useful for indirectly monitoring autophagic activity in neurons in vivo and screening for macroautophagy/autophagy-modulating compounds. We determined the applicability of this transgenic line by modulating and quantifying the number of autophagosomes via treatment with a known autophagy inducer (rapamycin) and inhibitors (3-methyladenine, protease inhibitors). Additionally, we proposed an in vivo method for quantifying rates of autophagosome accumulation, which can be used to infer occurrence of autophagic flux. Last, we tested two FDA-approved drugs currently undergoing clinical studies for Parkinson disease, isradipine and nilotinib, and found that isradipine did not modulate autophagy, whereas nilotinib induced both autophagosome number and autophagic flux. It is hoped that others will find this line useful as an in vivo vertebrate model to find or validate autophagy modulators that might be used to halt the progression of neurodegenerative diseases.
Abbreviations
3MA: 3-methyladenine; BafA: bafilomycin A1; dd: dorsal diencephalon; dpf: days post fertilization; e: eye; eGFP: enhanced green fluorescent protein; Elavl3: ELAV like neuron-specific RNA binding protein 3; FDA: Food and Drug Administration; hb: habenula; hpt, hours post treatment; Map1lc3b: microtubule-associated protein 1 light chain 3 beta; nt: neural tube; ot, optic tectum; P/E: pepstatin A and E64d; PD: Parkinson disease; PMTs: photomultiplier tubes; PTU: 1-phenyl-2-thiourea; Ta: annealing temperature; Tel, telencephalon
Introduction
In adult animals, neurons are commonly post-mitotic and highly polarized with long axons extending from the cell bodies and terminating in synapses. The energetic demands and longevity of many types of neurons make them vulnerable to accumulation of toxic molecules and nutrient depletion, leading many to posit that neurons are particularly dependent on protein degradation pathway to maintain survival and function [Citation1–Citation3]. Macroautophagy (hereafter referred to as autophagy), a self-degradative process that delivers cytoplasmic cargo to the lysosome, is often associated with cells undergoing starvation or other forms of cellular stress. However, rather than just being a response to deleterious conditions, autophagy is a necessary part of cellular, and particularly neuronal, homeostasis. Indeed, autophagic machinery has been shown to help regulate the size and strength of synaptic connections [Citation4] and disruptions of autophagic function lead to neurodegeneration in mouse models [Citation5,Citation6]. Furthermore, studies have shown that genetic mutations in autophagy-lysosomal pathway related genes are correlated with the development of certain neurodegenerative diseases that exhibit accumulation of protein aggregates, including amyotrophic lateral sclerosis, and Parkinson (PD), Alzheimer, and Huntington diseases [Citation2,Citation7–Citation10]. Blocking autophagy has also been reported to prevent the degradation of SNCA [Citation11], the major component of Lewy bodies found in the post-mortem brains of PD patients. Thus, evidence suggests a link between defective protein degradation process and neurodegeneration.
Autophagy is characterized by the formation of double-membraned vesicular structures, known as autophagosomes, that can contain a variety of cytoplasmic cargo such as damaged organelles, cellular debris, unwanted macromolecules, and potentially toxic protein aggregates. Many of the molecules involved in nucleation, maturation, and fusion of autophagocytic vesicles to the lysosomes have been identified [Citation12]. Shortly after nucleation, MAP1LC3/LC3 (microtubule associated protein 1 light chain 3), in its unbound form (LC3-I), gets conjugated to the lipid phosphatidylethanolamine. The lipidated form of LC3 (LC3-II) then becomes incorporated into the membrane of the phagophore and remains associated with the autophagosome outer membrane until it is released from the outer surface by deconjugation; the LC3-II present inside the autophagosome is degraded and recycled along with other autophagic contents by lysosomal enzymes upon fusion of the autophagosome with the lysosome [Citation13,Citation14]. Thus, the incorporation of LC3-II into phagophores can be used to indirectly monitor autophagic flux. It is important to point out that an increase in autophagosomes by itself does not necessarily indicate an increase in flux. Measuring autophagic flux also requires the use of autophagy inhibitors.
The creation of green fluorescent protein (GFP)-tagged versions of LC3 (GFP-LC3) has allowed monitoring of autophagosome formation in living cells [Citation15–Citation17]. Additionally, this has opened the door to analyzing autophagic flux in intact, living organisms such as zebrafish embryos, which have distinct advantages over other model organisms when analyzing complex and dynamic biological processes. Chiefly among these are their rapid development, optical clarity, genetic tractability, and the promise of high throughput screening. Indeed, He and colleagues have previously established a stable transgenic zebrafish line expressing eGFP fused to Map1lc3b (eGFP-Map1lc3b), map1lc3b is the zebrafish homolog of human MAP1LC3B, under the constitutive promoter, cmv, that many labs have successfully used to study autophagic function in zebrafish larvae [Citation18]. In addition to the advantages described above, the zebrafish brain is relatively small and has many conserved structures with the mammalian brain [Citation19].
The basal level of autophagic activity is organ and tissue dependent [Citation15]. As reviewed by Mizushima, regulation of autophagic activity in neurons appears to be different from the rest of the body [Citation20]. Thus, to identify compounds that can modulate autophagic activity in neurons, we created a novel stable transgenic zebrafish line that expresses eGFP-Map1lc3b under the elavl3/huc promoter. Elavl3 is expressed in most neurons and its promoter is well suited to drive neuronal expression [Citation21,Citation22]. With this transgenic line, we showed that we could consistently quantify the number of autophagosomes, as well as measure the rate of autophagosome accumulation, in neurons. Together, they can infer the occurrence of autophagic flux, in vivo. After confirming that we could modulate autophagic activity via treatment with a known inducer and inhibitors of autophagy, we tested two FDA-approved drugs currently undergoing clinical trials for treatment of PD, isradipine and nilotinib. We demonstrated that isradipine did not modulate autophagic activity while nilotinib increased both autophagosome number as well as autophagic flux. Furthermore, this transgenic line should prove useful as an in vivo vertebrate model to validate novel autophagy-modulating compounds that have been identified from previous studies [Citation23–Citation26]. Due to the zebrafish ex utero development and the optical clarity of the tissues, compounds to be tested can be directly added to the media and their roles in autophagy modulation can be quickly assessed. Thus, we described an exciting new in vivo model to study autophagic activity in neurons that can also be used as an effective screening tool for potential therapeutic compounds.
Results
Elavl3-eGFP-Map1lc3b was expressed broadly in the central nervous system
Elavl3, an mRNA binding protein, is expressed in nearly all post-mitotic or newly differentiated neurons and is detected early in zebrafish embryos in the neural tube and parts of the brain as the somites are forming [Citation21,Citation22]. The expression of eGFP in our stable elavl3:eGFP:map1lc3b transgenic animals largely recapitulated that of elavl3 transcript expression ( and [Citation27]). At 1 day post fertilization (dpf), eGFP-Map1lc3b was enriched in neurons of the neural tube as well as in the dorsal diencephalon and the developing telencephalon with more diffuse expression in other regions of the developing brain (,a’)). By 2 and 3 dpf, eGFP-Map1lc3b was more prevalent throughout the central nervous system and was especially noticeable in the habenula and the optic tectum (,b’,c,c’)), a region of the mid-brain containing several types of neurons and glia that functions as the main visual processing center in teleosts [Citation28]. The expression of eGFP-Map1lc3b in the central nervous system persisted through at least 5 dpf ().
Figure 1. eGFP-Map1lc3b in Tg(elavl3:eGFP:map1lc3b)la50016± is expressed throughout the nervous system. (a-e) Dorsal views of representative confocal images of Tg(elavl3:eGFP:map1lc3b)la50016± embryos/larvae at indicated developmental stages. Some autofluorescence from the skin is visible in (c-e). Scale bars: 100 μm. (a’-e’) Lateral views of representative reconstructed confocal tile-scan images of Tg(elavl3:eGFP:map1lc3b)la50016± embryos/larvae at the indicated developmental stages. Dotted lines outline the indicated structures. dd, dorsal diencephalon; e, eye; hb, habenula; nt, neural tube; ot, optic tectum; tel, telencephalon. Scale bars: 500 μm.
Autophagosomes were detectable and inducible in mid-brain neurons
We chose the optic tectum region of the zebrafish larvae to quantify autophagosome numbers due to the characteristics which make this structure amenable to high resolution imaging via confocal microscopy: easily distinguishable, its size, its dorsal placement, and the abundant expression of Elavl3-eGFP-Map1lc3b in this region from 2 dpf to 5 dpf (), the developmental time window after Map1lc3b-II was detected in zebrafish [Citation18]. We observed distinct eGFP-positive puncta consistent with those that were previously characterized as autophagosomes in zebrafish [Citation18] in our transgenic animals beginning at 3 dpf ()).
Figure 2. eGFP-Map1lc3b puncta are induced by rapamycin and P/E, and inhibited by 3-methyladenine treatment. (a) Representative maximum confocal projections of the optic tectum regions of 3-dpf larvae that underwent indicated treatment for 24 h. Arrowheads indicate examples of puncta. (b) Quantification of the numbers of eGFP-Map1lc3b-positive puncta in the optic tectum of 3-dpf larvae that underwent the indicated treatment for 24 h; mean ± s.e.m. shown; n ≥ 13 for each group. Results from BafA-treated groups are reported in Fig. S2.
Next, we assessed the induction of autophagosomes in neurons by treating 2 dpf zebrafish larvae with several small molecules that induce or inhibit different stages of autophagic machinery for 24 h. At 3 dpf, control larvae had an average of 190.2 ± 9.9 (average ± s.e.m., n = 27) eGFP-Map1lc3b-positive puncta per 3 z-sections of optic tectum (see Materials and Methods). This result showed that autophagosome number can be quantified from our transgenic animals and suggested that an active basal level of autophagy occur normally in these neurons. Similar to what others have demonstrated, treatment with the MTOR inhibitor rapamycin, a potent inducer of autophagy [Citation29], increased the number of autophagosomes in the zebrafish optic tectum by 44% (273.8 ± 21.8, n = 23, p value = 0.0127, )). Likewise, co-treatment with inhibitors of lysosomal proteases, pepstatin A and E64d (P/E), which prevent degradation of autophagic cargo inside autolysosomes including eGFP-Map1lc3b, increased the number of autophagosomes by greater than 70% compared to control larvae (324.1 ± 23.0, n = 27, p value < 0.0001, ), S1).
An increase in the number of autophagosomes could have resulted from an increase in autophagosome formation, or a decrease in autophagosome degradation. Consequently, to differentiate a potential autophagy modulating compound as an inducer or inhibitor of autophagic activity, a co-treatment assay with P/E is often used [Citation30]. When combined with a saturating dose of P/E (Figure S1), a compound that induces autophagic activity will cause a synergistic increase in autophagosome numbers compared to those treated with P/E alone, while a compound that inhibits autophagic activity should not. To determine if our transgenic line is capable of recapitulating this assay, we co-treated our Elavl3-eGFP-Map1lc3b-overexpressing embryos with rapamycin and P/E. As expected, this led to a synergistic increase in the number of autophagosomes. We saw 127% and 33% significant increases in autophagosome number relative to control and P/E alone, respectively (432.9 ± 26.4, n = 19, p values < 0.0001, )).
We next tested other known inhibitors of autophagic degradative machinery; namely, 3-methyladenine (3MA) and bafilomycin A1 (BafA). In our transgenic animals, 3MA treatment significantly reduced the average number of autophagosomes by 55% compared to controls (84.6 ± 7.4, n = 21, p value = 0.0007, )). Simultaneous treatment with 3MA, rapamycin, and P/E resulted in no difference in the number of autophagosomes compared to control larvae (143.9 ± 12.7, n = 13, p value = 0.6771, )). Because 3MA inhibits autophagosome formation by blocking phosphatidylinositol 3-kinase activity [Citation31], which is involved in the early step of autophagosome formation [Citation32], these findings provided additional evidence that increased puncta observed via rapamycin and/or P/E treatment are indeed autophagosomes that are parts of the autophagy-lysosomal pathway. When we treated Elavl3-eGFP-Map1lc3b transgenic embryos with different concentration of BafA, a vacuolar type H+-ATPase (V-ATPase) inhibitor that neutralizes lysosomal pH and inhibits autophagosome-lysosome fusion [Citation33], we found that eGFP-Map1lc3b puncta accumulated very rapidly in a dose-dependent manner with a saturating dose of 100 nM (Figure S2).
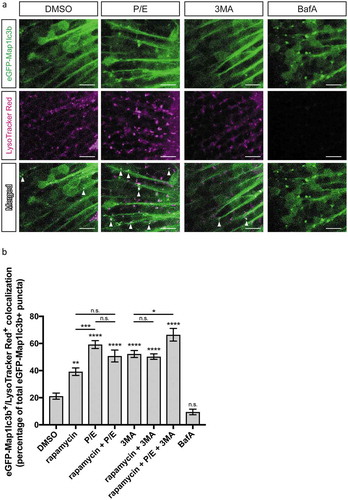
Changes in colocalization of autophagosomes and lysosomes can be used to estimate autophagic flux [Citation18], we therefore stained 3-dpf treated Elavl3-eGFP-Map1lc3b-overexpressing larvae with LysoTracker Red, which labels acidic organelles such as lysosomes. Accordingly, autolysosomes correspond to puncta that are positive for both eGFP and LysoTracker Red ()). Under basal condition (DMSO treated), we found that 21.2 ± 2.2% of eGFP-Map1lc3b-positive puncta were identified as autolysosomes (n = 50, )). Treatment with rapamycin increases the percentage of autolysosomes to 39.2 ± 2.8% (n = 50, p value = 0.0018, )). In larvae treated with a saturating dose of P/E (Figure S1), 59.2 ± 2.9% of eGFP-Map1lc3b-positive puncta were autolysosomes (n = 60, p value < 0.0001, )). Together, these observations further suggested that basal autophagic activity is high in these neurons. Conversely, 3MA treatment yielded 52.3 ± 2.6% of eGFP-Map1lc3b-positive puncta as autolysosomes (n = 60, p value < 0.0001, )). This was unexpected considering that formation of new autophagosomes was mostly inhibited ()) and we were expecting most of the remaining autophagosomes to have fused with the lysosomes. Last, 9.5 ± 2.0% of BafA-treated larvae, which should not label efficiently with LysoTracker Red due to neutralization of lysosomal pH, were detected as autolysosomes (n = 40, p value = 0.2177, )).
Figure 3. Colocalization of autophagosomes and lysosomes. (a) Representative confocal z-sections of the optic tectum regions of 3-dpf larvae that underwent the indicated treatment for 24 h followed by 1 h of LysoTracker Red staining. Arrowheads indicate examples of puncta that are double positive for both eGFP-Map1lc3b and LysoTracker Red, i.e. autolysosomes. Scale bars: 10 μm. (b) Percentage of eGFP-Map1lc3-positive puncta that colocalize with LysoTracker Red-positive puncta; mean ± s.e.m. shown; n ≥ 40 for each group. ****p < 0.0001, ***p < 0.001, **p < 0.01, *p < 0.05, p > 0.05 (n.s.), one-way ANOVA with Tukey’s multiple comparison analysis (GraphPad Prism) .
Rates of neuronal autophagosome accumulation were quantified in vivo
In addition to being useful for elucidating whether a particular compound has the ability to induce or inhibit autophagic activity, comparing the numbers of autophagosomes between samples co-treated with the compound and P/E and samples treated with P/E alone can also be used to infer the occurrence of autophagic flux [Citation30]. However, not every compound can be co-treated with P/E. For example, we found that the combined treatment with nilotinib and P/E was too toxic. Thus, as an additional method to assess autophagic flux, we determined the rates of autophagosome accumulation by utilizing BafA to inhibit autophagosome-lysosome fusion. In this assay, BafA requires a very short treatment window (see Materials and Methods) and thus reduces overall toxicity. Comparing the rates between controls and treated groups allowed us to observed how much degradative activity was occurring over a period of time, as well as determine if autophagic flux was altered.
In our hands, approximately 1000 puncta per 3 sections of the optic tectum is the limit that can be accurately quantified. In order to avoid assay saturation, we used data from our BafA dosage analysis (Figure S2) to determine that 50 nM induces an appropriate number of puncta for this rate assay (651.6 ± 48.0, n = 5). We used this assay to determine rates of autophagosome accumulation resulting from treatment with DMSO (control), rapamycin, and 3MA. Our results showed that a basal autophagic flux was approximately 5.7 ± 0.6 autophagosomes per minute (n = 22) and that treatment with rapamycin increased this rate by greater than 50% to approximately 8.7 ± 0.7 autophagosomes per minute (n = 12, p value = 0.0044, ). To our surprise, we discovered that we were not able to detect decrease in the rate of autophagosome accumulation with 3MA treatment (6.1 ± 0.6 autophagosomes per minute, n = 12, p value = 0.8452, ). It is possible that we were able to detect changes in autophagosome accumulation due to a non-canonical, Becn1/Beclin 1-independent form of autophagy that is unaffected by 3MA treatment [Citation34]. Alternatively, the number of autophagosomes observed in 3MA-treated larvae ()) suggested that the dosage of 3MA used either allowed for some baseline autophagic activity or allowed the autophagic activity to recover during the 24-h period.
Figure 4. Rate of eGFP-Map1lc3b-positive puncta accumulation is higher in rapamycin-treated samples. Rates of eGFP-Map1lc3b-positive puncta accumulation in the optic tectum of 3-dpf larvae that underwent indicated treatment for 24 h over 60 min were obtained via addition of BafA under the indicated drug treatment (see Materials and Methods). Mean ± s.e.m. shown; n ≥ 12 for each group. **p < 0.01, p > 0.05 (n.s.), one-way ANOVA with Dunnett’s multiple comparison analysis (GraphPad Prism) .
Isradipine treatment did not affect autophagic machinery
Development of PD symptoms is linked to accumulation of SNCA/α-synuclein protein in insoluble inclusions called Lewy bodies [Citation35–Citation37]. These potentially toxic, aggregated form of SNCA protein are degraded via autophagic machinery in neurons [Citation11], and enhancing autophagic function is generally considered to be neuroprotective [Citation38]. Isradipine, an FDA-approved centrally-acting L-type calcium channel blocker, is currently under phase III clinical trials for the treatment of PD [Citation39]. The neuroprotective effect of isradipine is proposed to have resulted from ‘rejuvenation’ of neurons via modulation of their pace-making mechanisms [Citation40]. Although the findings remain unpublished, it has also been suggested that the neuroprotective effect of isradipine resulted from increased autophagy, but they never measured autophagic flux [Citation41]. Furthermore, other calcium channel blockers have been reported to induce autophagy [Citation18,Citation42].
To determine if isradipine could alter autophagic activity, we quantified autophagosome numbers and autophagic flux in the optic tectum of Elavl3-eGFP-Map1lc3b transgenic larvae treated with isradipine. We found that isradipine treatment did not significantly alter the number of autophagosomes (189.2 ± 13.2, n = 22) compared to control larvae (210.1 ± 11.8, n = 18) (p value = 0.8628, )). Additionally, co-treatment of isradipine and P/E did not lead to synergistic increase in the number of autophagosomes (305.1 ± 24.3, n = 12) compared to the P/E-treated group (361.4 ± 29.4, n = 18) (p value = 0.2823, )). Results from our rate experiment after BafA treatment also indicated that isradipine treatment did not alter autophagic flux (DMSO: 5.3 ± 0.6, n = 11; isradipine: 4.0 ± 0.7, n = 12; p value = 0.7192, )). To further confirm this finding, we looked at LC3-II:LC3-I ratios in SK-N-MC neuroblastoma cell culture, which we showed does express Cav1.2, a subunit of L-type calcium channel (Figure S3A). Our Western blot analysis demonstrated that isradipine treatment did not alter LC3-II levels (Figure S3B), nor did it alter LC3-II:LC3-I ratios (Figure S3C). Together, these data suggest that isradipine does not alter autophagic activity in neurons.
Figure 5. Isradipine does not induce autophagosome formation nor alter autophagic flux. (a) Representative maximum confocal projections of the optic tectum regions of 3-dpf larvae that underwent indicated treatment for 24 h. Scale bars: 10 μm. (b) Quantification of the numbers of eGFP-Map1lc3b-positive puncta in the optic tectum of 3-dpf larvae that underwent indicated treatment for 24 h; mean ± s.e.m. shown; n ≥ 12 for each group. ****p < 0.0001, *p < 0.05, p > 0.05 (n.s.), one-way ANOVA with Tukey’s multiple comparison analysis (GraphPad Prism). (c) Quantification of rate of eGFP-Map1lc3b-positive puncta accumulation in the optic tectum of 3-dpf larvae that underwent indicated treatment for 24 h over 60 min; mean ± s.e.m. shown; n ≥ 11 for each group. p > 0.05 (n.s.), two-tailed unpaired t test (GraphPad Prism) .
Nilotinib induced autophagosome formation and increased autophagic flux
Nilotinib is a tyrosine kinase inhibitor shown to upregulate autophagy in hepatocellular carcinoma and hepatic stellate cell lines [Citation43,Citation44]. In PD animal models, nilotinib reduces SNCA levels through upregulation of autophagy [Citation45] and protects against MPTP-induced dopaminergic neuron loss [Citation46]. This drug is approved by the FDA for treatment of chronic myeloid leukemia and is currently undergoing phase II clinical trial studies for treatment of PD (NCT03205488).
To determine if nilotinib increases autophagic activity in our transgenic larvae, we quantified autophagosome numbers and rate of autophagosome accumulation in the optic tectum of Elavl3-eGFP-Map1lc3b-expressing larvae treated with nilotinib. Consistent with previous findings, we found that nilotinib treatment did significantly increase the number of autophagosomes (358.4 ± 26.6, n = 15) compared to control larvae (170.9 ± 15.2, n = 15) (p value = 0.0463, )). As previously mentioned, we found that co-treatment of nilotinib and P/E was too toxic. After 24 h of co-treatment, zebrafish larvae exhibited opaque heads indicative of cell death and reduced fluorescence intensity (data not shown). From this assay, we were not able to conclude whether the observed increase in autophagosome number was due to inhibition or induction of autophagy. However, results from our rate experiment after co-treatment with BafA did indicate that unlike isradipine, nilotinib treatment increases autophagic flux (DMSO: 3.9 ± 0.6, n = 10; nilotinib: 6.8 ± 1.2, n = 10; p value = 0.0336, )). Together, our data further support the role of nilotinib in increasing autophagic activity and autophagic flux.
Figure 6. Nilotinib induces autophagosome formation and increases autophagic flux. (a) Representative maximum confocal projections of the optic tectum regions of 3-dpf larvae that underwent indicated treatment for 24 h. Scale bars: 10 μm. (b) Quantification of the numbers of eGFP-Map1lc3b-positive puncta in the optic tectum of 3-dpf larvae that underwent indicated treatment for 24 h; mean ± s.e.m. shown; n = 15 for each group. ****p < 0.0001, two-tailed unpaired t test (GraphPad Prism). (c) Quantification of rate of eGFP-Map1lc3b-positive puncta accumulation in the optic tectum of 3-dpf larvae that underwent indicated treatment for 24 h over 60 min; mean ± s.e.m. shown; n = 10 for each group. *p < 0.05, two-tailed unpaired t test (GraphPad Prism).
Discussion
Many studies demonstrating the connection between dysregulation of autophagy and neurodegenerative diseases have emerged in recent years [Citation2,Citation47]. Interest in this topic necessitates the generation of new tools that will enable researchers to more quickly assess autophagic activity in neurons in vivo. As an animal model, zebrafish has many advantages over their vertebrate model counterparts. Chiefly amongst them are their transparent embryos that enable in vivo microscopy, ease of genetic manipulation, and the amenability to aqueous administration of compounds. Furthermore, zebrafish has been shown to be useful for studying many neurodegenerative diseases [Citation48–Citation53] and autophagy [Citation54–Citation56]. Indeed, several recent studies have demonstrated that upregulation of autophagy is protective in zebrafish models of neurodegeneration [Citation57,Citation58].
A previous study has generated a transgenic zebrafish model that overexpresses eGFP-Map1lc3b ubiquitously [Citation18]. However, the level of basal autophagy, rate of autophagic induction, as well as the bioavailability of pharmacological agents are likely tissue-specific [Citation20]. In fact, Swart et. al. reported a variation of autophagic markers in different regions of the mouse brain, suggesting that the level of autophagic activity is also region specific [Citation59]. Thus, in order to better understand the involvement of autophagy in basic biology and diseases in neurons, we created the first transgenic zebrafish model that overexpresses eGFP-Map1lc3b specifically in neurons. We validated the usefulness of our line using known autophagy-modulating compounds, confirmed that these eGFP-Map1lc3b-positive puncta represent primarily autophagosomes, determined autophagic activity of isradipine and nilotinib, as well as proposed a complementary method that can be used to infer the occurrence of autophagic flux.
An increase in autophagosome number could be due to increased autophagic activity or inhibited degradation. Thus, it is important to determine the state of autophagic flux. By taking advantage of the pH sensitivity of GFP, one powerful method utilized the tandem mRFP-GFP-tagged LC3 to assess autophagic flux [Citation60]. While useful for mosaic overexpression, it would be difficult to interpret data resulting from a stable transgenic line with a similar design. With continuous expression of mRFP and GFP, discerning between newly made GFP from GFP that have not been degraded could be problematic.
Another strategy commonly used to determine autophagic flux compares the number of autophagosomes with and without autophagy inhibitors [Citation30]. In this study, we also found that strategy to be useful. However, it was not compatible with every compound. Thus, we proposed and validated a method that allowed us to determine the rate of autophagosome accumulation in vivo after blocking fusion with the lysosome, which can be used as a complementary assay to infer the occurrence of autophagic flux. The inability to detect decrease in the rate of autophagosome accumulation with 3MA treatment brought to light a limitation of this assay. Although useful for identifying inducers of autophagy, this method may not be sensitive enough to identify inhibitors of autophagy. Instead of just comparing the rates of autophagosome accumulation between a potential inhibitor and the control, it may be necessary to compare the rates between a potential inhibitor co-treated with a known inducer and the known inducer alone. Nonetheless, the combination of assays (i.e. autophagosome number and rate of autophagosome accumulation) should be sufficient to differentiate an autophagy-inducing from autophagy-inhibiting compound.
Although laborious, we found that manual counting was the most accurate way to quantify the number of autophagosomes. Results from the co-labeling of eGFP-Map1lc3b and LysoTracker Red experiments indicated that the analysis software may have yielded puncta that were falsely positively, as well as falsely negatively, labeling as autophagosomes and autolysosomes. Due to neutralization of lysosomal pH, BafA-treated larvae should not have been identified as autolysosomes. At the dosage and duration used, the presence of autolysosomes could have resulted from incomplete neutralization of pH by BafA. Conversely, larvae treated with P/E or 3MA should have demonstrated higher percentage of autolysosomes due to mostly inhibited proteolytic degradation within autolysosomes or reduced formation of new autophagosomes, respectively. It is very likely that higher percentages of autolysosomes were not observed due to formation of new autophagosomes that resulted from recovery after washout of treatment, which is unavoidable after LysoTracker Red staining has been performed. Nonetheless, these baselines maybe acceptable for comparative studies that do not require precise numbers.
In this study, we determined the number of autophagosomes per optic tectum because of the characteristics discussed. However, with higher resolution imaging, we can foresee this line be used to determine the number of autophagosomes in individual neurons as well. Since we found manual counting of puncta to be most accurate, looking at a smaller neuron population would also be less labor intensive. We also believe that this line would be useful in determining if or how aggregate-prone protein such as SNCA and MAPT/tau are regulated by autophagic machinery or vice versa. As more evidence points to increasing autophagy-lysosomal pathway in providing neuroprotection, we hope that our in vivo vertebrate model will facilitate researchers in their search for autophagy modulating compounds that will halt or stop the progression of neurodegenerative diseases.
Materials and methods
Zebrafish care and maintenance
Zebrafish (Danio rerio) were raised at 28.5°C on a 14 h light-10 h dark cycle. Embryos and larvae were obtained from natural mating and staged according to days post fertilization (dpf). The following lines were used: AB (wild-type), Tg(elavl3:eGFP:map1lc3b)la50016 (this study). All experiments using zebrafish were approved by the University of California, Los Angeles (UCLA) Chancellor’s Animal Research Committee.
Generation of tg(elavl3:eGFP:map1lc3b)la50016 transgenic animals
One-cell staged AB strain zebrafish embryos were injected with 25 pg of pDestTol2pA2(elavl3:eGFP:map1lc3b) plasmid (a gift from the Alvaro Sagasti laboratory, UCLA) along with 25 pg of tol2 transposase mRNA [Citation61]. Adults F0 were screened for germline transmission. F1 embryos expressing eGFP fused to the N-terminal of Map1lc3b protein (eGFP-Map1lc3b) governed by the upstream regulator sequences from elavl3 were raised to adulthood. In total, we identified 3 different alleles for this transgene. The la50016 allele was selected for further propagation based on expression level and pattern. The Tg(elavl3:eGFP:map1lc3b)la50016 adults used in this study have been outcrossed for at least 3 generations and showed no developmental or adulthood abnormalities (data not shown).
Drug treatment of zebrafish larvae
Unless otherwise indicated, manually dechorionated 2 dpf Tg(elavl3:eGFP:map1lc3b)la50016± embryos were incubated with 1 µM rapamycin (Sigma-Aldrich, R8781), P/E: 10 µg/mL pepstatin A (Sigma-Aldrich, P5318) and 5 µg/mL E64d (Enzo Life Sciences, BML-PI107-0005), 10 mM 3-methyladenine (3MA; Acros Organics, 379,791,000), 1 µM isradipine (Sigma-Aldrich, I6658), 10 µM nilotinib (Sigma-Aldrich, CDS023093), 10–200 nM bafilomycin A1 (BafA; Cayman Chemical Company, 11,038), or a combination of treatments as indicated, diluted in E3 buffer (5 mM NaCl, 0.17 mM KCl, 0.33 mM CaCl2, 0.33 mM MgSO4, 10−5% Methylene Blue) containing 0.003% 1-phenyl-2-thiourea (Acros Organics, 207,250,050) (1xPTU/E3) with a final DMSO concentration of 0.1% at 28.5°C for 24 h. Typically, less than 15 embryos were treated in each well of a 6-well plate (Corning, 3506) containing 5 mL of treatment solution. The control groups were treated with 0.1% DMSO diluted in 1xPTU/E3 at 28.5°C for 24 h.
Confocal microscopy and quantification of puncta
A single larva anesthetized with <0.01% tricaine methanesulfonate (TRICAINE-S; Western Chemical, MS-222) was mounted in 1% agarose into a 35/12-mm glass-bottom culture dish (Warner Instruments, 64–0757). Mounted larvae were kept at room temperature and in the tricaine methanesulfonate-containing treatment solution during the entire imaging process. An entire imaging experiment was typically completed within 1 h after mounting.
For overall dorsal and lateral views of eGFP-Map1lcb3-positive embryos/larvae (), z-stacks of the entire heads or bodies were acquired using a 488 nM excitation laser of the Leica SPE confocal microscope (Wertzlar, Germany) and a 20x dry objective (NA = 0.80). Tile-scan function was used to acquire z-stacks for lateral views. For dorsal views used for quantification of puncta, z-stacks of eGFP-Map1lcb3-positive optic tectum region were acquired using a 40x oil-immersion objective (NA = 1.15) and a 488 nM excitation laser line of the Leica SPE confocal microscope. Each z-stack was comprised of 13 1024 × 1024 pixels sections with a z-step size of 2 microns (i.e. 24 microns total per z-stack). Numbers of puncta were quantified from 3 sections from each z-stack. To prevent repeat counting of the same puncta, sections with 3 z-steps distances from each other, typically sections 4, 7, and 10, were selected for quantification. In rare cases that puncta could not be quantified from those sections due to spontaneous movement of the larva, adjacent sections were used instead. Fluorescence signals that were distinguishable from background occupying more than one pixel were considered puncta. The total number of puncta from cell bodies-containing regions of both hemispheres from all 3 sections was counted using Fiji software [Citation62] and analyzed with statistical test(s), as indicated.
Lysotracker staining and colocalization analysis
Larvae were incubated in the dark for 1 h with 10µM LysoTracker Red DND-99 (ThermoFisher Scientific, L7528) diluted in the treatment solution and then washed several times in 1xPTU/E3 for 30 min prior to mounting and imaging.
To determine colocalization of autophagosomes and lysosomes, eGFP-Map1lc3b and LysoTracker Red-positive puncta were acquired using a 63x oil-immersion objective (NA = 1.4) and 488 nM and 543 nM excitation laser lines of the Leica SP5 confocal microscope, respectively. Emission from both channels were captured simultaneously, using 2 PMTs. Leica analysis software (Wertzlar, Germany) was used to quantify puncta based on roundness and size, as well as identify eGFP-Map1lc3b-positive puncta that colocalize with LysoTracker Red-positive puncta.
Quantification of rates of autophagosome accumulation
Puncta accumulation was achieved by blocking autophagosome-lysosome fusion with the addition of BafA. Larvae (3 dpf) that have been treated with rapamycin, isradipine, nilotinib, 3MA, or DMSO (as control) for 24 h prior were separated into either non-BafA- or BafA-treated groups. For non-BafA-treated groups, 3-dpf larvae were mounted and imaged at 24 h post treatment (hpt). For the BafA-treated group, at 24 hpt, larvae were treated with BafA via direct addition into each well to reach a final concentration of 50 nM and an additional 0.01% DMSO. After 30 min of BafA treatment, all drugs were washed out twice with 1xPTU/E3; larvae were then mounted and imaged at 25 hpt. Typically, an entire imaging experiment of either group was completed within 30 min after larvae have been mounted in agarose.
The average numbers of puncta from the non-BafA-treated groups were used as baselines to determine the changes in number of autophagosomes from BafA-treated groups. Rates of autophagosome accumulation were calculated by subtracting the averages of autophagosome numbers of non-BafA-treated groups from the numbers of autophagosomes from each sample of BafA-treated groups divided by 60 min, which was the approximate amount of time that elapsed between the imaging of each larvae between non-BafA- and BafA-treated groups.
Cell culture, drug treatment, and protein extraction
The human neuroblastoma cell lines SK-N-MC and SH-SY5Y were purchased from ATCC (American Type Culture Collection, HTB-10 and CRL-2266 respectively) and grown at 37°C and in 5% CO2 in DMEM with 10% FBS and supplemented with penicillin (50 I.U./mL) and streptomycin (50 μg/mL; Gibco/ThermoFisher, 15,140–122). SK-N-MC cells were adhered in 6-well plates to approximately 85% confluency prior to drug treatment. All indicated drug treatments were done in a final volume of 5 mL and incubated with DMSO vehicle at concentrations equivalent to the treatment wells (0.1%). After 24 h of drug treatment, cells were briefly rinsed in PBS before direct lysis in 1xRIPA + protease inhibitors (80–100 μL/sample). Samples were sonicated briefly on ice before centrifugation at 11,000 x g for 15 min at 4°C. Supernatants were transferred to a clean microfuge tube and protein concentrations were established via BCA assays.
Western blot
Between 25–50 μg of total protein was loaded onto a Bolt 12% Bis-Tris Plus gel with 1x loading dye and 2-mercaptoethanol (Sigma-Aldrich, M6250) in a final volume of 25 μL. Samples were heated at 95°C for 10 min prior to loading. Gel was run and transferred to nitrocellulose membrane using the XCell-II blotting system (Life Technologies). Membrane was blocked in 5% non-fat milk and probed with antibodies. Primary antibodies used in the study were: Rabbit anti-LC3B (1:1250; Novus Biologicals, NB100-2220); mouse anti-tubulin (1:10,000; Sigma-Aldrich, TP026). Secondary antibodies used in the study were: Biotinylated anti-rabbit (1:2500; Vector Laboratories, BA1000); HRP-goat anti-mouse (1:10,000; Invitrogen, 626,520). HRP Streptavidin (1:250; Vector Laboratories, SA5014) was used to detect biotinylated secondary antibody. Blots were developed in chemiluminescent substrate (Pierce ECL Plus; Thermo Scientific, 32,132) and exposed to film for band visualization. Quantification of bands was done using the gel analysis feature of ImageJ software [Citation63]. For LC3-II:LC3-I ratios, band intensities for both LC3-I (~17kD) and LC3-II (~15kD) were measured and displayed as a ratio.
Reverse transcriptase PCR assay
Total RNA was extracted from SK-N-MC or SH-SY5Y neuroblastoma cell culture using TRIzol reagent (Invitrogen, 15,596,026). First-strand cDNA was generated using 1 μg of total RNA with iScript Reverse Transcription Supermix (Bio-Rad, 1,708,841) or SuperScript III reverse transcriptase (Invitrogen, 18,080,400) according to the manufacturers’ protocols. PCR was performed using 2 μL of cDNA from the reverse transcription reaction diluted 1:5 with 35 rounds of amplification at the indicated annealing temperature (Ta) and extension time of 45 s. The following primers were used for Tbp (TATA box binding protein): 5ʹ-TGCACAGGAGCCAAGAGTGAA-3ʹ and 5ʹ-CACATCACAGCTCCCCACCA-3ʹ, Ta = 60°C [Citation64]; Cav1.2: 5ʹ-CTGCAGGTGATGATGAGGTC-3ʹ, 5ʹ-GCGGTGTTGTTGGCGTTGTT-3ʹ, Ta = 58°C [Citation65]; Cav1.3 (1) 5ʹ-GCTGCTGTGGAAGTCTCTGTCAAGC-3ʹ and 5ʹ-TCAGTGATTCCACCACACACCACGA-3ʹ, Ta = 68°C [Citation66]; Cav1.3 (2) 5ʹ-ACCCCCACCTGTAGGATCTCTCTCC-3ʹ and 5ʹ-TCCTGACACTAGTCGAAGTGGTCGC-3ʹ, Ta = 68°C [Citation66].
Statistical analysis
Statistical analysis was performed using Microsoft Excel or GraphPad Prism version 7.0d for Mac OS X software. Two-tailed, unpaired, Student’s t-tests were used to compare between 2 groups. One-way ANOVA analyses were used for comparisons among 3 or more groups followed by Tukey’s or Dunnett’s multiple comparisons tests, as indicated. GraphPad Prism software was used to generate the graphs shown.
Supplemental Material
Download MS Word (323.3 KB)Acknowledgements
We thank Kelly O’Donnell and Alvaro Sagasti (UCLA) for providing pDestTol2pA2(elavl3:eGFP:map1lcb3) plasmid; Mark Stahl for scientific input; and Sharon Li for fish care and maintenance. Confocal laser scanning microscopy for co-localization of autophagosome and lysosomes analysis was performed at the CNSI Advanced Light Microscopy/Spectroscopy Shared Resource Facility at UCLA.
Disclosure statement
No potential conflict of interest was reported by the authors.
Supplementary material
Supplemental data for this article can be accessed here.
Additional information
Funding
Related Research Data
References
- Lee J-A. Neuronal autophagy: a housekeeper or a fighter in neuronal cell survival? Exp Neurobiol. 2012;21(1):1–8.
- Jh S, Shim JH, Kim K-H, et al. Neuronal autophagy and neurodegenerative diseases. Exp Mol Med. 2012;44(2):89–98.
- Maday S. Mechanisms of neuronal homeostasis: autophagy in the axon. Brain Res. 2016 Oct;1649(Pt B):143–150.
- Shen W, Ganetzky B. Autophagy promotes synapse development in Drosophila. J Cell Biol. 2009 Oct;187(1):71–79.
- Hara T, Nakamura K, Matsui M, et al. Suppression of basal autophagy in neural cells causes neurodegenerative disease in mice. Nature. 2006 Apr;441(7095):885–889.
- Komatsu M, Waguri S, Chiba T, et al. Loss of autophagy in the central nervous system causes neurodegeneration in mice. Nature. 2006 Apr;441(7095):880–884.
- Boland B, Kumar A, Lee S, et al. Autophagy induction and autophagosome clearance in neurons: relationship to autophagic pathology in Alzheimer’s disease. J Neurosci. 2008 Jul;28(27):6926–6937.
- Lynch-Day MA, Mao K, Wang K, et al. The role of autophagy in parkinson’s disease. Cold Spring Harb Perspect Med. 2012 Apr;2(4):a009357–a009357.
- Martini-Stoica H, Xu Y, Ballabio A, et al. The autophagy-lysosomal pathway in neurodegeneration: a TFEB perspective. Trends Neurosci. 2016 Apr;39(4):221–234.
- Robak LA, Jansen IE, van Rooij J, et al. International Parkinson’s Disease Genomics Consortium (IPDGC), Heutink P, Shulman JM, IPDGC consortium members. Excessive burden of lysosomal storage disorder gene variants in Parkinson’s disease. Brain. 2017 Nov;140(12):3191–3203.
- Vogiatzi T, Xilouri M, Vekrellis K, et al. Wild type α-synuclein is degraded by chaperone-mediated autophagy and macroautophagy in neuronal cells. J Biol Chem. 2008;283(35):23542–23556.
- Mizushima N, Yoshimori T, Ohsumi Y. The role of atg proteins in autophagosome formation. Annu Rev Cell Dev Biol. 2011 Nov;27:107–132.
- Kabeya Y, Mizushima N, Ueno T, et al. LC3, a mammalian homologue of yeast Apg8p, is localized in autophagosome membranes after processing. Embo J. 2000;19(21):5720–5728.
- Yu L, Chen Y, Tooze SA. Autophagy pathway: cellular and molecular mechanisms. Autophagy. 2018;14(2):207–215.
- Mizushima N, Yamamoto A, Matsui M, et al. In vivo analysis of autophagy in response to nutrient starvation using transgenic mice expressing a fluorescent autophagosome marker. Mol Biol Cell. 2004 Mar;15(3):1101–1111.
- Rusten TE, Lindmo K, Juhász G, et al. Programmed autophagy in the drosophila fat body is induced by ecdysone through regulation of the PI3K pathway. Dev Cell. 2004 Aug;7(2):179–192.
- Scott RC, Schuldiner O, Neufeld TP. Role and regulation of starvation-induced autophagy in the drosophila fat body. Dev Cell. 2004 Aug;7(2):167–178.
- He C, Bartholomew CR, Zhou W, et al. Assaying autophagic activity in transgenic GFP-Lc3 and GFP-Gabarap zebrafish embryos. Autophagy. 2009 May;5(4):520–526.
- Kozol RA, Abrams AJ, James DM, et al. Function over form: modeling groups of inherited neurological conditions in zebrafish. Front Mol Neurosci. 2016;9:55.
- Mizushima N, Levine B, Cuervo AM, et al. Autophagy fights disease through cellular self-digestion. Nature. 2008 Feb;451(7182):1069–1075.
- Kim C-H, Ueshima E, Muraoka O, et al. Zebrafish elav/HuC homologue as a very early neuronal marker. Neurosci Lett. 1996;216(2):109–112.
- Park H-C, Kim C-H, Bae Y-K, et al. Analysis of upstream elements in the HuC promoter leads to the establishment of transgenic zebrafish with fluorescent neurons. Dev Biol. 2000 Nov;227(2):279–293.
- Zhang L, Yu J, Pan H, et al. Small molecule regulators of autophagy identified by an image-based high-throughput screen. Proc Nat Acad Sci. 2007;104(48):19023–19028.
- Sarkar S, Perlstein EO, Imarisio S, et al. Small molecules enhance autophagy and reduce toxicity in Huntington’s disease models. Nat Chem Biol. 2007 Jun;3(6):331–338.
- Balgi AD, Fonseca BD, Donohue E, et al. Screen for chemical modulators of autophagy reveals novel therapeutic inhibitors of mTORC1 signaling. PLoS ONE. 2009 Sep 22;4(9):e7124.
- Farkas T, Høyer-Hansen M, Jäättelä M. Identification of novel autophagy regulators by a luciferase-based assay for the kinetics of autophagic flux. Autophagy. 2009 Oct;5(7):1018–1025.
- Kudoh T. A gene expression screen in zebrafish embryogenesis. Genome Res. 2001 Dec;11(12):1979–1987.
- Ito Y, Tanaka H, Okamoto H, et al. Characterization of neural stem cells and their progeny in the adult zebrafish optic tectum. Dev Biol. 2010 Jun;342(1):26–38.
- Kamada Y, Funakoshi T, Shintani T, et al. Tor-mediated induction of autophagy via an Apg1 protein kinase complex. J Cell Biol. 2000 Sep 18;150(6):1507–1513.
- Klionsky DJ, Abdelmohsen K, Abe A, et al. Guidelines for the use and interpretation of assays for monitoring autophagy. Autophagy. 2016 Jan;12(1):1–222. 3rd edition.
- Wu Y-T, Tan H-L, Shui G, et al. Dual role of 3-methyladenine in modulation of autophagy via different temporal patterns of inhibition on class I and III phosphoinositide 3-kinase. J Biol Chem. 2010 Apr 2;285(4):10850–10861.
- Heras-Sandoval D, Pérez-Rojas JM, Hernández-Damián J, et al. The role of PI3K/AKT/mTOR pathway in the modulation of autophagy and the clearance of protein aggregates in neurodegeneration. Cell Signal. 2014 Dec 26;26(12):2694.
- Mauvezin C, Neufeld TP. Bafilomycin A1 disrupts autophagic flux by inhibiting both V-ATPase-dependent acidification and Ca-P60A/SERCA-dependent autophagosome-lysosome fusion. Autophagy. 2015 Jun;11(8):1437–1438.
- Scarlatti F, Maffei R, Beau I, et al. Role of non-canonical Beclin 1-independent autophagy in cell death induced by resveratrol in human breast cancer cells. Cell Death Differ. 2008 Aug;15(8):1318–1329.
- Spillantini MG, Schmidt ML, Lee VMY, et al. α-Synuclein in Lewy bodies. Nature. 1997 Aug 28;388(6645):839–840.
- Braak H, Braak E. Pathoanatomy of Parkinson’s disease. J Neurol. 2000 Apr;247(Suppl 2):II3–II10.
- Stefanis L. α-synuclein in parkinson’s disease. Cold Spring Harb Perspect Med. 2012 Feb;2(2):a009399.
- Nah J, Yuan J, Jung Y-K. Autophagy in neurodegenerative diseases: from mechanism to therapeutic approach. Mol Cells. 2015 May;38(5):381–389.
- Biglan KM, Oakes D, Lang AE, et al. A novel design of a Phase III trial of isradipine in early Parkinson disease (STEADY-PD III). Ann Clin Transl Neurol. 2017 May 9;4(6):360–368.
- Chan CS, Guzman JN, Ilijic E, et al. “Rejuvenation” protects neurons in mouse models of Parkinson’s disease. Nature. 2007 Jun 28;447(7148):1081–1086.
- Anekonda TS, Quinn JF. Calcium channel blocking as a therapeutic strategy for Alzheimer’s disease: the case for isradipine. Biochim Biophys Acta (BBA) - Mol Basis Dis. 2011 Dec;1812(12):1584–1590.
- Williams A, Sarkar S, Cuddon P, et al. Novel targets for Huntington’s disease in an mTOR-independent autophagy pathway. Nat Chem Biol. 2008 Mar;4(5):295.
- Shaker ME, Ghani A, Shiha GE, et al. Nilotinib induces apoptosis and autophagic cell death of activated hepatic stellate cells via inhibition of histone deacetylases. Biochim Biophys Acta, Mol Cell Res. 2013 Aug;1833(8):1992–1993.
- Yu H-C, Lin C-S, Tai W-T, et al. Nilotinib induces autophagy in hepatocellular carcinoma through AMPK activation. J Biol Chem. 2013 Jun 21;288(25):18249–18259.
- Hebron ML, Lonskaya I, Moussa CEH. Nilotinib reverses loss of dopamine neurons and improves motor behavior via autophagic degradation of α-synuclein in Parkinson’s disease models. Hum Mol Genet. 2013 Aug 14;22(16):3315–3328.
- Karuppagounder SS, Brahmachari S, Lee Y, et al. The c-Abl inhibitor, nilotinib, protects dopaminergic neurons in a preclinical animal model of Parkinson’s disease. Sci Rep. 2014 May;2(4):4874.
- Menzies FM, Fleming A, Rubinsztein DC. Compromised autophagy and neurodegenerative diseases. Nat Rev Neurosci. 2015 Jun;16(6):345–357.
- Xi Y, Noble S, Ekker M. Modeling neurodegeneration in Zebrafish. Curr Neurol Neurosci Rep. 2011 Jun;11(3):274–282.
- Prabhudesai S, Sinha S, Attar A, et al. “Molecular Tweezer” inhibitor of α-synuclein neurotoxicity in vitro and in vivo. Neurotherapeutics. 2012 Apr;9(2):464–476.
- Bai Q, Burton EA. Zebrafish models of tauopathy. Biochim Biophys Acta (BBA) - Mol Basis Dis. 2011 Mar;1812(3):353–363.
- Lopez A, Lee SE, Wojta K, et al. A152T tau allele causes neurodegeneration that can be ameliorated in a zebrafish model by autophagy induction. Brain. 2017 Apr 1;140(4):1128–1146.
- Bandmann O, Burton EA. Genetic zebrafish models of neurodegenerative diseases. Neurobiol Dis. 2010 Oct;40(1):58–65.
- Paquet D, Bhat R, Sydow A, et al. A zebrafish model of tauopathy allows in vivo imaging of neuronal cell death and drug evaluation. J Clin Invest. 2009 May;119(5):1382–1395.
- Fleming A, Rubinsztein DC. Zebrafish as a model to understand autophagy and its role in neurological disease. Biochim Biophys Acta (BBA) - Mol Basis Dis. 2011 Apr;1812(4):520–526.
- Varga M, Fodor E, Vellai T. Autophagy in zebrafish. Methods. 2015 Mar;75:172–180.
- Mathai BJ, Meijer AH, Simonsen A. Studying autophagy in Zebrafish. Cells. 2017 Jul 9;6(3).
- Hu Z-Y, Chen B, Zhang J-P, et al. Up-regulation of autophagy-related gene 5 (ATG5) protects dopaminergic neurons in a zebrafish model of Parkinson’s disease. J Biol Chem. 2017 Nov 3;292(44):18062–18074.
- Watchon M, Yuan KC, Mackovski N, et al. Calpain inhibition is protective in machado–joseph disease zebrafish due to induction of autophagy. J Neurosci. 2017 Aug 9;37(32):7782–7794.
- Swart C, Khoza A, Khan K, et al. Investigating basal autophagic activity in brain regions associated with neurodegeneration using in vivo and ex vivo models. J Alzheimer’s Dis Parkinsonism. 2017;07(4).
- Kimura S, Noda T, Yoshimori T. Dissection of the autophagosome maturation process by a novel reporter protein, tandem fluorescent-tagged LC3. Autophagy. 2007 Sep-Oct;3(5):452–460.
- Kwan KM, Fujimoto E, Grabher C, et al. The Tol2kit: A multisite gateway-based construction kit forTol2 transposon transgenesis constructs. Dev Dyn. 2007 Nov;236(11):3088–3099.
- Schindelin J, Arganda-Carreras I, Frise E, et al. Fiji: an open-source platform for biological-image analysis. Nat Methods. 2012 Jun 28;9(7):676–682.
- Schneider CA, Rasband WS, Eliceiri KW. NIH Image to ImageJ: 25 years of image analysis. Nat Methods. 2012 Jul;9(7):671–675.
- Asi YT, Simpson JE, Heath PR, et al. Alpha-synuclein mRNA expression in oligodendrocytes in MSA. Glia. 2014 Jun;62(6):964–970.
- Chiou W-F. Effect of Aβ exposure on the mRNA expression patterns of voltage-sensitive calcium channel α1 subunits (α1A–α1D) in human SK-N-SH neuroblastoma. Neurochem Int. 2006 Aug;49(3):256–261.
- Sousa SR, Vetter I, Ragnarsson L, et al. Expression and pharmacology of endogenous cav channels in SH-SY5Y human neuroblastoma cells. PLoS ONE. 2013 Mar 25;8(3):e59293–11. Dryer SE, editor.