
Abstract
The objective of this study was to investigate the growth stimulating properties of Bacillus subtilis CaSUT007 applied to cassava plants using fourier transform infrared (FTIR) microspectroscopy to monitor the production of cellular components involved in plant growth and development. Cassava stakes treated with CaSUT007 or sterile distilled water were germinated in soil. After incubation for 2 months, CaSUT007 treated plants had higher growth rate and greater biomass than the control. FTIR analysis revealed that the leaves of cassava plants treated with CaSUT007 display FTIR spectra changes in the epidermis and mesophyll tissue. These changes associated with proteins, lipids, and pectins, which are related to changes in plant cell growth and development. FTIR microspectroscopy can be used as a new tool to examine the biochemical changes within the plant tissue. This technique allows us to reveal structural chemical makeup and features of different tissue types.
Introduction
The cassava plant, Manihot esculenta, is one of the most important economically crops in Thailand. The aim of commercial cassava production in Thailand is to increase root yield and starch content in addition to enhancing the crop's adaptation to a wide range of plant growth conditions (Chavalparit & Ongwandee Citation2009; Buensanteai et al. Citation2012). In this regard, plant growth promotion by beneficial bacteria has been widely used; however, there are limited studies on the use of plant growth promoting bacteria with the propagation of cassava stakes. It is well known that various commercial strains of Bacillus sp. can control and enhance plant growth by triggering signaling pathways, leading to a more vigorous growing phenotype and tolerance to biotic and abiotic stress. Furthermore, it has been demonstrated that Bacillus cells can colonize plant roots, triggering stimulation of plant growth and development through biochemical and physiological mechanisms. B. subtilis CaSUT007, a plant growth promoting rhizobacteria (PGPR), has both direct and indirect modes of action involved in enhancing plant growth and development. Some direct modes of action are production of phosphate solubilizing substances and modulation of auxin levels (Prathuangwong & Kasem Citation2004; Prathuangwong et al. Citation2005; Prathuangwong & Buensanteai Citation2007; Buensanteai et al., Citation2012). The rhizobacteria contributes indirectly by inducing plant defense mechanisms, which is a means of biocontrol of cassava pathogens (Buensanteai et al. Citation2012).
Standard methods for the detection of changes in plant cellular components are based on enzymatic analysis and histological assay (Buensanteai, Yuen et al. Citation2008; Buensanteai, Athinuwat Citation2008; Buensanteai et al. Citation2009). However, these methods rely on the use of bulk samples resulting in averaging of the intrinsic inter-tissue and cellular heterogeneity. Hence, the precise interaction of important cellular changes involved with Bacillus cells with plant tissue is not fully understood. Therefore, we proposed the use of FTIR microspectroscopy, a technique capable of resolving biochemical changes at the plant cellular level (Yu et al. Citation2003; Skotti et al. Citation2014), to study biochemical changes in cassava plant.
FTIR microspectroscopy is a nondestructive analytical technique that is less time consuming and cheaper than the present ‘gold standard’ methods, providing unique molecular chemical information based on the FTIR spectrum (McCann et al. Citation1992; Yu Citation2004). For example, the amide I protein band that contains vibrations of the peptide bond containing C=O (80%) and N–H stretching (20%), appearing between 1700 and 1600 cm−1 can provide information about protein secondary structure. The carbohydrate fingerprint region (1200–800 cm−1) of the FTIR spectrum from cells and tissues is obtained via vibrations of C–O bonds, which depend on bond linkage and sugar types. In addition, FTIR spectra from plant tissue has revealed absorbance bands uniquely assigned to higher plant cellular components such as lignin (ring vibration around 1515 cm−1) (Kačuráková et al. Citation2000; Wilson et al. Citation2000).
Combining FTIR microspectroscopy with multivariate data analysis can enable to distinguish spectral fingerprint that can be related to the biochemical changes in a plant (Manrique & Lajolo Citation2004; Dokken & Davis Citation2007). This is an emerging technique for studying biochemical changes of plant tissue (Yu Citation2005). For example, functional characterization of plant tissues at high spatial resolution has been conducted using synchrotron infrared microspectroscopy to image the structure of plant tissues at a cellular level. The results can lead to a better understanding of plant components, such as lignin, cellulose, proteins, and lipids (Yu Citation2008).
In this study, we applied FTIR microspectroscopy to define plant tissue within cassava leaf sections and used this information to detect variations between control and those treated cassava stakes by B. subtilis. In particular, we demonstrate the use of FTIR microspectroscopy technique combined with multivariate data analysis to discriminate major tissue types in the cassava leaf, and demonstrate how this information enables us to track biochemical changes in cassava leaf tissue related to enhancement ofgrowth and development of cassava.
Materials and methods
Beneficial bacterial strains and culture conditions
B. subtilis CaSUT007 was cultured in 500 ml volumes of nutrient glucose broth containing 2% glucose and incubated at 28 ± 2°C for 48 h with constant shaking at 180 rpm. Cells were collected and washed twice by centrifugation (13,000 rpm; 20 min) and the bacterial cell pellet was washed three times in sterile isotonic saline (0.85% NaCl). The cells were re-suspended in sterile distilled water, with cell concentrations determined turbidimetrically and adjusted to an optical density of 0.2 at 600 nm, corresponding to 1 × 10⁸ cfu ml–1. A portion of the cell suspension was used in experiments in live form.
Plant materials and treatment
The cassava stakes cultivar Rayong 72 were surface disinfected using 95% ethanol (v/v) for 2 min, followed by soaking in 10% commercial bleach (v/v) for 20 min. The cassava stakes were then washed with sterile distilled water five times in order to remove the bleach. Before planting, cassava stakes were mixed thoroughly with 50 ml of a bacterial suspension treatment. The cell concentration in the culture was adjusted to 1 × 10⁸ cfu ml−1 on the basis of absorbance. The experiment was conducted under greenhouse conditions, with treated cassava stakes placed onto sterile soil. Pots were kept in a greenhouse with a 12-h photoperiod (28 ± 2°C and 75–80% relative humidity during the light period, 25 ± 2°C and >93% relative humidity during the dark period). The experiment was arranged in a completely randomized design with four replicates of 20 plants per treatment with one cassava stake in each pot. At 14 days after germination, cassava plants were harvested for measurement of growth parameters and biochemical composition changes using FTIR microspectroscopy. The experiment was performed three times. For statistical analyses, analysis of variance was determined according to Duncan's Multiple Range Test at P < .05 by using SPSS version 14.
FTIR microspectroscopy
(1) Sample preparation for FTIR microspectroscopy analysis
Cassava leaf tissue was fixed by placing it in a FAA (formaldehyde-acetic acid-ethanol) solution (Yu et al. Citation2003). Tissue was then rinsed in distilled water and dehydrated in increasing ethanol concentrations ending in absolute ethanol, then cleared in xylene. Cassava tissue was then embedded in paraffin and microtomed into thin cross section (∼4 μm thickness) which were then placed on indium tin oxide coated IR slides (MirrIR slides, Tienta Sciences, OH, USA) for subsequent infrared analysis.
(2) FTIR microspectroscopy analysis
The experiments were performed at the Synchrotron Light Research Institute, Thailand (public organization) by utilizing FTIR spectrometer (Vertex 70) connected to an IR microscope (Bruker optics, Germany). Measurements were performed with the synchrotron off-line, using a conventional IR source. The x–y raster maps comprising IR spectra were generated using a Hyperion 2000 IR microscope equipped with 36x objective and a mercury cadmium telluride (MCT) detector using a mapping stage controller at 10 micron intervals in the x and y direction. The IR spectra were collected using point to point mapping with the aperture setting at 15×15 µm square aperture with 7.5 µm steps, in reflection mode at 6 cm−1 resolution, with 64 scans co added, and converted to absorbance using Bruker OPUS 7.0 software (Bruker Optics Ltd, Ettlingen, Germany).
IR maps acquired from leaf samples were analyzed using Cytospec 1.3.4 (Cytospec Inc, NY, USA). Data preprocessing was required to remove spectra showing signs of Mie scattering, dispersion artifacts, and sloping baselines. Subsequently, the spectra were converted to the second derivative using the Savitzky-Golay method employing third order polynomial fitting with nine smoothing points, and vector normalized to compensate for the effects of differing sample thickness across the sections. Hierarchical cluster analysis (HCA) using D-values with Ward's algorithm was carried out over the spectral ranges of 1800–900 cm−1, which contained most of the biological bands in the IR spectrum. The outputs of HCA were visualized as dendograms with a unique color to assign for each spectral cluster.
(3) Principal Component Analysis (PCA)
Individual spectra from each group were analyzed using principal component analysis (PCA) to distinguish different chemical components of the samples using Unscrambler X 10.1 software. (CAMO, Norway). Preprocessing of the data was conducted by performing a second derivative by the Savitzky-Golay method (third polynomial, nine smoothing points) and normalized using Extended Multiplicative Signal Correction using the spectral regions from 1800–900 cm−1 in Unscrambler X 10.1 software (CAMO, Norway).
Results and discussion
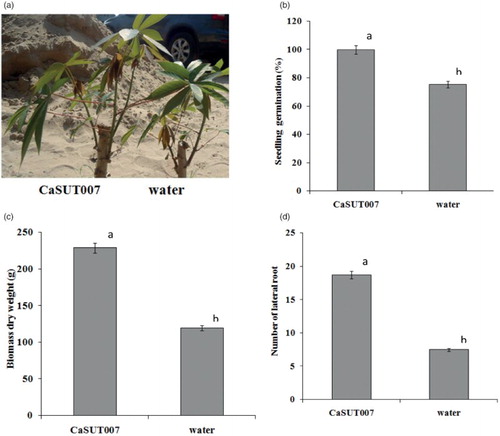
The strain CaSUT007 was effective in promoting the growth of cassava seedlings under greenhouse conditions, as measured by changes in the length, weight and lateral root of the seedlings after 14 days of planting. This strain, when applied to cassava vegetative propagation, increased shoot lengths by more than 35% ((a)), and increased dry weights by more than 90% ((b)) compared to the distilled water control. Cassava vegetative propagations treated with the strain CaSUT007 also increased the seedling germination and number of lateral root by more than 30% and more than 90%, respectively, when compared to the control treatment ((c) and 1(d)). Similar results were obtained when the experiment was repeated. In order to investigate the effects of CaSUT007 during the early stages of plant growth and development, the cassava seedlings of untreated and CaSUT007-treated seedlings were evaluated and their biochemical and cellular composition evaluated.
Figure 1. Effects of PGPR Bacillus subtilis CaSUT007 on the growth and development of cassava seedling under greenhouse conditions, as measured at 14 days after inoculation. (a) cassava seedling under greenhouse conditions in sterile soil, (b) percent of seedling germination, (c) dry weight, and (d) number of lateral root.
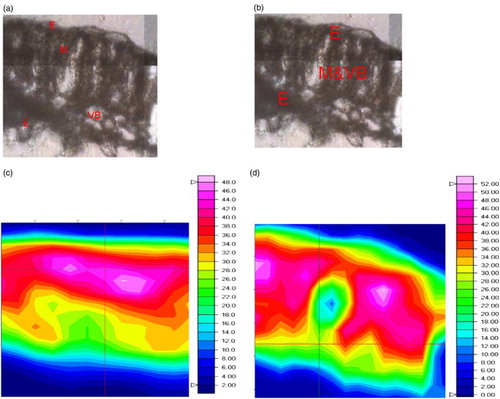
Cassava plant tissues are comprised of a diverse group of molecules, including proteins, lipids, lignins, pectins, and polysaccharides, with each molecular class having characteristic conformations dependent on the individual cell type. Typically, the leaves of higher plants are composed of epidermal (approximately 10% of total mass), mesophyll (approximately 55% of total mass), and vascular bundle (approximately 33% of total mass) tissues. Previous studies (McCann et al. Citation1992; Kačuráková et al. Citation2000; Wilson et al. Citation2000; Yu et al. Citation2003; Manrique & Lajolo Citation2004; Yu Citation2004; Skotti et al. Citation2014) have shown that these three tissue types can be readily distinguished in higher plant leaf tissue sections on the basis of macromolecular chemistry using FTIR microspectroscopy. In this study, we attempted to discern changes in macromolecular biochemistry in the different tissue types of cassava after the stakes were treated with the CaSUT007 strain of B. subtilis. shows maps of the integrated area of spectral regions equivalent to absorbance intensities over the ranges 1700–1580 cm−1 ((c)) for untreated cassava leaf (control) and cassava leaf treated with CaSUT007 ((d)), over a spatial area of 120 μm×100 μm within a transverse leaf section from a control sample ((a)) and cassava leaf treated with CaSUT007 ((b)). The map was contrasted using a color scheme to indicate absorbance intensity: blue (the areas of lowest level of absorbance) < green < yellow < red (the highest level of absorbance). As shown in the (c) and 2(d), the integrated spectra in the region of protein (1700–1580 cm−1) are mostly dominated in the mesophyll region.
Figure 2. Functional group area maps of a part of a transverse leaf section from cassava achieved using FTIR microspectroscopy point to point mapping with aperture setting at 15 × 15 µm square aperture with 7.5 µm steps. (a) A micrograph of the untreated (control) transverse section. (b) A micrograph of a transverse cassava leaf section from CaSUT007 treated plants. (c) Integrated functional groups maps obtained under the spectral region between 1700–1580 cm–1 for untreated (control). (d) Cassava leaf treated with CaSUT007. Dimensions of the area studied of 120 × 100 µm.
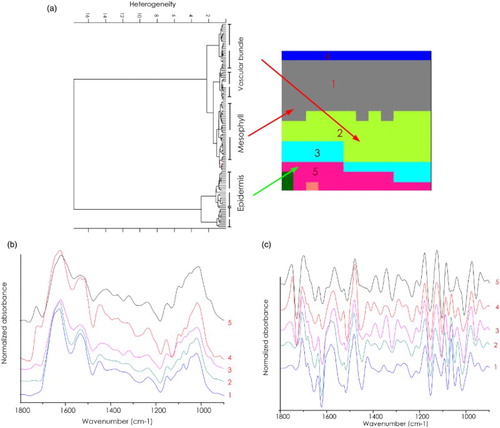
HCA was used to compare differences and similarities between tissue spectra involving spectral regions with information about Amide I protein (1700–1500 cm−1), C=O ester from lipid or lignin or pectin (1770–1700 cm−1), and C–O–C from polysaccharides (1200–900 cm−1). The cluster analysis of spectra from an untreated (control) leaf are shown in . The spectra from each cluster can be saved to perform multivariate data analysis with all spectra. Each cluster is displayed in a different color based on the similarities of protein, lipid, lignin, and polysaccharide spectral regions. The gray color represents spectra from mesophyll, while the spectra of the vascular bundle appear in two clusters indicated by light green (cluster 2) and light blue (cluster 3) colors. The clusters coded with pink (cluster 5) and blue (cluster 4) were related spatially to epidermis tissue. The average spectrum from each cluster is shown in (b) and 3(c). These results indicate stronger ester carbonyl absorbance in the epidermis spectra (1729 cm−1), and weaker in the vascular bundle spectra. We assumed that higher levels of endogenous lipids in the epidermis and higher levels of lignin in vascular bundle tissue accounted for these spectral similarities and differences. The highest level of protein (1621 cm−1) was seen in the spectra coded with gray and assigned to mesophyll). The amide I band maximum centered at 1621 cm−1 indicating that these cells contain proteins with pronounced β-sheet secondary structure. By contrast, spectra related to epidermis tissue have an amide I band profile presenting both α-helix (1648 cm−1) and β-sheet structure (1618 cm−1) with less intense absorbance of β-sheet and more intense absorbance from α-helix protein secondary structure compared to mesophyll tissue spectra.
Figure 3. FTIR mapping of a cassava leaf (control). (a) 2D HCA map performed using five clusters on the range of 1800–900 cm–1. Different clusters are encoded by different colors. (b) Representative original average spectra of the spectra cluster. (c) Representative second derivative average spectra of the spectra cluster. Mesophyll (cluster 1), vascular bundle (cluster 2 and 3), and epidermis (cluster 4 and 5).
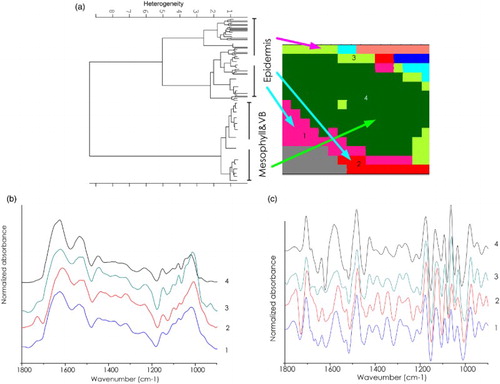
The HCA of spectra acquired from a cassava leaf after treatment with B. subtilis is shown in . Interestingly, the cluster colored with green (cluster 4) represents both mesophyll and vascular bundle. While the pink (cluster 1), red (cluster 2) and green (cluster 3) spectra from epidermis represent high extracellular matrix proteins and macro molecules. The average spectra from the spectral clusters assigned to epidermis all show high lipid absorbance (1729 cm−1) similar to spectra assigned to epidermis in the control leaf. The amide I band profile in the average spectra from clusters assigned to epidermis in the treated leaf indicate a mixture of α-helix (1648 cm−1) and β-sheet (1621 cm−1) secondary structure, similar to average spectra from clusters assigned to epidermis in the leaf control. The average spectra from clusters attributed to mesophyll and vascular bundle tissue also show an amide I band profile consistent with higher levels of β-sheet secondary structure content (1621 cm−1) similar to that observed in the mesophyll cluster average spectrum from the control leaf ((b) and 4(c)).
Figure 4. FTIR mapping of a cassava leaf section from CaSUT007 treated plants. (a) 2D HCA map performed using five clusters on the range of 1800–900 cm–1. Different clusters are encoded by different colors. (b) Representative original average spectra of the spectra cluster. (c) Representative second derivative average spectra of the spectra cluster.
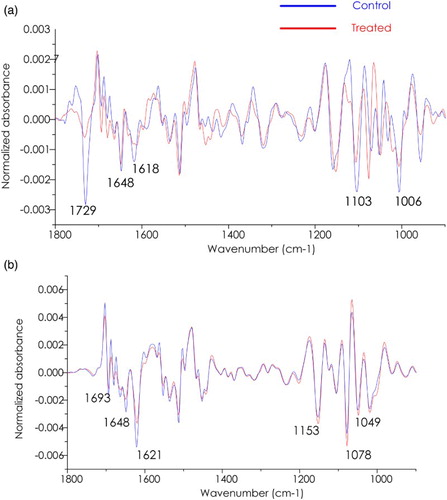
In order to compare spectral changes occurring in the protein, lipid, and polysaccharides, average spectra between control and treated cassava from the epidermis region are performed as shown in (a). Significantly, the band in the region from 1770–1700 cm−1 assigned to lipid is higher in absorbance in the average spectrum from the control group. The comparisons between spectra from mesophyll tissue are shown in (b). Apparently, the β-sheet secondary structure of protein, indicated by an amide I band maximum centered at 1621 cm−1 is more intense in the control group compared with treated cassava. In contrast, the absorbance in the polysaccharide region (1200–900 cm−1) is shown to be higher in the treated plant (Séné et al. Citation1994; Wang et al. Citation2012).
Figure 5. Overlay of the second derivative of the average spectra from a cassava leaf (control) compared with CaSUT007 treated plants. (a) Epidermis and (b) Mesophyll.
The characteristic band from FTIR spectra of the main biopolymers of the plant cell wall depends on the crystallinity and conformation of the polysaccharides. Fingerprint region contains several polymers of different types, such as proteins, aromatics, polysaccharides, having a particular molecular conformation and interacting with neighboring molecules in a specific way as shown in . The cassava biochemical changes of epidermis and mesophyll in control and treated cassava showed the significant spectra shift: 1550–1600 cm−1, 1350–1450 cm−1, less than 1000 cm−1, which can be associated with a change in the construction and formation of the plant cell wall. It is known that bacteria affect the structure of plant cell walls. In some cases, the bands in a particular spectral region cannot be assigned to a specific functional group, but they are characteristic as a whole and constitute a fingerprint for the molecule (McCann et al. Citation1992; Séné et al. Citation1994).
Table 1. Band assignment of IR spectra presented in the plant tissues.
Multivariate data analysis, in particular PCA technique, was employed to characterize biochemical changes in the cassava leaf tissue induced by B. subtilis strain CaSUT007. Score plots were used to visualize any clustering of similar spectra within the datasets, and loading plots were employed to identify spectral variables that best explained clustering patterns. The results were interpreted by taking second derivative spectra showing the negative peak. The second derivative can help resolve nearby peaks and sharpen spectral features. Therefore, the positive loading plots showed an opposite correlation with the negative score plot, and the negative loading plot showed an opposite correlation with the positive score plot. The criterion to apply the band assignment was supported by the previous section, based on observation of the average second derivative spectra from control and treated cassava.
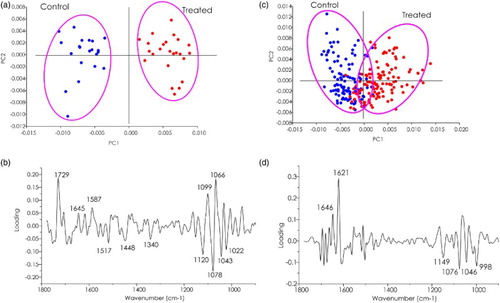
The use of multivariate analysis, in particular principle component analysis (PCA), has proven useful in the analysis of biospectroscopic data, providing two types of information: the visualization of the clustering of similar spectra within datasets in scores plots and the identification of variables (spectral bands representing various molecular groups within the samples) in loadings plots to explain the clustering observed in the scores plots (Wetzel & LeVine Citation2000). The PC1 and PC2 loading were shown that differences in bands associated with lipid, pectin, lignin, protein, and polysaccharide were responsible for the separation of the sample clusters treated and un-treated cassava stakes treated with bacteria CaSUT007 (). Lipid or lignin bands (at 1729 cm−1) and complex changes in bands associated with polysaccharide regions (at 1120, 1078, 1043, 1022 cm−1) were predominantly observed in (b), corresponding to the large difference observed in the average spectra in (a). Considering the complex biochemical changes of spectra was associated with the Amide I protein (at 1646, 1621 cm−1) and polysaccharide regions (at 1149, 1076, 1046, 998 cm−1) ((d)), involved in difference clusters of the average spectra in (b).
Figure 6. PCA analysis of a cassava leaf. (a) Score and (b) loading plots from PCA analysis of epidermis control groups compared CaSUT007 treated plants. (c) Score and (d) loading plots from PCA analysis of mesophyll control groups compared CaSUT007 treated plants.
This study indicated that FTIR microspectroscopy technique could investigate cassava leaf sections at a high spatial resolution and reveal macromolecular differences between control and treated leaf tissue CaSUT007. This technique combined with HCA and PCA can be used to resolve chemical structural information related to the various tissue types in the plant leaf (Buensanteai et al. Citation2012). Importantly, both HCA and PCA enable the exploration of spectral changes from epidermis and mesophyll tissue after treatment with B. subtilis CaSUT007 compared with untreated controls. Our results suggest spectral differences in both the epidermal and mesophyll tissue regions consistent with changes especially in proteins, lipids, and polysaccharides. This study is consistent with other studies in which PGPR, Bacillus species in particular, elicit the production of plant biological molecules that lead to structural and physiological changes associated with the plant growth and development in cassava (Prathuangwong & Kasem Citation2004; Prathuangwong et al. Citation2005; Prathuangwong & Buensanteai Citation2007; Buensanteai et al. Citation2012). The results from this study show changes in the epidermal tissue after treatment with B. subtilis strain CaSUT007 indicative of lower levels of proteins with β-sheet secondary structure as well as lower lipid levels compared with the control. Moreover, the results of the accumulation of pectin and polysaccharide in cassava plants might be associated with cell wall formation. Plant cell walls are complex composites of cellulose, cross-linking glucans, protein, and pectin substances. This technique can be applied to analyze stems of wheat cultivars via the spectral fingerprinting of cell walls and to identify chemical differences between genotypes with varying levels of lodging resistance (Wetzel & LeVine Citation2000; Wang et al. Citation2012). From our results, we found that the shifts in the absorbance intensities at different frequencies between control and treated leaves can be related to the concentrations of different molecules such as cellulose, protein, pectin, and lignin. In related report, ectin plays an important role within the cell walls of a growing plant. It was mentioned that pectin and pectin methyl-esterification which involves plant defense chemical compositions with mainly associated with beta-sheet secondary structure which play an important role in cell wall metabolism (McCann et al. Citation1992; Yu Citation2004; Skotti et al. Citation2014). These biochemical changes may possibly involve enzymes implicated in degradation processes such as pectinases that catalyze de-esterification of pectin by the action of pectin esterferase and other pectin enzymes (Kačuráková et al. Citation2000; Manrique & Lajolo Citation2004). Interestingly, the peaks in the carbohydrate fingerprint region (1200–1000 cm−1) show an increase in absorbance, particularly in the bands at 1076 cm−1 and 1153 cm−1. This might be related to pectin polysaccharides, such as homogalactruonan, rhamnogalacturan, or beta-glucan (callose), known to be found in cell walls of plant leaves (Yu Citation2005; Dokken & Davis Citation2007), increasing in response to the B. subtilis strain CaSUT007 treatment of the cassava plants. In this context, we hypothesize that plant growth promotion by CaSUT007 results from the activation of enzymes in the plant cell walls of the epidermis (Yu Citation2005) that are related to growth and development processes. Due to its integral role in carbon fixation, the ribulose 1,5 biphosphate carboxylase/oxygenase (RuBisCO) enzyme comprises 50% of the total amount of proteins found in the leaf, which means that changes in its concentration in the leaf can be tracked using FTIR by looking for changes in the spectra associated with alpha-helix proteins since the secondary structure of RuBisCo is predominately alpha-helices (McCann et al. Citation1992; Wilson et al. Citation2000; Yu et al. Citation2003; Yu Citation2004; Buensanteai et al. Citation2009; Skotti et al. Citation2014). On the other hand, the epidermis appeared to have predominantly alpha-helix secondary structure with an overall decrease in protein content detected in the treated group. It is unknown whether this difference in protein secondary structure could be occurring due to the environmental growth condition.
Conclusion
In conclusion, FTIR microspectroscopy can be used as a new tool to examine the biochemical changes within plant tissue. This technique allows us to reveal the structural chemical makeup and the features of different tissue types. The use of PCA and HCA was applied to characterize the spectral differences between epidermal and mesophyll tissues. In addition, the results showed that cassava stakes treated with B. subtilis CaSUT007 produced leaves that displayed changes in FTIR spectra from epidermis and mesophyll tissue regions that may be associated with compositional and concentration changes of proteins, lipids, pectins, and polysaccharides. These changes are related to the changes in cell growth and development that might be result in yield improvement. However, further research is needed to better understand and characterize these chemical and structural changes directly caused by B. subtilis CaSUT007 treatment. In the future, we plan to collect the leaf samples at differing harvest times in order to compare spectral differences that could be occurring during the growth and development of cassava plants with an emphasis on relating the effect of the treatment to the stimulation of plant growth regulators and yield improvement. Moreover, it might be useful to study cell wall modifications in order to understand the biochemical changes resulting from treatment of cassava stakes with CaSUT007. In particular, the mid infrared region at 1200–800 cm−1 can be used to identify polysaccharides with different structures in order to examine the composition of leaf cell walls. This study represents the first steps toward the achievement of our goal.
Acknowledgments
Thanks are also due to the NSTDA for the grant support. Also, we would like to express our appreciation to the Synchrotron Light Research Institute, for providing the partial funding support, FTIR instruments and beamtimes.
Disclosure statement
No potential conflict of interest was reported by the authors.
Funding
This work was supported by Suranaree University of Technology and by the Higher Education Research Promotion and National Research University Project of Thailand, Office of the Higher Education Commission. Also, this research is supported by funds from the Thailand Research Funds the grant number MRG5580195.
Notes
† First and second authors are equally contributed to this work.
References
- Buensanteai N, Athinuwat D, Chatnaparat C, Yuen GY, Prathuangwong S. 2008. Extracellular proteome of plant growth promoting-bacteria, Bacillus amyloliquefaciens KPS46 and its effect on enhanced growth promotion and induced systemic resistance on soybean. Kasetsart J Nat Sci. 42:13–26.
- Buensanteai N, Thumanu K, Sompong M, Athinuwat D, Prathuangwong S. 2012. The FTIR spectroscopy investigation of the cellular components of cassava after sensitization with plant growth promoting rhizobacteria, Bacillus subtilis CaSUT007. Afr J Microbiol Res. 6(3):603–610.
- Buensanteai N, Yuen GY, Prathuangwong S. 2008. The biocontrol bacterium Bacillus amyloliquefaciens KPS46 produces auxin, surfactin and extracellular proteins for enhanced growth of cucumber plant. Thai J Agric Sci. 41:101–116.
- Buensanteai N, Yuen GY, Prathuangwong S. 2009. Priming, signaling, and protein production associated with induced resistance by Bacillus amyloliquefaciens KPS46. World J Microbiol Biotechnol. 25:1275–1286.
- Cael JJ, Gardner KH, Koenig JL, Blackwell J. 1975. Infrared and Raman spectroscopy of carbohydrates. V. Normal coordinate analysis of cellulose. J Chem Phys. 62:1145–1153.
- Campbell MM, Sederoff RR. 1996. Variation in lignin content and composition mechanisms of control and implications for the genetic improvement of plants. Plant Physiol. 110:3–13.
- Chavalparit O, Ongwandee M. 2009. Clean technology for the tapioca starch industry in Thailand. J Clea Produc. 17:105–110.
- Colthup NB, Daly LH, Wiberley SE. 1964. Introduction to infrared and Raman spectroscopy. New York, NY: Academic Press.
- Dokken KM, Davis LC. 2007. Infrared imaging of sunflower and maize root anatomy. J Agric Food Chem. 55:10517–10530.
- Faix O. 1992. Fourier transform infrared spectroscopy. In: Lin SY, Dence CW, editors. Methods in lignin chemistry. New York, NY: Springer-Verlag; p. 83–106.
- Kačuráková M, Capek P, Sasinková V, Wellner N, Ebringerová A. 2000. FT-IR study of plant cell wall model compounds: pectic polysaccharides and hemicelluloses. Carbohydr Polym. 43:195–203.
- Kenneth MD, Lawrence CD. 2005. Use of infrared microspectroscopy in plant growth and development. Appl Spectrosc Rev. 40:301–326.
- Manrique GD, Lajolo FM. 2004. Cell wall polysaccharide modifications during postharvest ripening of papaya fruit (Carica papaya). Post Biol Tech. 33:11–26.
- McCann MC, Hammouri M, Wilson R, Belton P, Roberts K. 1992. Fourier transform infrared microspectroscopy is a new way to look at plant cell walls. Plant Physiol. 100(4):1940–1947.
- Nelson WH. 1991. Modern techniques for rapid microbiological analysis. New York, NY: VCH Publishers.
- Pelton JT, McLean LR. 2000. Spectroscopic methods for analysis of protein secondary structure. Anal Biochem. 277:167–176.
- Prathuangwong S, Buensanteai N. 2007. Bacillus amyloliquefaciens induced systemic resistance against bacterial pustule pathogen with increased phenols, peroxides, and 1,3-glucanase in cucumber plant. Acta Phytopathol Et Entomol Hungarica. 42:321–330.
- Prathuangwong S, Kasem S. 2004. Screening and evaluation of thermotolerant epiphytic bacteria from soybean leaves for controlling bacterial pustule disease. Thai J Agric Sci. 37:1–8.
- Prathuangwong S, Kasem S, Thowthampitak J, Athinuwat D. 2005. Multiple plant response to bacterial mediated protection against various diseases. ISSAAS J. 11(3):79–87.
- Séné CFB, McCann MC, Wilson RH, Crinter R. 1994. Fourier-transform raman and fourier-transform infrared spectroscopy: an investigation of five higher plant cell walls and their components. Plant Physiol. 106:1623–1631.
- Skotti E, Kountouri S, Bouchagier P, Tsitsigiannis DI, Polissiou M, Tarantilis PA. 2014. FTIR spectroscopic evaluation of changes in the cellular biochemical composition of the phytopathogenic fungus Alternaria alternate induced by extracts of some Greek medicinal and aromatic plants. Spectrochim Acta A Mol Biomol Spectrosc. 127:463–472.
- Wang J, Zhuac J, Huangac RZ, Yang Y. 2012. Investigation of cell wall composition related to stem lodging resistance in wheat (Triticum aestivum L.) by FTIR spectroscopy. Plant Signal Behav. 7(7):856–863.
- Wetzel DJ, LeVine SM. 2000. Biological applications of infrared microspectroscopy. In: Gremlich HU, Yan B, editors. Infrared and raman spectroscopy of biological materials. New York: Marcel Dekkar; p. 101–142.
- Wilson RH, Smith AC, Kačuráková M, Saunders PK, Wellner N, Waldron KW. 2000. The mechanical properties and molecular dynamics of plant cell wall polysaccharides studied by fourier-transform infrared spectroscopy. Plant Physiol. 124:397–405.
- Yu P. 2004. Application of advanced synchrotron-based fourier transform infrared microspectroscopy (SR-FTIR) to animal nutrition and feed science: A novel approach. Br J Nutr. 92(6):869–885.
- Yu P. 2005. Molecular chemistry imaging to reveal structural features of various plant feed tissues. J Structural Biol. 150:81–89.
- Yu P. 2008. Synchrotron-based microspectroscopic analysis of molecular and biopolymer structures using multivariate techniques and advanced multi-component modeling. Can J Anal Sci Spectrosc. 53:220–231.
- Yu P, McKinnon JJ, Christensen CR, Christensen DA, Marinkovic NS, Miller LM. 2003. Chemical imaging of microstructures of plant tissues within cellular dimension using synchrotron infrared microspectroscopy. J Agric Food Chem. 51(20):6062–6067.