
 ?Mathematical formulae have been encoded as MathML and are displayed in this HTML version using MathJax in order to improve their display. Uncheck the box to turn MathJax off. This feature requires Javascript. Click on a formula to zoom.
ABSTRACT
In educational contexts where many domains subject to improvement are interdependent and causal evidence is frequently lacking it is difficult, if not impossible, for policymakers and educational practitioners to decide which domain should be invested in. This paper proposes a new method that uses Conditional Mean Independent Correlations (CMIC) and normative growth functions to inform such decision-making processes. In this paper, CMIC and growth functions are applied to data from a research-practice partnership to identify high impact improvements among domains that are considered important to the district’s mission and vision around student learning. The results point to improvement domains that administrators did not consider to be high impact improvements initially, suggesting that this method brings leaders food for thought around strategies for improvement efforts. The CMIC and growth functions moreover accommodate opportunities for policymakers and practitioners to base their decisions on theory and data, providing them with a stronger degree of decision-making authority for use of resources for improvement. Simultaneously, CMIC and growth functions enable researchers to test and further develop theoretical models on improvement efforts. Limitations and suggestions for further research are discussed.
Efforts at improving public education systems in support of better achievement for all students are commonplace across the globe with most countries experiencing policies targeted at improving their nation’s schools. Many of these improvement efforts rely strongly on decisions at the leadership level of a school organization concerning which improvement domains (i.e. the areas targeted by school improvement efforts) should be targeted first and how (Daly and Finnigan Citation2016). These decisions are highly consequential, as efforts at all levels of the school system can be ineffectual if they do not target impactful domains (Schildkamp Citation2019). Policy and effective leadership are thus conditional to the success of improvement efforts in public education systems (Creemers and Kyriakides Citation2007). However, policymakers and school leaders are often busy with the demands of running school organizations and do not always make use of academic theory and evidence (Neeleman Citation2019) and data from within schools to guide decision-making (Schildkamp Citation2019). Further, the access to and use of evidence is strongly related to the accessibility, availability, and applicability of research and evidence (Daly et al. Citation2014, Daly and Finnigan Citation2014).Footnote1 Further complicating the matter is the interdependency between improvement domains (improving one domain can lead to significant changes in other domains) and causal evidence about these relationships is often lacking (David et al. Citation2000). Moreover, whether general theoretical models apply is often unclear given specific contextual factors that play a role in organizations (Hatch Citation1998).
To address this pressing problem, policymakers, funders, and researchers have been creating new mechanisms to ensure that research can be more instrumental in educational improvement (National Research Council Citation2003, Snow and Donovan Citation2012). Evolving research suggests that new ways for researchers and practitioners work together on problems of practice hold promise for facilitating better-informed evidence and data-based decision-making processes at the district and school level (Coburn and Penuel Citation2016, Schildkamp Citation2019).
To exploit the potential of research-practice partnerships, this paper proposes a new method to pinpoint the (educational) domains that can best be improved. The method accommodates pre-determined improvement growth preference, such that the decisions on what improvement domains to focus on are more targeted and relevant for practice. Furthermore, this method draws on observational data reflective of comprehensive models of educational quality, such that decisions on what improvement domains to focus on are informed by research and data. Specifically, the method consists of the following two parts: (1) Conditional Mean Independent Correlations (CMIC) and (2) normative growth functions. The first part deals with generating interdependencies between pairs of improvement domains not driven by observed variation in other domains. This idea stems from statistical matching (Rubin Citation1973), however, the method proposed in this paper derives these correlations by using ordinary least square regression to derive these correlations (Angrist and Pischke Citation2008). The CMIC serves as input for the second part, the growth functions. These are weight functions that determine the relative priority of growth in the considered domains. The growth functions construe rankings of high impact improvement domains based on the CMIC. These normative growth functions are based on optimization theory and social welfare functions in welfare economics (Samuelson Citation1947, Bergson Citation1954, Pattanaik Citation2008). By applying the normative growth functions on the CMIC, this method offers a way to apply a set of decision-making rules to guide improvement efforts.
CMIC and growth functions provide a quantitative contribution to the currently available tools and strategies suitable for research-practice partnerships. Firstly, the CMIC and growth functions leverage and make clear what normally would complicate matters – namely the interdependency between improvement domains and the contextual situatedness of data. Focusing on the interplay of improvement domains – rather than isolated X’s and Y’s – better reflects the complexity of educational improvements and decision-making and that is precisely what makes this method valuable in improvement processes compared to quantitative approaches commonly used by educators themselves when engaging in data-based decision-making, such as descriptive and inferential statistics such as t-tests (Kippers et al. Citation2018). With these existing approaches, teachers and school leaders may experience challenges in translating the data into an action plan (Schildkamp Citation2019).
Secondly, this method contributes to theory development, challenging researchers to define comprehensive models of educational quality and collect data that informs on all constructs included in such models. The objective of the method presented here is not to estimate the causal effect between improvement domains. Instead, it aims to generate an empirical ‘best guess’ for how one domain changes with another and vice versa. To that end, the method requires a complete set of domains for improvement, that is, representative of comprehensive models of educational quality. As such, this method attributes an important role of educational theory and lends itself for empirical evaluation of the comprehensiveness of models on educational quality.
Thirdly, this method enables a translation from data to policy based on the set of decision rules offered by the growth functions. This has the potential to increase ‘data agency’ in educational organizations, meaning that practitioners become more critical about and responsible for the role of data in their decision-making. In terms of building data literacy – a common issue in research-practice partnerships (Earl and Katz Citation2006, Wohlstetter et al. Citation2008, Wu Citation2009) – the intuition and the contribution of the method can be understood without a formal exposition of the technical details. By specifically designing a data-analysis method for research-practice collaborations, this paper thus addresses an important need in educational sciences (Coburn and Penuel Citation2016).
In this paper, we showcase the CMIC and growth functions using data that were collected in an urban fringe school district in California in the context of a research-practice partnership called ‘Better Together’. The Better Together research-practice partnership started in 2019 and aims to gain research-based insights into innovation processes and to further support the innovation initiatives that the district has underway. For this paper, we will use data on different domains (described in the data section) that are affected by innovations focused on student learning. We use this data and the proposed CMIC and growth functions to identify high impact domains that will have the greatest impact on improvement domains related to student learning. We showcase different scenarios, based on three different growth functions, and compare those to school leaders’ intuitive ranking of the improvement domains.
The remainder of this paper provides a thorough description of the application of the CMIC and growth functions to the data of the Better Together research-practice partnership. Firstly, the data and context of the project are described. Secondly, the basic principles of the method are explained and applied. As such, this paper showcases different possible normative growth functions that can be used to turn the CMIC into normative rankings of high impact improvement domains. Thirdly, the outcomes of the CMIC and growth functions are discussed in light of the school leaders’ intuitive sense of high impact improvement domains. Finally, this paper provides a discussion of this method in light of future research and research-practice collaborations on improvement efforts in public education systems.
The Better Together partnership and data
To illustrate the workings of CMIC and growth functions, we use data from the Better Together research-practice partnership. The specific objective of this partnership is to gain research-based insights related to the district’s focus on ‘student-centered’ or ‘personalized’ learning. The collected data comes from an urban fringe school district in California that serves close to 10,000 diverse students in eleven elementary and secondary schools. Twenty-six percent of the students have free and reduced-price meals and 13% of them are in the English language-learning program. The school district has a long history of supporting educational innovation initiatives to improve the learning outcomes of students (Grey Citation2019). Over the recent years, the district focused on the development and implementation of innovations related to student-centered learning, such as the implementation of student-led learning technology, initiatives around instruction, such as ‘leader in me’ and ‘universal learning design’, and initiatives for teacher collaboration and professionalization.
The study data come from a repeated cross-sectional design in which survey data were collected from the same group of participants in the district each year, from 2019 onward. Participants included all administrators, all educators, and all staff members. Invitations to students and parents were limited to four grade levels (grade level 3, 6, 9, and 12 in 2019). The survey was designed based on instruments from the University of Chicago Consortium on School Research that were further modified and validated by the research team to better fit the study context (see also Liou et al. Citation2019). In addition, the Student Experiences of Proximity inventory was included in this survey (van Halem Citation2022). For the empirical application of the CMIC and growth functions, student data were used. In future efforts, one could perform these methods on data from other stakeholder groups as well. Data on the following nine domains were gathered from students:
These domains were considered relevant by the school district leadership and are consistent with the literature on student-centered learning (van Halem Citation2022), school leadership (Fullan Citation2015, Fullan et al. Citation2017, Liou and Daly Citation2018, Lockton Citation2019), culture and climate (Gaziel Citation1997, Deal and Peterson Citation2016, Liou et al. Citation2019), and relationships in districts and schools (Borgatti and Ofem Citation2010, Daly Citation2010, Daly et al. Citation2010).
Descriptive statistics
In the empirical application, we use survey data, collected in the Winter and Spring of 2019, on the aforementioned nine domains among 1598 students enrolled in grades 3, 6, 9, and 12. This corresponds to a response rate of 54%. Each domain was measured using multiple-item perceptual scales. Descriptive statistics and reliability coefficients of the scales are shown in and Pearson correlation coefficientsFootnote2 in .Footnote3
Table 1. Descriptive statistics of student perceptions on all domains subject to improvement.
Table 2. Pearson correlation coefficients based on the total scores across domains.
The survey also collected information on grade level, gender, race, and ethnicity. The sample consists of 53% female students, 24% grade 3 students, 63% grade 6 students, and 13% grade 9 and 12 students. The majority of the students reported an Asian or American Asian background (64%) followed by a Hispanic or Latino background (7%), a white, non-Hispanic background (4%), and students with other -or multiracial- backgrounds (24%).
Deriving conditional mean independent correlations
The objective of the CMIC is to provide estimated correlations between the improvement domains that are conditional mean independent of the observed variation in other standardized outcome variables.Footnote4 Appendix 1 provides a general empirical representation of a model with N domains for improvement – i.e. standardized outcome variables – that estimates interdependencies between the N domains for improvement without imposing theoretical restrictions regarding potential (Equation 1 and 2) and a detailed description of how CMIC is obtained with a 2-equation system (Equation 3). CMIC was estimated using the Zellner’s Seemingly Unrelated Regression package of the STATA software version 16 (https://www.stata.com/, Zellner Citation1962).Footnote5 The estimated CMIC reflect how domain changes with a change in
. Using these estimates, we can simulate how all domains would change if one particular domain is increased by 1 unit. For this objective, all variables are normalized to have a mean of 0 and a standard deviation of 1. As a result, CMIC generate for each domain
, the changes in
associated with a standard deviation of improvement in
.
A feature of the proposed CMIC, and great value to educational practitioners and policymakers, is that the addition of explanatory variables and background characteristics (the X variables) should not alter the estimated correlations between domains subject to improvement if the defined set of N domains is complete.Footnote6 Completeness of the set of N domains refers to the inclusion of all relevant outcome domains, as defined in a chosen theoretical model on educational quality. The intuition is that – under this completeness assumption – observed variation in the outcome variables should absorb all observed variation in explanatory variables (X and Z), rendering the inclusion of these variables obsolete. We do not observe unobserved variables (Z), but by examining the extent to which the estimated CMIC (
and
) change due to the inclusion of observed characteristics (X) yields information about whether this completeness assumption holds empirically.
Up to now, we have assumed that we estimate each CMIC twice in the 2-equation system ( and
), but in the empirical application we estimate both a restricted model in which
and an unrestricted model in which we estimate the parameters
and
separately. Even though there is one unique CMIC (
) for each outcome pair
, not achieving conditional mean independence on unobserved characteristics Z by the inclusion of X and
can result in two different parameter estimates for
and
.
shows the estimated CMIC () between domains for the data of the Better Together research-practice partnership, as well as the R2 for
. These correlations are estimated using the restricted model presented in Equation 3 in Appendix 1. In this model, gender, ethnicity, and grade level dummies are included as background characteristics (X). visualizes the obtained CMIC. The figures in the table and the lines in the graph show that many domains are strongly and positively correlated to other domains and that the estimated CMIC between student perceptions of Belonging and Culture and climate is the highest.
Figure 1. Estimated conditional mean independent correlations.
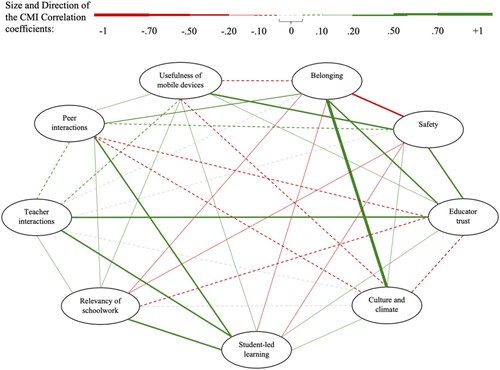
Table 3. Estimated Conditional Mean Independent Correlations (CMIC) between domains.
Recall that the restricted model represented by Equation 3 in Appendix 1 assumes . However, the unrestricted model does not assume that
and estimates two separate parameters
and
. As is discussed previously, when conditional mean independence on unobservables (Z) is not achieved by the inclusion of X and
, the
parameter of the restricted model can be significantly different from the estimated parameters
and
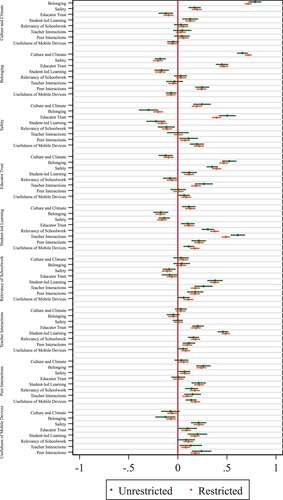
. This means that unobserved characteristics can affect each domain of the considered pair differently, and the estimated correlation may then be representing the correlation between the domains and the unobserved characteristics. evaluates the relevance of this distinction for the model imposed on the Better Together data by visualizing the estimated 95% confidence intervals of both the unrestricted and restricted CMIC. In and by themselves, overlapping confidence intervals indicate do not mean that there are no statistically significant differences between coefficients in the unrestricted and restricted models. In total, 13.89 percent of the differences between
parameters that form a pair within the unrestricted model were statistically significantly different (α = 0.05). This provides evidence against the assumption that each domain of the considered pairs is affected equally by unobserved characteristics (i.e.
) and as such indicates a violation of the completeness assumption for this specific empirical example. The differences between the unrestricted and restricted model can also be a result of an attenuation bias in case of unequal measurement error across improvement domains.
Figure 2. Estimates and confidence intervals of the unrestricted and restricted Conditional Mean Independent Correlations (CMIC). The x axis represents the direction and strength of the CMIC coefficient between the improvement domain that is written vertically and the domain that is written horizontally on the left side of the graph.
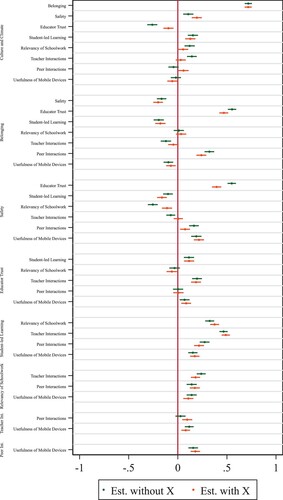
Similarly, displays the estimated confidence intervals of the CMIC with and without the inclusion of observed background characteristics. Based on this figure we can conclude whether the inclusion of background characteristics X results in the estimation of a significantly different parameter. To some extent, this is an empirical check for whether the defined set of N domains is complete (i.e. containing all relevant domains), given that the other outcome variables included in the model (i.e. Equation 3 in Appendix 1) should absorb the influence of all observed and unobserved characteristics in the case of such completeness. The number of estimated parameters that change statistically significantly due to the inclusion of background characteristics X is more than would be expected based on the completeness assumption. This change in estimates indicates an incomplete theoretical model (i.e. domains are not included that are correlated with these background characteristics) and/or issues of multicollinearity between the domains currently included and these background characteristics X.
Figure 3. Estimates and confidence intervals of the Conditional Mean Independent Correlations (CMIC) with and without inclusion of observed background characteristics. The x axis represents the direction and strength of the CMIC coefficient between the improvement domain that is written vertically and the domain that is written horizontally on the left side of the graph.
Applying normative growth functions to the CMIC
This section describes how growth functions can be used to translate the CMIC to construe rankings of high impact improvement domains.Footnote7 Normative growth functions provide a set of decision rules for determining which domain should be improved to yield higher overall educational quality defined by the total set of N domains. These growth functions are normative, meaning that there is no single growth function that is correct, but rather that different configurations of improvements can be valued differently by different stakeholders. More simply put, the growth functions can have the objective to, for example, minimize inequality between the outcomes or maximizing total output. The choice for one of the two objectives is subjective and relies on priorities imposed by relevant stakeholders (e.g. policymakers).
In this section, we present three growth functions. These growth functions construe rankings of high impact improvement domains either by maximizing the sum of all improvements (Maximize Growth, MG), a weighted sum of these improvements (Maximize Growth with Preference Weights, MG-PW), or the sum of overall improvements after penalizing the expected inequality between domains (Maximize Growth with Inequality Penalty, MG-IP). In Appendix 2 we describe how each growth function utilizes the CMIC to generate – for each domain – an overall growth score
. Based on this score, a normative ranking is established, indicating which domain ought to be improved to yield the largest expected overall improvement across all domains. Below, we discuss the outcomes of applying each of the three growth functions to the CMIC based on data of the Better Together research-practice partnership.
Maximized growth
The objective of the Maximize Growth (MG) decision rule is to increase improvement in outcomes aggregated over all N domains, regardless of potential differences in relative improvement across domains. This can be interpreted as a simple ‘more is better’-rule. presents the high impact improvement rankings when MG is applied. The empirical results point to student-led learning as the highest impact improvement domain for the school district of interest, followed by educator trust. We note that in the ranking derived from applying MG, it seems that four distinct ranking groups appear to emerge with fairly similar overall growth scores : (1) ranks 1–2, (2) ranks 3–6, (3) ranks 7–8, and (4) rank 9.
Table 4. Ranking highest impact improvement based on Maximize Growth (MG).
Maximize growth with preference weights
The objective of Maximize Growth with Preference Weights (MG-PW) is to gain insight into high impact improvements associated with the highest growth in pre-specified prioritized domains. Prioritizing domains is normative and should therefore be determined beforehand by relevant stakeholders (e.g. policymakers). A possible reason to prioritize one domain over another is the ambition to meet new practice and policy standards that target particular domains more than others. For example, the practice and policy context might require a higher inclusion rate of students with special educational needs in regular education in the district. Changes (improvements or declines) in certain domains, such as the relevancy of schoolwork, safety, and belonging, might in that case be weighted more heavily than changes in other domains when identifying the highest impact improvement(s). provides the results of applying the aforementioned example of MG-PW on the Better Together data, in which relevancy of schoolwork, safety, and belonging all are allocated a weight of 1/3, yielding preference proportions of 0 for the remaining six domains. Intuitively, this indicates a situation in which policymakers only – and equally- care about improvements in the relevancy of schoolwork, safety, and belonging. Yet, interestingly, the MG-PW results in show that – when considering the interconnectedness in domains – improving culture and climate is associated with higher overall growth in these prioritized domains, rather than improving one of these the prioritized domains themselves. Similarly, these MG-PW results also reveal that increasing educator trust is associated with higher overall growth in the prioritized domains than improving safety, one of the prioritized domains.
Table 5. Ranking highest impact improvement based on Maximize Growth with Preference Weights (MG-PW).
Maximize growth with inequality penalty
The objective of Maximize Growth with Inequality Penalty (MG-IP) is to maximize overall growth while acknowledging that growth should not go at the expense of domains for which currently already low results are observed (i.e. relatively low standardized means). For example, whereas the MG results () indicate that student-led learning is associated with the highest overall growth in all domains, this is negatively associated with belonging and safety (see ). Such a negative association might be particularly problematic when a domain is already considered to be at an undesirably low level. Here, students report relatively low scores on safety, as indicated by the lowest relative score of 64% in . As such, one would like to take this into account when deciding what high impact improvement to embark on. In the MG-PW approach, policymakers could thus assign a higher preference proportion to improve safety, as to consider this concern. Alternatively, when applying MG-IP, the approach then is to penalize decisions that are negative – or only weakly positively- associated with safety, without prioritizing growth in safety explicitly. Thus, whereas MG-PW derives overall growth scores based on CMIC weighed by their assigned preference proportions, MG-IP does so by maximizing CMIC while penalizing improvements associated with only weak – or negative- improvements in the domain that is currently lowest (here: safety). As such, MG-IP makes explicit the desire to restrict the overall range in outcomes across domains, thereby emphasizing the notion of inequality. More specifically, MG-IP focuses on safeguarding the domain that scores currently the lowest, which is intuitively related to a desire for enabling outcome adequacy across all domains. The relative emphasis put on penalizing improvements related to weak – or negative – changes in safety is arbitrary and needs to be determined beforehand by the relevant stakeholders (e.g. policymakers). An alternative approach is to estimate MG-IP rankings across a range of different penalties and infer how it affects relative rankings. For illustration, we apply a MG-IP approach to the Better Together data with the penalty term (λ) set at 0.5. The results displayed in show that relative to the baseline MG approach, safety has improved its ranking from 9 to 4, whereas student-led learning, ranked as the highest impact school improvement in MG, is ranked sixth when applying a MG-IP approach. Similar to MG, educator trust is still a high impact school improvement in MG-IP, which intuitively can be explained by its positive – and relatively strong – CMIC (i.e. +0.40) with safety.
Table 6. Ranking highest impact improvement based on Maximize Growth with Inequality Penalty (MG-IP).
Comparing normative rankings based on growth functions and leaders’ intuition
In this section, the normative rankings based on the three growth functions presented earlier in this section and a ranking of improvement domains provided by site administrators in the district (N = 15) are compared. To derive the ranking by school leaders, each site administrator was asked to individually send in a top three highest impact improvements, and based on fifteen responses a ranking was distilled based on a point system. Each first choice (i.e. the top one) received three points, each second choice received two points, and each third choice received one point. Improvement domains that were not chosen received zero points. The ranking was based on the total of points per domain based on the fifteen responses. The number of points was unique for each domain and the domain with the highest score was ranked first, and so on. The higher the ranking the better it is to improve this domain conditionally on the beliefs of administrators or the type of growth rule that is chosen. visualizes the rankings resulting from three different growth functions and the ranking of administrators.
Figure 4. Rankings of highest impact improvement domains based on CMIC and growth functions and administrators’ reports. The rank-order values are based upon the numbers 1–9.
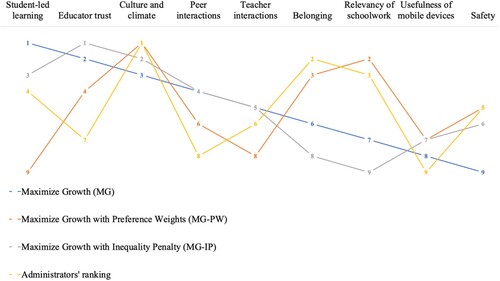
Applying CMIC and growth functions to the Better Together data shows that the identification of high impact improvements depends strongly on the chosen growth function. Striking similarities are found between the MG-based ranking and the MG-IP ranking; both identify educator trust as the highest impact improvements. The MG-PW ranking shows a different pattern, keeping in mind that this growth function only considers growth in three out of the nine domains (that is safety, relevancy of schoolwork, and belonging).
Comparisons between the administrators’ ranking and the MG ranking are not straightforward as they are derived using very different strategies. In addition, due to the strong indications for the violation of the completeness assumption, the validity of the CMIC cannot be assured. Yet, some similarities emerge between both rankings in the sense that culture and climate and student-led learning score relatively high in both, whereas the domain usefulness of mobile devices scores relatively low in both. Overall, there are distinct differences between the ranking using MG and a ranking based on administrators’ responses. For example, educator trust is ranked the second-highest improvement impact domain by MG but is ranked only 7th in the administrators’ ranking. Similarly, whereas the relevancy of schoolwork is ranked relatively high by administrators, it is ranked only 7th by MG. This could resemble the fact that it is difficult for policymakers to determine which domain(s) should be intervened upon in terms of generating overall improvement across a range of interconnected domains. Alternatively, it is consistent with the idea that policymakers do not adopt a simple ‘more is better’ rule – such as MG- in deciding how to move forward, but rather also consider the relative importance weights of particular domains (i.e. MG-PW) and/or the variability in current levels across domains (i.e. MG-IP).
One might notice a striking similarity between the administrator's ranking and the maximized growth with preference weights growth function. Relative to the MG ranking, it thus seems that this particular example of MG-PW somewhat better approximates the preferences of administrators. However, these similarities should be interpreted with caution. The preference weights were not chosen by the administrators, but by the authors and serve as a hypothetical example. Administrators would potentially assign preference weights to other domains, yielding a different MG-PW ranking.
An important outcome of all three growth functions is that the domain that scores lowest according to students (here: safety) is not identified as a high impact improvement with either of the growth functions, even when explicitly assigning preference weights to this domain. Moreover, the administrator's ranking differs considerably from the outcomes of the growth functions. Strikingly, administrators did not consider educator trust to be a high impact improvement, while both the MG and MG-IP point at educator trust as high impact improvement. Overall, it can be concluded that the growth functions can shed new light on high impact improvements when compared to a ranking based on administrators’ experiences, viewpoints, and tacit knowledge.
Conclusion and discussion
In educational contexts where many improvement domains are interdependent and causal evidence is frequently lacking it is difficult, if not impossible, for educational practitioners and policymakers to confidentially decide which domain to invest time and resources in. With CMIC and growth functions, decisions on which domains, among the many available alternatives, should be improved first are more targeted and informed. This method challenges current beliefs and models of how educators approach school improvement efforts, as many decision-makers draw on experience, anecdote, or from trusted others (Daly and Finnigan Citation2014). This is particularly relevant when school districts are in high-stakes contexts and outcomes of decisions potentially impact the lives of thousands of students. Further, the development of this method resulted from scholars and practitioners working hand in hand to test and assess domains for improvement. The method is thus a by-product of what happens when researchers and practitioners pair up in improving systems. The interaction between the evolution of the research-practice partnership and the development of CMIC and growth functions is an important one as it suggests that other partnerships may innovate and mutually support improvement goals.
In this paper, the CMIC and growth functions are applied to data from the Better Together research-practice partnership to identify high impact improvements for student learning. Prior research shows that school leaders’ decision-making on school improvement efforts is typically not grounded in academic evidence and data (Neeleman Citation2019). The results show a substantial discrepancy between what school leaders may think are high impact domains and what the CMIC and growth functions identify as improvements that maximize growth across domains related to student-centered learning. This could mean that when school leaders go by what they ‘think’ are important improvement domains on which to focus, they may well overlook domains that have a stronger positive association with designated improvement domains.
Given the crucial role of decision-making on improvement efforts at the leadership level (Creemers and Kyriakides Citation2007, Schildkamp Citation2019), our results underline the importance of making data and academic theory part of the decision-making process. The CMIC and growth functions provide a unique opportunity to engage district officials at different levels with theory and data by being able to actively ‘scenario build’ and test out different sets of possibilities with data collected from their context. Such involvement of decision-makers can challenge them to reflect deeply on implicit assumptions that exist in educational organizations. The implementation of CMIC and growth functions therefore also provides an avenue for research into organizational decision-making processes.
The CMIC and growth functions also provide a unique opportunity for theory development, challenging researchers to partner and define comprehensive models of educational quality and collect data that informs on all constructs included in such models. This method, namely, requires a theoretical model that is comprehensive and complete. When this assumption is violated, domains that are not included in the method will distort the results and yield a biased ranking. As shown in this paper, there are several ways to test whether this assumption holds, and these tests can be leveraged by researchers to better understand the validity of theoretical models. The Better Together data provides evidence for violation of the completeness assumption. This an important result in and by itself as it points out that efforts should go into collecting data on other domains relevant for this setting in order to better facilitate data-informed decision-making based on CMIC. Given the complex nature of social sciences and the scarcity of quantitative methods that enable such a comprehensive assessment of a theoretical model, the CMIC and growth functions can play an important role in the academic domain.
There are several limitations of the CMIC and growth functions. The CMIC and growth functions presented here do not consider factors such as the potential for growth in a certain domain or the cost-effectiveness of growth in a certain domain. Future research can address whether this information can be successfully integrated with growth functions. Future research can invest high impact improvement domains using the CMIC and growth functions longitudinally, to examine whether improvements in certain domains indeed effectuate the expected change in other domains and whether such changes affect the ranking provided with the CMIC and growth functions over time. For now, the outcomes of CMIC and growth functions should not be taken for granted, but scrutinized and discussed by both practitioners and researchers as simply a guide to the use of resources for improvement within school districts. The role of an ongoing research-practice partnership is important here as it creates the space to test out assumptions and address limitations.
In line with the basic philosophy of a partnership, the method presented here based on CMIC and growth functions strives to be ‘mutually beneficial’ for all stakeholders: it provides researchers with new opportunities for theory development and it provides district officials with a stronger degree of decision-making authority for use of resources for improvement. CMIC and growth functions can make a wider contribution as health care and other sectors face similar challenges concerning decision-making for improvement efforts. Research-practice partnerships in a variety of sectors are needed to realize the potential of CMIC and growth functions for informing policy decisions.
Disclosure statement
No potential conflict of interest was reported by the author(s).
Notes
1 The study of Neeleman (Citation2019) revealed that a diverse range of school interventions lacked corresponding evidence of effectiveness as is described in internationally authoritative educational effectiveness syntheses.
2 These correlations may be attenuated by measurement error given a lack of perfect reliability. We recommend applying a correction procedure such as Bayesian inference for correlations (Matzke et al., Citation2017). Measurement error might not impact the ultimate rankings derived from the CMIC and growth functions method under the assumption of equal measurement error across y’s. We will reflect on this assumption and provide an empirical check in the next section where we describe how CMIC are derived.
3 The variable ‘educator trust’ represents both principal and teacher trust, which were originally two separate variables that are merged to avoid multi-collinearity issues in estimating conditional mean independent correlations. The pair-wise correlation between teacher and principal trust is .78.
4 Conditional mean independence refers to a situation in which estimated correlations between any two domains are unrelated to observed variation in other domains. Formally, conditional mean independence (CMI) implies E, such that the error terms in a regression estimation model are unrelated with
upon controlling for other outcomes
, observed (X) and unobserved (Z) characteristics. We note that our objective is not to use the CMI-assumption to estimate the causal effect between
and
. Instead, we use it to generate a predictive weight for outcome pair
,
as an empirical ‘best guess’ for how domain
changes with
and vice versa.
5 Zellner’s Seemingly Unrelated Regression package of the STATA software ssumes homoscedasticity of the error terms. The Seemingly Unrelated Estimation (suest) package of the STATA software (https://www.stata.com/) provides an alternative that does not assume homoscedasticity and that allows to adjust for clustered data.
6 And if the relationship between and
is indeed linear, although non-linear pair-wise correlations can also be considered by the model.
7 The revealed violation of the completeness assumption obstructs making inferences based on the outcomes. We continue with the application of the growth functions in order toillustrate the CMIC method, but the outcomes of this method for this specific empirical example should thus be interpreted with caution.
8 For expositional purposes, we assume here that the relationship between and
is linear, but the model is able to account for non-linear correlations.
9 To be specific, for each pair of domains , we first include
and only if
is significant in the equations, we add
. In the second step, we include
and if
is significant, we add
. This stepwise process is repeated until the next added variable is not statistically significant. As such, the functional form can be different for both domains
.
10 t thus follows that if is itself the domain that currently has the lowest standardized mean value, a maximum pair-wise correlation of 1 is observed and no penalty (penalty = 0) is imposed for improving
.
References
- Angrist, J.D., and Pischke, J.S., 2008. Mostly harmless econometrics: An empiricist's companion. Princeton, NJ: Princeton University Press.
- Bergson, A., 1954. On the concept of social welfare. The quarterly journal of economics, 68 (2), 233–252. doi:10.2307/1884448.
- Borgatti, S.P., and Ofem, B., 2010. “Social network theory and analysis.” In: A. J. Daly, ed. Social network theory and educational change. Cambridge, MA: Harvard Education Press, 17–25.
- Coburn, C.E., and Penuel, W.R., 2016. Research–practice partnerships in education: Outcomes, dynamics, and open questions. Educational researcher, 45 (1), 48–54.
- Creemers, B., and Kyriakides, L., 2007. The dynamics of educational effectiveness: A contribution to policy, practice and theory in contemporary schools. Oxfordshire, UK: Routledge.
- Daly, A., and Finnigan, K., 2016. Thinking and acting systemically: Improving school districts under pressure. Washington, DC: American Educational Research Association.
- Daly, A.J., 2010. Social network theory and educational change. Cambridge, MA: Harvard Education Press.
- Daly, A.J., and Finnigan, K., 2014. Using research evidence in education: From the schoolhouse door to capitol hill. Rotterdam: Springer Press.
- Daly, A.J., et al., 2010. Relationships in reform: The role of teachers’ social networks. Journal of educational administration, 48 (3), 359–391., doi:10.1108/09578231011041062.
- Daly, A.J., et al., 2014. Misalignment and Perverse Incentives: Examining the Politics of District Leaders as Brokers in the Use of Research Evidence. Educational policy, 28 (2), 145–174. doi:10.1177/0895904813513149.
- David, R., Teddlie, C., and Reynolds, D., 2000. The international handbook of school effectiveness research. London:Psychology Press.
- Deal, T.E., and Peterson, K.D., 2016. Shaping school culture. San Francisco, CA: John Wiley & Sons.
- Earl, L., and Katz, S., 2006. Leading schools in a data rich world. Thousand Oaks, CA: Corwin Press.
- Fullan, M., 2015. Leadership from the middle. Education Canada, 55 (4), 22–26. doi:10.1108/JPCC-06-2019-0013.
- Fullan, M., Quinn, J., and McEachen, J., 2017. Deep learning: Engage the world change the world. Thousand Oaks, CA: Corwin Press.
- Gaziel, H.H., 1997. Impact of school culture on effectiveness of secondary schools with disadvantaged students. The journal of educational research, 90 (5), 310–318.
- Grey, A.M. 2019. Cultures of innovation and the role of the leader. Thesis (PhD), University California, San Diego, California State University, San Marcos.
- Hatch, T., 1998. The differences in theory that matter in the practice of school improvement. American educational research journal, 35 (1), 3–31. doi:10.2307/1163450.
- Kippers, W.B., et al., 2018. Data literacy: What do educators learn and struggle with during a data use intervention? Studies in educational evaluation, 56, 21–31. doi:10.1016/j.stueduc.2017.11.001.
- Liou, Y.H., and Daly, A.J., 2018. Investigating leader self-efficacy through policy engagement and social network position. Educational policy, 34 (3), 411–448., doi:10.1177/0895904818773904.
- Liou, Y.H., Bjorklund Jr, P., and Daly, A.J., 2019. Climate change in common core policy context: the shifting role of attitudes and beliefs. Educational policy, 35 (6), 908–948. doi:10.1177/0895904819843603.
- Lockton, M., 2019. Chasing joint work: administrators’ efforts to structure teacher collaboration. School leadership & management, 39 (5), 496–518. doi:10.1080/13632434.2018.1564269.
- Matzke, D., et al., 2017. Bayesian inference for correlations in the presence of measurement error and estimation uncertainty. Collabra: psychology, 3 (1), 25. doi:10.1525/collabra.78.
- National Research Council, 2003. Strategic education research partnership. Washington, DC: National Academies Press.
- Neeleman, M.B.M., 2019. School autonomy in practice: School intervention decision-making by Dutch secondary school leaders. Maastricht: Universitaire Pers Maastricht. doi:10.26481/dis.20190628mn.
- Pattanaik, P.K., 2008. Social welfare function. In: M. Vernengo, E. Perez Caldentey, B. J. Rosser Jr, eds. The new Palgrave dictionary of economics, second edition. London: Palgrave Macmillan, 1–7.
- Rubin, D.B., 1973. Matching to remove bias in observational studies. Biometrics, 29 (1), 159–183. doi:10.2307/2529684.
- Samuelson, P.A., 1947. Some implications of linearity. The Review of Economic Studies, 15 (2), 88–90.
- Schildkamp, K., 2019. Data-based decision-making for school improvement: Research insights and gaps. Educational research, 61 (3), 257–273. doi:10.1080/00131881.2019.1625716.
- Snow, C.E., and Donovan, M.S. 2012. The strategic education research partnership: A new approach to educational research.
- van Halem, N. 2022. Accommodating Agency-Supportive Learning Environments in Formal Education. Thesis (PhD), Vrije Universiteit Amsterdam, the Netherlands.
- Wohlstetter, P., Datnow, A., and Park, V., 2008. Creating a system for data-driven decision-making: applying the principal-agent framework. School effectiveness and school improvement, 19 (3), 239–259. doi:10.1080/09243450802246376.
- Wu, P. 2009. Do we really understand what we are talking about? A study examining the data literacy capacities and needs of school leaders. Thesis (PhD), University of Southern California, Los Angeles.
- Zellner, A., 1962. An efficient method of estimating seemingly unrelated regressions and tests for aggregation bias. Journal of the american statistical association, 57 (298), 348–368.
Appendices
Appendix 1
Deriving conditional mean independent correlation
Equation 1 provides a general empirical representation – without imposing theoretical restrictions regarding potential dependencies between outcome variables – of a baseline model with N outcome variables:
(1)
(1)
The left-hand side of Equation 1 represents the set of N – potentially- interdependent outcome variables . The right-hand side represents that these outcome variables are associated with k observed characteristics X, l unobserved characteristics Z, and that each outcome is measured with classical measurement error
. Obviously, unobserved characteristics cannot be included in the actual estimation model, but it is important to acknowledge that omitting these unobserved characteristics can potentially bias all estimation parameters
. We can rewrite Equation 1 more concisely as:
(2)
(2)
Equation 2 considers that outcome-specific error terms may be correlated (i.e. non-zero off-diagonals in Equation 1), but it does not impose – or allow – for specific outcome interdependencies, as no outcome variables appear on the right-hand side of Equation 2 when estimating .
The conditional mean independent linear correlation for pair can be estimated with the following 2-equation system using Seemingly Unrelated Regression:
(3)
(3) With N domains, the system in Equation 3 has to be estimated
times such that correlations are estimated for outcome pair. In Equation 3, the estimation parameters
and
represent the obtained CMIC for a particular outcome pair
.Footnote8
Conditional mean independence is achieved by the inclusion of , where n refers to the nth domain included and subscripts −i and −j indicate that all domains, except
and
, are included as control variables as to achieve conditional mean independence for each outcome pair
. The inclusion of higher order polynomials allows for a flexible functional form (quadratic, cubic, quartic, …) and superscript m refers to the order of the polynomial included for variable
. Higher order polynomials of
are added stepwise to the estimation model until the next polynomial added does not statistically significantly explain variation in
or
.Footnote9
Appendix 2
Normative growth functions
The three growth functions that utilize the CMIC to generate an overall growth score (Maximize Growth, MG; Maximize Growth with Preference Weights, MG-PW; Maximize Growth with Inequality Penalty, MG-IP) are empirically represented as follows:
(4)
(4)
The Maximize Growth (MG) decision rule first calculates for each domain the sum of the estimated CMIC . Next, domains are ranked from high to low, as to indicate which are likely to be high impact improvement domains. A MG rule then maximizes growth as determined by
. Consider, for example, three standardized outcome variables. The MG approach then creates the following values for each of the three outcome variables:
where
represents the estimated CMIC for a particular outcome pair {
}. The outcome variable that should be improved according to this MG rule is then determined by
.
For the nine domains considered in the empirical application, the MG rule determines for each domain the total growth of all domains if this domain increases with one standard deviation. The MG rule thus determines.
and filling in the estimated CMIC of , this yields the following values for
:
The domain that should be improved according to this MG-PW rule is then determined by .
When calculating Maximize Growth with Preference Weights (MG-PW), each domain first receives a relative importance/preference weight . These preference weights reflect the relative importance of domains. In the case of Maximize Growth (MG), changes in each of the nine domains were weighted equally in deriving the sum of CMIC. As such, each domain had a preference proportion of 1/9 (i.e. 1/n) associated with it, yielding an implicit weight of 1. Instead, when applying MG-PW, weights are adjusted based on the preference of the policymaker, yielding preference proportions (p) for each domain.
Translated to the educational context it is, for example, possible that student safety and school culture/climate (at a given point in time) are considered to be more important by decision-makers than student autonomy as domains of impact. A MG-PW rule then maximizes growth as determined by , while considering that the former two dimensions should be weighted relatively more heavily than the latter. Consider again three standardized outcome variables. The MG-PW approach then creates the following values for each of the three outcome variables:
The domain that should be improved according to this MG-PW rule is again then determined by .
MG-IP maximizes growth similar to MG, but adds a penalty that is decreasing in the correlation between the evaluated domain and the domain with the lowest standardized mean value
.Footnote10 Considering again the example with three outcome variables, and assuming that the observed mean for the third outcome variable
is currently lowest approach then creates the following values for each of the three outcome variables are generated by a MG-IP approach:
where the penalty parameter
is a value between 0 and 1 and needs to be determined in order for normative rankings can be determined. A larger value for
indicates that more weight (i.e. preference) is given to relative equality across domains in the sense that weak (or even negative) correlations between the evaluated domain and the domain with the lowest mean are more heavily penalized. As such, setting
(i.e. inequality in domains is considered irrelevant) renders the MG-IP equivalent again to the aforementioned MG approach. Furthermore, irrespective of the value chosen for
, no inequality penalty is imposed on improving the domain that is currently lowest
, such that the Growth-score generated for this particular domain with MG-IP is always equivalent to the one derived with a MG approach. The domain that should be improved according to this MG-PW rule is again then determined by
.