
 ?Mathematical formulae have been encoded as MathML and are displayed in this HTML version using MathJax in order to improve their display. Uncheck the box to turn MathJax off. This feature requires Javascript. Click on a formula to zoom.
ABSTRACT
Temperature shift (TS) to a hypothermic condition has been widely used during protein production processes that use Chinese hamster ovary (CHO) cells. The effect of temperature on cell growth, metabolites, protein titer and quality depends on cell line, product, and other bioreactor conditions. Due to the large numbers of experiments, which typically last 2–3 weeks each, limited systematic TS studies have been reported with multiple shift temperatures and steps at different times. Here, we systematically studied the effect of temperature on cell culture performance for the production of two monoclonal antibodies by industrial GS and DG44 CHO cell lines. Three 2–8 day short-duration methods were developed and validated for researching the effect of many different temperatures on CHO cell culture and quality attributes. We found that minor temperature differences (1–1.5 °C) affected cell culture performance. The kinetic parameters extracted from the short duration data were subsequently used to compute and predict cell culture performance in extended duration of 10–14 days with multiple TS conditions for both CHO cell lines. These short-duration culture methods with kinetic modeling tools may be used for effective TS optimization to achieve the best profiles for cell growth, metabolites, titer and quality attributes. Although only three short-duration methods were developed with two CHO cell lines, similar short-duration methods with kinetic modeling may be applied for different hosts, including both microbial and other mammalian cells.
Introduction
Chinese hamster ovary (CHO) cells are currently the preferred host for recombinant protein production in the biopharmaceutical industry.Citation1–Citation3 Cell line engineering, medium development and bioreactor optimization are three major upstream approaches for improving titer while maintaining quality in CHO culture process development and biomanufacturing.Citation2,Citation4–Citation6 Although temperature is one of most important bioreactor parameters for cell culture performance, it is easy to control in comparison to other bioreactor parameters such as pH, dissolved oxygen and carbon dioxide. CHO cells are usually grown at the physiological temperature of around 37 °C. Temperature shift (TS) to a hypothermic condition has been intensively studied to balance cell growth, protein productivity, and quality in both microbial fermentationCitation7–Citation9 and mammalian cell culture.Citation7,Citation10,Citation11 Such a TS strategy holds the potential to improve fermentation and cell culture performance for a prolonged period with better overall productivity and quality.Citation9,Citation12–Citation14 Since temperature downshifts have been reported to improve protein productivity by many different CHO cell lines,Citation7,Citation12,Citation13,Citation15–Citation17 it is widely used as an effective platform strategy for cell culture process development and manufacturing in the biopharmaceutical industry.
The effect of TS on CHO cell culture and quality attributes depend on cell line, recombinant protein product, culture media, and other bioreactor conditions.Citation11,Citation16,Citation18,Citation19 In response to sub-physiological temperatures, the cell doubling time increases and the death rate is reduced with cells arrested in the G1 phase of the cell cycle.Citation20 In order to maintain high viable cell density (VCD) during cell culture, a bi-phasic culture strategy is often used with cell growth at around 37 °C during the exponential growth phase, followed by a shift to a lower temperature for protein production during the late log and/or the stationary phases.Citation14,Citation16 A mild temperature downshift decreases cell apoptosis, metabolism, nutrient utilization, ATP consumption and toxic metabolite accumulation.Citation7 Lower oxygen consumption and shear stress resistanceCitation11,Citation21,Citation22 at lower temperatures are beneficial to scale-up for manufacturing with respect to less foaming, lower power input, and more process robustness. The effects of temperature downshift in CHO cell cultures on key quality attributes, including protein aggregation,Citation23 charge variants,Citation24,Citation25 N-glycansCitation15 and host cell proteins, has been reported.Citation26 Therefore, it is necessary to consider both titer and quality attributes when developing a temperature shift strategy for CHO cell culture. In addition to bi-phasic cultures, tri-phasic cultures have also been reported to improve upstream titer and product quality attributes.Citation27,Citation28 Nonetheless, the effects of temperature downshift on CHO cell culture performance and quality attributes are not fully understood, which is a major focus in recent reports.Citation17,Citation26,Citation29–Citation34 Because of the potential benefit on titer and possible negative impact on quality attributes, the optimal TS condition should be systematically developed for each individual cell line and protein product separately.Citation11,Citation18,Citation19 Fed-batch cell cultures, currently most commonly used in the biopharmaceutical industry, usually use long culture durations of 2–3 weeks. Many TS conditions, including different shift times, temperatures and steps, may require substantial resources in order to identify an optimal TS condition. Due to resource constraints and the complexity of systematic TS development, many reports only include one or two TS conditions.Citation12,Citation14,Citation19,Citation30,Citation31,Citation33 To the best of our knowledge, an efficient short-duration method to quantitatively evaluate temperature effects and to systematically screen many TS conditions has not been reported for industrially relevant CHO cell lines.
Kinetic models generated from a small amount of experimental data may provide good mathematic tools to simulate, analyze, and predict CHO cell culture processes,Citation35–Citation39 and this is more efficient than empirical data analysis based on large numbers of experiments. Structured models that contain complete cell culture metabolism mechanistic information are able to explicitly illustrate the cell metabolismCitation38 and the enzymatic reactions.Citation40,Citation41 However the complexity of intracellular processes, as well as the involvement of hundreds of chemicals and reactions, makes it difficult to apply this class of models in CHO cell culture.Citation42 Therefore, unstructured models, such as Monod type relationships are widely used to describe CHO cell culture.Citation29,Citation38,Citation43–Citation46 Unstructured models partially characterize cell culture properties using measurements such as cell density, nutrients, and metabolites while neglecting complex intracellular metabolism. However, few models for TS optimization have been reported for the industrially relevant CHO cell lines.Citation29
In this study, batch and fed-batch CHO cell culture experiments with 4–8 day short durations were conducted to estimate kinetic parameters for production of two monoclonal antibodies (mAbs) (mAb1 and mAb2) by two industrial cell lines (GS CHO1 and DG44 CHO2), respectively. The kinetic models built from short-duration experiments were verified by independent fed-batch experiments for both CHO cell lines in 14-day culture duration. Since preliminary experiments during early process development indicated that both cell lines achieved better cell culture performance with a TS than the constant temperature at 36.5 °C, we focused on TS conditions only other than constant temperature conditions in the full duration verification runs here. Many TS conditions with different times, temperatures, and steps were then computed and predicted to identify the top TS conditions using the kinetic models for the simulation of cell growth, protein production, nutrient consumption and metabolite formation. Thus, the prediction and simulation of different TS conditions by kinetic models may make cell culture process development more efficient by saving time and reducing resources in comparison to performing large numbers of experiments with empirical data analysis for systematic TS development. We found that even a 1–1.5 °C difference affected cell culture performance, and this was cell-line specific. Thus, a few temperatures tested with empirical data analysis in literature may not be sufficient to identify the optimal TS strategy. In addition, we developed a 2-day short duration batch culture method to study the effect of different temperatures on mAb2 productivity and key quality attributes by DG44 CHO2 cell line. The trends we observed were similar to those of a 14-day full-duration fed-batch culture.
Results
Development of an 8-day short duration fed-batch method for the study of different temperatures on cell growth, metabolites and mAb1 production by GS CHO1 cell line
Model development and data analysis
The 8-day short duration fed-batch runs at different constant temperatures with a high initial VCD of 10 × 10Citation6 cells/mL included all cell culture phases: growth, stationary and death ( A). The reason we chose the high initial VCD of 10 × 10Citation6 cells/mL was to have the fed-batch runs completed within a shorter duration than a typical initial VCD of 0.6 × 10Citation6 cells/mL. The cell growth, metabolites and protein production profiles are presented in . The model results matched well with the experimental data at different temperature conditions that ranged from 32 to 36.5 °C (). The general trend was that higher temperatures resulted in higher growth rates (µmax) and death rates (kd) () with higher peak VCD (), which was in agreement with literature.Citation16,Citation19,Citation47 Nonetheless, the highest peak VCD was achieved with the highest glutamine production and glutamate consumption profiles at 35 °C (). The higher peak VCD at 35 °C than 36.5 °C () was due to the fact that the kd value at 35 °C was about half of that at 36.5 °C, while µmax values were similar between 35 and 36.5 °C (), although there was only 1.5 °C difference between the two conditions.
Table 1. Kinetic parameters for cell growth, protein production and lactate calculated from the 8-day short duration fed-batch study with GS CHO1 cell line.
Figure 1. CHO1 cell growth (A), metabolite profiles: glucose (B), glutamine (C), glutamate (D), and lactate (E), and mAb1 production: titer (F) and specific productivity qP (G) in fed-batch production in 250-mL shake flasks at different constant temperatures of 32, 33, 34, 35, and 36.5 ºC with a high initial VCD of 10 × 10Citation6 cells/mL for an 8-day short duration. The dots denote the experimental data with the average of duplicate runs (n = 2) and the lines represent the simulation results.
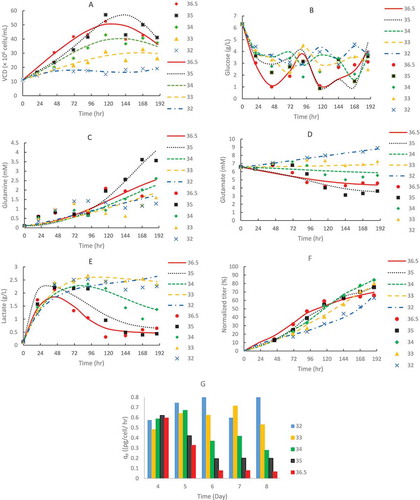
Lactate metabolism was also sensitive to temperature. With increasing temperature, higher kLac and bLac, and lower aLac were obtained (), implying that higher temperature accelerated lactate consumption but had less effect on lactate production. This explained the earlier lactate metabolism shift and lower lactate peak value at higher temperatures above 34 °C, while higher lactate concentrations were observed when the temperature was below 33 °C (). Since lactate is generally considered to negatively impact cell culture, we tried to avoid a TS strategy below 33 °C due to potential lactate accumulation for this GS CHO1 cell line.
The specific productivities (qP) at different days were quite different at different temperatures (). Day-4 qP values were similar at different temperatures. The qP values at 35 and 36.5 °C decreased from day 4 to 8 and decreased from day 6 to 8 at 34 °C, however, the qP values at 32 and 33 °C were similar from day 4–8 (). We found that lower temperature conditions maintained qP values better over time than higher temperature conditions during cell culture (), which is in agreement with several other studies.Citation48–Citation50 The overall productivity (KP) was negatively correlated with increasing temperature (). As described previously, VCD and growth rate (µmax) were positively correlated with increasing temperature ( A and ). For this specific study, the condition at 34 °C achieved the highest final titer (). Because protein production was associated with both integral VCD and specific protein productivity, the condition at 34 °C provided good balance of growth rate and specific productivity for the highest final titer for mAb1 by GS CHO1 cell line (, F and G).
Model validation, prediction and application
To validate the kinetic model parameters extracted from the 8-day short duration study with an high initial VCD of 10 × 10Citation6 cells/mL at different constant temperatures, independent shake flask runs inoculated with 0.6 × 10Citation6 cells/mL VCD were performed under different TS conditions for a 14-day full duration fed-batch runs with the experimental data as shown in dots in . The 6 conditions we chose covered different shifted temperatures and at different days included multiple temperature shift conditions, which were around common process operating ranges ( and ). Using kinetic parameters determined from the 8-day short duration study, the models (1) to (8) were used to compute the VCD and expressed therapeutic protein profiles of CHO1. The lines shown in represent predicted results. The predicted data matched experimental data well for both VCD and titer profiles (), indicating that the kinetic model parameters extracted from the 8-day short duration study at different constant temperatures with a higher initial VCD were valid and could be used for the prediction of cell culture profiles obtained from the independent fed-batch runs under different TS conditions using a typical initial VCD for a 14-day full duration. This 8-day duration method was further supported by a recent study, which reported that the cell culture profiles under the high-seed conditions at 10 × 10Citation6 cells/mL with a short 12-day duration were similar to those under the low-seed conditions at 0.4 × 10Citation6 cells/mL with a long 17-day duration.Citation51
Table 2. Predicted mAb1 titer (normalized) for different TS conditions via kinetic models from the 8-day short duration fed-batch study, assumed that the GS CHO1 cell cultures would be inoculated at a typical VCD of 0.6 × 10Citation6 cells/mL with an initial temperature of 36.5 °C, then downshift to different temperatures for a 14-day full duration. The validated titer (normalized) values were from the GS CHO1 cell cultures described in . The 8 conditions with bold produced high titer values ≥97%.
Figure 2. CHO1 model validation for VCD (A), titer (B) and specific productivity (C) in fed-batch production 250-mL shake flasks with TS from 36.5 to 33 or 34 °C on different days using a typical initial VCD of 0.6 × 10Citation6 cells/mL for a 14-day full duration. The dots denote the experimental data with the average of duplicate runs (n = 2) and the lines represent the computing results using the kinetic models from the 8-day short-duration study.
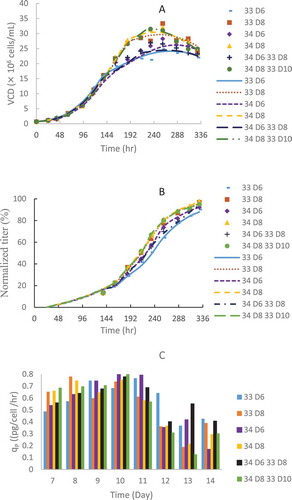
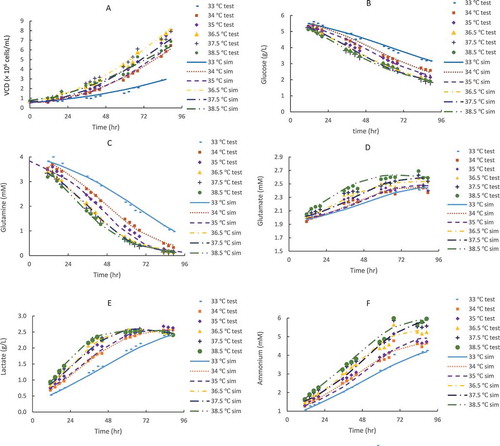
Figure 3. CHO2 cell growth (A) and metabolite profiles: glucose (B), glutamine (C), glutamate (D), lactate (E) and ammonium (F) in batch production 5-L bioreactors at different constant temperatures of 33, 34, 35, 36.5, 37.5 and 38.5 ºC with an initial typical VCD of 0.6 × 10Citation6 cells/mL for a 4-day short duration. The dots denote the experimental data (n = 1) and the lines represent the simulation results.
In addition, the peak qP values were between 0.6 and 0.8 pg/cell/hr for two experiments with 8-day short duration and 14-day full duration, respectively ( and ). The lower temperature resulted in a higher final qP on day8 for the 8-day short duration runs (), while the lower TS at earlier shift day resulted in the higher final qP on day13-14 for the 14-day full duration runs (). Therefore, the qP values at different days from a full 14-day duration run with different TS conditions were in agreement with the qP trend from the 8-day short duration method at different constant temperatures. In addition, the kinetic parameters for other nutrients and metabolites (glutamine, glutamate, glucose, lactate, and ammonium) were verified with the independent 14-day full duration fed-batch run (data not shown).
Because the final titer is a crucial indicator for TS optimization, lists the predicted titer on day 14 harvest based on 31 different TS conditions via kinetic models (1) – (8). These designed TS conditions including the temperature shift occurs on different time points, via different steps, and to different temperatures, which should represent typical TS conditions that could be applied for bioprocess development. Six TS conditions were validated by experiments, which showed less than 3% titer difference between the predicted and validated values (). Based on the model calculation, a day-10 shift from 36.5 to 33°C resulted in the highest titer (), which was set as 100% normalized titer in this study.
The top productivity TS conditions could be screened based on the normalized predicted titer ≥ 97% (). Thus, 8 TS conditions were shortlisted as candidates with high titers (≥ 97%), while most of them included a temperature shift to 33 – 35 ºC between day8 – day10. Instead of testing all the 31 TS conditions, this modeling method allowed us to narrow the high titer TS conditions to only 8.
Since temperature would have an effect on expressed therapeutic protein quality, the multi-step TS conditions in and provided a choice to reach a similar protein titer at various temperatures, which may be employed to optimize the protein quality with more options. The application of kinetic modeling for the prediction of final titer under different TS conditions provided an efficient methodology for screening an optimal TS strategy, instead of testing all possible TS conditions by cell culture experiments.
Probably due to the complexity of process development and process characterization, few reports on multiple temperature shift conditions exist in literature. In this study, some experimental and simulation data were presented under multiple temperature shift conditions for both CHO1 and CHO2, which produced similar titer and VCD profiles compared to top performance conditions with only one temperature shift (, and ). Nonetheless, we did find one patent that reported that 2 or more TS conditions resulted in better cell culture performance with higher cell viability and final titer than a condition at constant 37 °C or a single TS condition.Citation28
Figure 4. CHO2 model validation for cell growth (A) and metabolites: glucose (B), glutamine (C), glutamate (D), lactate (E) and ammonium (F) in fed-batch production 5-L bioreactors (n = 3) with TS from 36.5 to 35 °C on day4 using an initial typical VCD of 0.6 × 10Citation6 cells/mL for a 14-day full duration. The dots denote the experimental data for a 14-day full duration and the lines represent the computing results for first 10-day duration using the kinetic models from the 4-day short duration study.
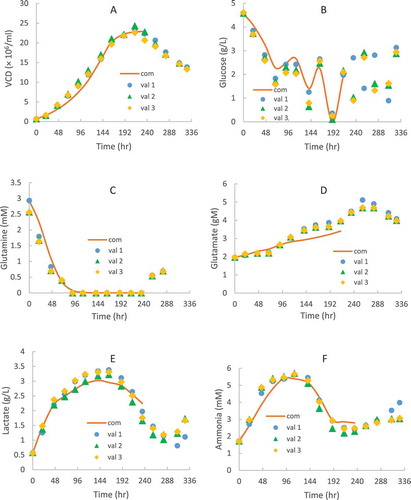
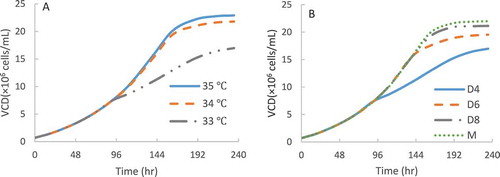
Figure 5. VCD profiles prediction of CHO2 at different TS conditions with a typical initial VCD of 0.6 × 10Citation6 cells/mL: TS from 36.5 °C to 35, 34 and 33 °C on day 4 (A); TS from 36.5 °C to 33 °C on day 4, day 6 and day 8 (B). M represents a multiple temperature shifting steps: TS from 36.5 °C to 35 °C on day 4, then to 34 °C on day 6, and finally to 33°C on day 8. The lines represent the computational prediction results using the kinetic models from the 4-day short-duration study.
Development of a 4-day short duration batch method for the study of different temperatures on cell growth and metabolites by DG44 CHO2 cell line for mAb2 production
Model development and data analysis
The 4-day short duration batch runs with a typical initial VCD of 0.6 × 10Citation6 cells/mL included only growth phase with little protein production (). The cell growth and metabolite profiles are presented in . The model results matched well with the experimental data at different constant temperature conditions ranged from 33 to 38.5 °C (). A large increase in the growth rate (µmax) was observed when the temperature increased from 33 to 34 °C, while the growth rates were similar with a wide temperature range from 34 to 38.5 °C (). A different trend was observed for the death rates (kd), which linearly increased with temperature increase from 33 to 35 °C, while the death rates were similar when the temperature was 36.5 to 38.5 °C (). However, there was a large increase in the death rate between 35 and 36.5 °C, over a small 1.5 °C difference ().
Table 3. Kinetic parameters for cell growth and lactate calculated from the 4-day short duration batch study with DG44 CHO2 cell line.
It should be emphasized that small temperature differences such as one degree may make large differences on cell culture performance. We observed a large difference in the growth rate (µmax) even between 34 and 35 °C (), while the death date (kd) at 35 °C was about half of that at 36.5 °C for GS CHO1 (). A large difference in the growth rate (µmax) was observed between 33 and 34 °C for DG44 CHO2 (). Therefore, many temperature studies reported with only one or two TS conditions may not be sufficient to find an optimal TS condition with good understanding the effect of TS on cell culture performance for their culture processes.Citation12,Citation14,Citation19,Citation30,Citation31,Citation33 Thus, in comparison to traditional studies with 1–2 TS conditions, there are advantages to developing short duration methods with kinetic model tools for the systematic study of temperature effects on cell culture performance.
Model validation, prediction and application
To validate the kinetic model parameters extracted from the 4-day short duration batch study at different constant temperatures, independent 5-L bioreactors inoculated with 0.6 × 10Citation6 cells/mL initial VCD of CHO2 cell line were performed using one TS condition in triplicate from 36.5 to 35 °C on day4 for a full 14-day duration. The experimental data is shown in dots in . We note that only one TS condition was used in this study, and the validation would be more powerful if two or more dynamic TS conditions were tested and validated. Using kinetic parameters determined from the 4-day short duration study, the models (1) to (8) were used to compute the VCD and metabolite profiles of CHO2 cell line with the lines representing predicted results (). The predicted data matched experimental data well for the first 10 days, including growth and stationary phases for both VCD and metabolites (), which indicated that the extracted kinetic model parameters from the 4-day short duration batch study were valid and could be used for the prediction of cell culture profiles obtained from the independent fed-batch runs for the first 10 days of a full 14-day duration. This is in agreement with other reports that batch culture can be used for kinetic modeling of fed-batch culture, as long as nutrients are not depleted.Citation52 However, the kinetic model parameters, extracted from the 4-day batch study with growth phase only, may not be used to predict the fed-batch death phase of last 4 days with nutrient limitation and/or toxic metabolite accumulation for the independent 14-day fed-batch run.
The kinetic models built from the 4-day batch experiment using CHO2 at consistent temperatures were applied to predict the cell growth performance up to 10 days at various TS conditions (), which would substantially reduce lab experiments. The VCD profiles of the CHO2 cell line were computed via kinetic models at different TS conditions in a fed-batch mode. It indicated that a higher shift in temperature () and later TS date () were beneficial for biomass accumulation for the CHO2 cell line. The multi-step condition on day 4, 6 and 8 at different temperatures was also capable of achieving a similar VCD to the condition with a TS on day 8 ().
Development of a 2-day short duration batch method for the study of different temperatures on mAb2 productivity and quality by DG44 CHO2 cell line
Since the 4-day short-duration batch method, using CHO2 cell line inoculated at a VCD of 0.6 × 10Citation6 cells/mL for early cell growth only, does not include mAb2 production and quality attributes, a 2-day batch duration method, using CHO2 cell line inoculated at a higher VCD of 10 × 10Citation6 cells/mL, was developed to obtain the expressed therapeutic protein data in the end of day 2 (). Therefore, no model could be developed with one data point for the 2-day duration study. Although similar values were observed for specific productivity, the size-exclusion chromatography (SEC) and charge variant profiles from 36.5 to 38.5 °C in the 2-day short batch duration study (), we observed that the qP () and acidic peak () values increased with temperature from 33 to 36.5 °C, while high molecular weight (HMW) () and basic peak () values decreased with temperature from 33 to 36.5 °C. The same trends from the 2-day study from 33 to 36.5 °C () were confirmed using 14-day full duration 5-L fed-batch runs with different TS strategies from 36.5 to 33.5 and 32 °C on day5 (). Therefore, the trend of specific protein productivity and quality attributes from the 2-day short duration study was verified by an independent 14-day full fed-batch duration experiment. The specific protein productivity and quality attribute data generated via the 2-day short duration method provide useful knowledge for process development to predict full duration fed-batch runs.
Figure 6. Effect of different constant temperatures on CHO2 for mAb2 specific productivity (A) and quality attributes: SEC profile (HMW: B) and charge variants (Acidic: C, Basic: D) in batch 125-mL shake flasks with a high initial VCD of 10 × 10Citation6 cells/mL for a 2-day short duration (n = 2).
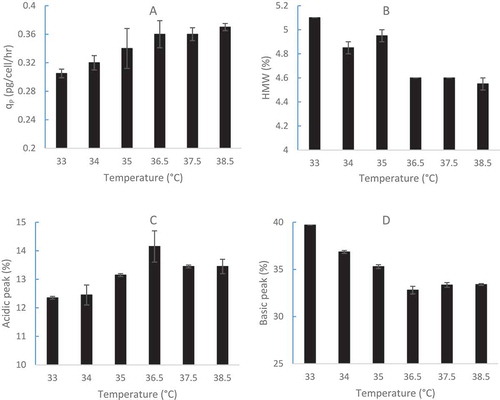
Figure 7. Effect of different TS conditions on mAb2 specific productivity (qP values were calculated from day6 to day10) (A) and final D14 quality attributes: SEC profile (HMW: B) and charge variants (Acidic: C, Basic: D) in fed-batch production 5-L bioreactors (n = 2) with an initial temperature of 36.5 °C, then reduced to 35, 33.5 or 32 °C from day5 to day14 using a typical initial VCD of 0.6 × 10Citation6 cells/mL for a 14-day full duration.
The effects of temperature on productivity and quality attributes are cell line and protein specific, which may also have interactions with other cell culture parameters. We found that overall productivity (KP) increased with decreasing temperature from 36.5 to 32 °C for mAb1 production by GS CHO1 cell line (). Using different GS CHO cell lines, Goey et alCitation31 reported similar qP observed between 36.5 and 33 °C, Sou et alCitation53 reported qP increased by 25% with a temperature downshift to 32 °C, and Xu et al.Citation54 reported that the productivity decreased after temperature downshift in their study. Mason et al.Citation55 reported that some of GS CHO cell lines produced higher qP and some produced lower qP under TS conditions (compared to that at 36.5 °C) dependent on different cell lines and TS dates. We found that qP decreased with temperature decrease from 36.5 to 32 °C for mAb2 production by DG44 (dhfr−) CHO2 cell line ( and ), while most other publications showed that qP increased with decreasing temperature for production of different proteins by different DG44 CHO cell lines.Citation11,Citation16,Citation56 Aghamohseni et al.Citation29 reported mixed results on qP with DUXB (dhfr−) CHO cells, depending on shift timing and glutamine concentrations. Therefore, the impact of temperature on qP is cell line dependent regardless of GS or DG44 (dhfr−) CHO cells. For quality attributes, we found that HMW increased with TS to lower temperatures (), which is in agreement with Jing et al.Citation23 Kassermayer et al.Citation16 reported that HMW increased with decrease of TS when culture pH is high, while HMW decreased with decrease of TS when culture pH is low for the same CHO cell line. Therefore, the effect of TS conditions on HMW is also culture pH dependent. In addition to pH, more cell culture parameters, including osmolality, agitation, and anti-foam, were found to interact with TS on HMW formation.Citation33 We reported that the lower TS conditions resulted in decreased acidic species () and increased basic species (), which are in agreement with literature.Citation25 Kishishita et al.Citation24 reported that lower TS conditions produced lower acidic species. In a review paper, Chung et al.Citation57 also summarized that TS generally decreases acidic species during CHO cell culture.
Our observation that the short-duration method with CHO2 in as few as 2 days can be used for the trend evaluation of quality attributes ( and ) is very useful. Although we did not measure quality attributes in the 8-day short-duration study for CHO1 (), the 8-day short-duration method, having a 4-fold longer duration than the 2-day method, could be used for quality evaluation for CHO1 inoculated with the same VCD 10 × 10Citation6 cells/mL as that in the 2-day short-duration study.
Discussion
To the best of our knowledge, a short-duration method with kinetic modeling has not been reported as an effective optimization tool for the study of temperature on CHO cell culture. Here, we report three different short-duration culture methods from 2–8 days instead of full 14-day duration of fed-batch cultures using two industrially relevant CHO cell lines for production of two different mAbs. The first study used an 8-day short duration method for fed-batch production of mAb1 by GS CHO1 cell line with a high initial VCD of 10 × 10Citation6 cells/mL. Here the 8-day fed-batch duration method that included growth, stationary and death phases () was used to build kinetic models on cell growth, metabolites and titer profiles at different constant temperatures. Those kinetic models were verified using the full duration of 14-day fed-batch culture with a typical initial VCD of 0.6 × 10Citation6 cells/mL (). The second study used a 4-day short duration method for batch growth with a typical initial VCD of 0.6 × 10Citation6 cells/mL of DG44 CHO2 cell line (). The kinetic models of cell growth and metabolites from the 4-day study were verified and able to predict first 10-day profiles of the full 14-day fed-batch culture (). The third study used a 2-day short duration method for the batch production of mAb2 by CHO2 DG44 cell line with a high initial VCD of 10 × 10Citation6 cells/mL. Only one sample for each of the different temperature conditions was collected for qP and quality attributes in the end of the 2-day short duration study (), which were verified by full duration of a 14-day fed-batch culture with a typical initial VCD of 0.6 × 10Citation6 cells/mL under different TS conditions (). Both the 4-day and 8-day short duration methods were used for simulation and prediction of cell culture performance under many different TS conditions ( and ).
We also found that a minor difference in temperature (1–1.5 °C) caused significant differences in cell culture performance such as cell growth rates (34 vs 35 °C in for GS CHO1; 33 vs 34 °C in for DG44 CHO2), death rates (32 vs 33 °C and 35 vs 36.5 °C in for GS CHO1; 35 vs 36.5 °C in for DG44 CHO2), productivity (33 vs 34 °C in G for GS CHO1), and quality attributes ( and for DG44 CHO2). Therefore, we believe that results for a few TS conditions, as found in many literature reports, may not give complete understanding of the effect of temperature for specific CHO cell cultures.
In summary, our short-duration culture methods with kinetic modeling tools may be used for effective TS optimization to achieve the best profiles for cell growth, metabolites, titer and quality attributes. Although only three short-duration methods were tested with two CHO cell lines for two mAb production, the same or different short-duration methods using similar strategies may be applied for different hosts, including both microbial and other mammalian cells, for production of different therapeutic proteins and other products.
Materials and methods
Cell culture experiments
Cell line and cell culture conditions
For the 8-day short duration experiments, GS CHO1 cells were cultured in 250-ml shake flasks containing a proprietary chemically defined basal media with initial volume of 80 mL for mAb1 production. Duplicate shake flasks were inoculated with a high VCD of 10 × 10Citation6 cells/mL and cultured at constant temperatures of 32, 33, 34, 35 and 36.5 °C for 8 days. For independent 14-day full duration fed-batch experiments to verify the 8-day short duration data, duplicate 250-mL shake flasks were inoculated with a typical VCD of 0.6 × 10Citation6 cells/mL of CHO1 in the same basal medium as described above and cultured with an initial temperature of 36.5 °C, then reduced to different temperatures for 14 days, as described in the results section. All shake flasks were incubated on a shaker at 150 rpm and 6% CO2. Daily addition of a proprietary chemically defined feed medium was started when cells reached a predetermined VCD. Additional glucose was supplied to maintain the concentration range.Citation4
For the 4-day short duration experiments, DG44 CHO2 cells were cultured in 5-L Sartorius glass bioreactors with Finesse control systems containing a proprietary chemically defined basal media with an initial volume of 3.5 L for mAb2 production. All bioreactors (n = 1) were inoculated with a typical VCD of 0.6 × 10Citation6 cells/mL at constant culture temperatures of 33, 34, 35, 36.5, 37.5, and 38.5 °C for 4 days. The agitation rate was fixed at 240 rpm, the pH was controlled at pH 7.1 and the dissolved oxygen was set to 50% saturation. For independent 14-day full duration fed-batch experiments to verify the 4-day short duration data, 5-L bioreactors in triplicate were inoculated at 0.6 × 10Citation6 cells/mL VCD with an initial temperature of 36.5 °C, then reduced to different temperatures as described in the results section. Daily addition of a proprietary chemically defined feed medium was started when cells reached a predetermined VCD for the full duration 5-L fed-batch runs. Additional glucose was supplied to maintain the concentration range.Citation4
For the 2-day short duration batch experiments, to study the temperature effect on mAb2 productivity and quality attributes, CHO2 cells were cultured in duplicate 250-ml shake flasks containing a proprietary chemically defined basal media with an initial volume of 80 mL on an incubator shaker at 150 rpm and 6% CO2. All shake flasks were inoculated with 10 × 10Citation6 cells/mL VCD and at constant temperatures of 33, 34, 35, 36.5, 37.5, and 38.5 °C for 2 days. For independent 14-day full duration fed-batch experiments to verify the 2-day short duration data, duplicate 5-L bioreactors were run using the same cell culture process as described above for production of mAb2 by DG44 CHO2 cell line.
Cell culture in-process assays
VCD and cell viability were quantified off-line using a Vi-CELL XR automatic cell counter (Beckman Coulter). Glucose, glutamine, glutamate, lactate, and ammonia were quantified with a CEDEX Bio HT analyzer (Roche). A Protein A HPLC was used to measure the protein titer. The highest protein titer was set as 100% normalized titer in this study. The specific productivity (qP) was calculated according to the method described previously.Citation5 For bioreactor samples, off-line pH, pCO2 and pO2 were detected using a Bioprofile pHOx analyzer (Nova Biomedical).
Protein quality attribute assays
SEC was performed using a Tosoh TSK G3000SWxl column, 7.8 cm × 30 cm × 5 μm, with an isocratic gradient monitored at 280 nm on a Waters Alliance HPLC system (Milford, MA) equipped with a temperature controlled autosampler and Waters 2996 PDA detector.
Charge variants were assayed by imaged capillary isoelectric focusing, which was performed on a Protein Simple iCE3 instrument with an Alcott 720 NV autosampler (San Jose, CA). Samples were mixed with appropriate pI markers, ampholytes, and urea and injected into a fluorocarbon-coated capillary cartridge. A high voltage was applied and the charged variants migrated to their respective pI. A UV camera captured the image at 280 nm. The main peak was identified and the peaks that migrated into the acidic range and basic range were summed, quantitated, and reported as relative percent area.
Model development
Intracellular metabolism involves hundreds of chemicals and enzymatic reactions, many of which are not mechanistically understood.Citation42 It is not a trivial task to take all these reactions into consideration. Thus, an unstructured kinetic approach was used to focus on nutrients, such as carbohydrates and amino acids, which contribute to biomass accumulation, and toxic metabolites that disturb the desired metabolic pathways. In this study, glucose, glutamine and glutamate were regarded as the representative nutrients, while lactate and ammonia were regarded as the representative toxic metabolites.Citation38 We applied Monod-based models including the main influential detected substrates and metabolites to describe cell growth.Citation58,Citation59
Where μG is the specific growth rate; μd is the specific death rate; μmax is the maximum specific cell growth rate; kd is the maximum specific cell death rate; X is the viable cell density (VCD), S is the concentration of the limiting substrate, P is the concentration of toxic metabolites; KIS, KIP, KDS and KDP are the saturation constants.
Glucose is the main carbon and energy source, following the kinetic process described by Xing et al.Citation38
Where, the subscript Glc denotes glucose; indicates the glucose consumption associated with cell growth; aGlc denotes the glucose consumption to maintain cell viability. Equation (2-a) works for the batch mode.
Considering the intermittent feeding of glucose during a fed-batch mode, mass balance of glucose in the reactor is given by
Where, two adjacent measurement are taken at t1 and t2; CGlc-i is the concentration of feeding glucose; V is the bulk solution volume; Vi is the volume of added corresponding nutrient at the ith time. is the total glucose added into the bioreactor.
Though glutamine and glutamate are included in the media, they can also be generated from other substrates catalyzed by different enzymes within the CHO cells, and then entered into the central metabolism.Citation60 Their kinetic processes can be expressed as
Where the subscript Gln and Glu denote glutamine and glutamate, respectively; Ci or Cj is the i-th or j-th chemical that will generate glutamine or glutamate; and
indicate the glutamine and glutamate consumption associated with cell growth; aGln and aGlu denote the glutamine and glutamate consumption to maintain cell viability; k is rate constant and K is saturation number in Michaelis-Menten model.
With a well-developed chemically defined medium, there are typically sufficient nutrients to supply glutamine and glutamate. Thus, their generation can be expected approximately stable during the cell culture process, that is,
Where, bAmino is a constant.
Substituting (5) to (3-a) and (4-a) leads to
Where dGln and dGlu are constants that can be either negative or non-negative. Equations (4-a) and (4-b) work for the batch mode.
Similarly as glucose, when taking consideration of the daily feed of glutamine and glutamate during a fed-batch mode, mass balances yield
Where, CGln-i and CGlu-i are the concentrations of glutamine and glutamate concentration daily fed to the bioreactor.
As known traceable metabolites, lactate and ammonia have known effects on cells.Citation6,Citation61 They are generated from the central metabolism to support cell growth and maintain cell viability, while being consumed during cell culture.Citation6,Citation60–Citation62 Thus, the process can be expressed as
Where a and b indicate the metabolite produced to maintain cell survival and associated with cell growth, respectively. The metabolites can be consumed during the cell culture, catalyzed by enzymes such as lactate dehydrogenase or transaminases.
To characterize the therapeutic protein production process, various substrates and toxic metabolites should be considered.Citation6,Citation63,Citation64 Organized in a comprehensive Michaelis-Menten structure, the kinetic equation can be expressed asCitation65
Where QTP is the specific therapeutic protein production rate; KP is the maximum specific protein production rate; KS and KP are saturation constants.
Variables and constants extracted from modeling
Integral cell culture kinetic parameters were extracted from the short duration cell culture experiments, including cell growth, cell death, metabolite concentration change, and therapeutic protein production. The program OdexLims in Excel (2013) coded with Visual Basic for Applications was used to calculate the parameters.
Though KI, KD, and K denoting the enzyme binding affinities should theoretically respond to temperature change, our preliminary investigation using the equations (1) – (8) revealed that these parameters kept relatively steady (<10% variation) within the temperature range studied. Therefore, the KI, KD, and K values were considered approximately constant in this study. This provided an intuitional comparison of μd, YF, k and KP values to describe the temperature effect on cell growth, cell metabolism and titer. Glucose was not a limiting substrate indicated by a small calculated KIGlc value (~10–Citation3 g/L). This agrees with the feeding strategy of sufficient glucose supplement.
Abbreviations
Disclosure of potential conflicts of interest
No potential conflicts of interest were disclosed.
Acknowledgments
Thanks to Yuanzhen Wang and Jun Tian for supporting the lab experiments. Thanks to Kyle McHugh, Alan Shupe, Christopher Oliveira, and Henrik Andersen for their review and comments on this manuscript.
Related Research Data
References
- Dangi AK, Sinha R, Dwivedi S, Gupta SK, Shukla P. Cell line techniques and gene editing tools for antibody production: A review. Front Pharmacol. 2018;9:630. doi:10.3389/fphar.2018.00529.
- Li F, Vijayasankaran N, Shen AY, Kiss R, Amanullah A. Cell culture processes for monoclonal antibody production. mAbs. 2010;2:466–477. doi:10.4161/mabs.2.5.12720.
- Wurm FM. CHO Quasispecies—implications for Manufacturing Processes. Processes. 2013;1:296–311. doi:10.3390/pr1030296.
- Xu J, Jin M, Song H, Huang C, Xu X, Tian J, Qian N-X, Steger K, Lewen NS, Tao L, et al. Brown drug substance color investigation in cell culture manufacturing using chemically defined media: A case study. Process Biochem. 2014;49:130–139. doi:10.1016/j.procbio.2013.10.015.
- Xu J, Rehmann MS, Xu X, Huang C, Tian J, Qian NX, Li ZJ. Improving titer while maintaining quality of final formulated drug substance via optimization of CHO cell culture conditions in low-iron chemically defined media. mAbs. 2018;10:488–499. doi:10.1080/19420862.2018.1433978.
- Zhu J. Mammalian cell protein expression for biopharmaceutical production. Biotechnol Adv. 2012;30:1158–1170. doi:10.1016/j.biotechadv.2011.08.022.
- Al-Fageeh MB, Smales CM. Control and regulation of the cellular responses to cold shock: the responses in yeast and mammalian systems. Biochem J. 2006;397:247–259. doi:10.1042/BJ20060166.
- Huang CJ, Lin H, Yang X. Industrial production of recombinant therapeutics in Escherichia coli and its recent advancements. J Ind Microbiol Biotechnol. 2012;39:383–399. doi:10.1007/s10295-011-1082-9.
- Xu J, Qian Y, Skonezny PM, You L, Xing Z, Meyers DS, Stankavage RJ, Pan S-H, Li ZJ. Reduction of N-terminal methionylation while increasing titer by lowering metabolic and protein production rates in E. coli auto-induced fed-batch fermentation. J Ind Microbiol Biotechnol. 2012;39:1199–1208. doi:10.1007/s10295-012-1127-8.
- Becerra S, Berrios J, Osses N, Altamirano C. Exploring the effect of mild hypothermia on CHO cell productivity. Biochem Eng J. 2012;60:1–8. doi:10.1016/j.bej.2011.10.003.
- Masterton RJ, Smales CM. The impact of process temperature on mammalian cell lines and the implications for the production of recombinant proteins in CHO cells. Pharm Bioprocess. 2014;2:49–61. doi:10.4155/pbp.14.3.
- Fan L, Zhao L, Ye Z, Sun Y, Kou T, Zhou Y, Tan W-S. Effect of culture temperature on TNFR-Fc productivity in recombinant glutamine synthetase-chinese hamster ovary cells. Biotechnol Lett. 2010;32:1239–1244. doi:10.1007/s10529-010-0318-5.
- Han YK, Koo TY, Lee GM. Enhanced interferon-β production by CHO cells through elevated osmolality and reduced culture temperature. Biotechnol Prog. 2009;25:1440–1447. doi:10.1002/btpr.234.
- Nam JH, Ermonval M, Sharfstein ST. The effects of microcarrier culture on recombinant CHO cells under biphasic hypothermic culture conditions. Cytotechnology. 2009;59:81–91. doi:10.1007/s10616-009-9196-x.
- Borys MC, Dalal NG, Abu-Absi NR, Khattak SF, Jing Y, Xing Z, Li ZJ. Effects of culture conditions on N-glycolylneuraminic acid (Neu5Gc) content of a recombinant fusion protein produced in CHO cells. Biotechnol Bioeng. 2010;105:1048–1057. doi:10.1002/bit.22644.
- Kaisermayer C, Reinhart D, Gili A, Chang M, Aberg PM, Castan A, Kunert R. Biphasic cultivation strategy to avoid Epo-Fc aggregation and optimize protein expression. J Biotechnol. 2016;227:3–9. doi:10.1016/j.jbiotec.2016.03.054.
- Torres M, Zúñiga R, Gutierrez M, Vergara M, Collazo N, Reyes J, Berrios J, Aguillon JC, Molina MC, Altamirano C, et al. Mild hypothermia upregulates myc and xbp1s expression and improves anti-TNFα production in CHO cells. PLoS ONE. 2018;13. doi:10.1371/journal.pone.0194510.
- Sung KY, Sun OH, Gyun ML. Enhancing effect of low culture temperature on specific antibody productivity of recombinant Chinese hamster ovary cells: clonal variation. Biotechnol Prog. 2004;20:1683–1688. doi:10.1021/bp049847f.
- Yoon SK, Kim SH, Lee GM. Effect of low culture temperature on specific productivity and transcription level of anti-4-1BB antibody in recombinant Chinese hamster ovary cells. Biotechnol Prog. 2003;19:1383–1386. doi:10.1021/bp034051m.
- Kaufmann H, Mazur X, Fussenegger M, Bailey JE. Influence of low temperature on productivity, proteome and protein phosphorylation of CHO cells. Biotechnol Bioeng. 1999;63:573–582.
- Jorjani P, Ozturk SS. Effects of cell density and temperature on oxygen consumption rate for different mammalian cell lines. Biotechnol Bioeng. 1999;64:349–356.
- Weidemann R, Ludwig A, Kretzmer G. Low temperature cultivation - A step towards process optimisation. Cytotechnology. 1994;15:111–116.
- Jing Y, Borys M, Nayak S, Egan S, Qian Y, Pan SH, Li ZJ. Identification of cell culture conditions to control protein aggregation of IgG fusion proteins expressed in Chinese hamster ovary cells. Process Biochem. 2012;47:69–75. doi:10.1016/j.procbio.2011.10.009.
- Kishishita S, Nishikawa T, Shinoda Y, Nagashima H, Okamoto H, Takuma S, Aoyagi H. Effect of temperature shift on levels of acidic charge variants in IgG monoclonal antibodies in Chinese hamster ovary cell culture. J Biosci Bioeng. 2015;119:700–705. doi:10.1016/j.jbiosc.2014.10.028.
- Zhang X, Sun YT, Tang H, Fan L, Hu D, Liu J, Liu X, Tan W-S. Culture temperature modulates monoclonal antibody charge variation distribution in Chinese hamster ovary cell cultures. Biotechnol Lett. 2015;37:2151–2157. doi:10.1007/s10529-015-1904-3.
- Goey CH, Bell D, Kontoravdi C. Mild hypothermic culture conditions affect residual host cell protein composition post-Protein A chromatography. mAbs. 2018;10:476–487. doi:10.1080/19420862.2018.1433977.
- Rodriguez J, Spearman M, Tharmalingam T, Sunley K, Lodewyks C, Huzel N, Butler M. High productivity of human recombinant beta-interferon from a low-temperature perfusion culture. J Biotechnol. 2010;150:509–518. doi:10.1016/j.jbiotec.2010.09.959.
- Schilling BM, Gangloff S, Kothari D, Leister K, Matlock L, Zegarelli SG, Joosten CE, Basch JD, Sakhamuri S, Lee SS. Product quality enhancement in mammalian cell culture processes for protein production. United States Patent 2008; US 7,332,303 B2.2008
- Aghamohseni H, Spearman M, Ohadi K, Braasch K, Moo-Young M, Butler M, Budman HM. A semi-empirical glycosylation model of a camelid monoclonal antibody under hypothermia cell culture conditions. J Ind Microbiol Biotechnol. 2017;44:1005–1020. doi:10.1007/s10295-017-1926-z.
- Chen C, Le H, Follstad B, Goudar CT. A comparative transcriptomics workflow for analyzing microarray data from CHO cell cultures. Biotechnol J. 2018;13:1700228. doi:10.1002/biot.v13.3.
- Goey CH, Tsang JMH, Bell D, Kontoravdi C. Cascading effect in bioprocessing—the impact of mild hypothermia on CHO cell behavior and host cell protein composition. Biotechnol Bioeng. 2017;114:2771–2781. doi:10.1002/bit.26437.
- Lee JH, Reier J, Heffner KM, Barton C, Spencer D, Schmelzer AE, Venkat R. Production and characterization of active recombinant human factor II with consistent sialylation. Biotechnol Bioeng. 2017;114:1991–2000. doi:10.1002/bit.26317.
- Paul AJ, Handrick R, Ebert S, Hesse F. Identification of process conditions influencing protein aggregation in Chinese hamster ovary cell culture. Biotechnol Bioeng. 2018;115:1173–1185. doi:10.1002/bit.26534.
- Valente KN, Levy NE, Lee KH, Lenhoff AM. Applications of proteomic methods for CHO host cell protein characterization in biopharmaceutical manufacturing. Curr Opin Biotechnol. 2018;53:144–150. doi:10.1016/j.copbio.2018.01.004.
- Huang Z, Lee DY, Yoon S. Quantitative intracellular flux modeling and applications in biotherapeutic development and production using CHO cell cultures. Biotechnol Bioeng. 2017;114:2717–2728. doi:10.1002/bit.26384.
- Kyriakopoulos S, Ang KS, Lakshmanan M, Huang Z, Yoon S, Gunawan R, Lee D-Y. Kinetic modeling of mammalian cell culture bioprocessing: the quest to advance biomanufacturing. Biotechnol J. 2018;13. doi:10.1002/biot.v13.3.
- Liu S. Bioprocess engineering: kinetics, sustainability, and reactor design. Amsterdam: Elsevier; 2016.
- Xing Z, Bishop N, Leister K, Li ZJ. Modeling kinetics of a large-scale fed-batch CHO cell culture by markov chain monte carlo method. Biotechnol Prog. 2010;26:208–219. doi:10.1002/btpr.284.
- López-Meza J, Araíz-Hernández D, Carrillo-Cocom LM, López-Pacheco F, Rocha-Pizaña MR, Alvarez MM. Using simple models to describe the kinetics of growth, glucose consumption, and monoclonal antibody formation in naive and infliximab producer CHO cells. Cytotechnology. 2016;68:1287–1300. doi:10.1007/s10616-015-9889-2.
- Liu S. A review on protein oligomerization process. Int J Precis Eng Manuf. 2015;16:2731–2760. doi:10.1007/s12541-015-0349-x.
- Tang P, Xu J, Oliveira CL, Li ZJ, Liu S. A mechanistic kinetic description of lactate dehydrogenase elucidating cancer diagnosis and inhibitor evaluation. J Enzyme Inhib Med Chem. 2017;32:564–571. doi:10.1080/14756366.2016.1275606.
- Hefzi H, Ang KS, Hanscho M, Bordbar A, Ruckerbauer D, Lakshmanan M, Orellana CA, Baycin-Hizal D, Huang Y, Ley D, et al. A consensus genome-scale reconstruction of Chinese hamster ovary cell metabolism. Cell Syst. 2016;3:434–443. e8. doi:10.1016/j.cels.2016.10.020.
- Dermol J, Miklavčič D. Mathematical models describing chinese hamster ovary cell death due to electroporation in vitro. J Membr Biol. 2015;248:865–881. doi:10.1007/s00232-015-9825-6.
- Jandt U, Platas Barradas O, Pörtner R, Zeng AP. Synchronized mammalian cell culture: part II-population ensemble modeling and analysis for development of reproducible processes. Biotechnol Prog. 2015;31:175–185. doi:10.1002/btpr.2006.
- Klein T, Heinzel N, Kroll P, Brunner M, Herwig C, Neutsch L. Quantification of cell lysis during CHO bioprocesses: impact on cell count, growth kinetics and productivity. J Biotechnol. 2015;207:67–76. doi:10.1016/j.jbiotec.2015.04.021.
- Pybus LP, Dean G, West NR, Smith A, Daramola O, Field R, Wilkinson SJ, James DC. Model-directed engineering of “difficult-to-express” monoclonal antibody production by Chinese hamster ovary cells. Biotechnol Bioeng. 2014;111:372–385. doi:10.1002/bit.25116.
- Trummer E, Fauland K, Seidinger S, Schriebl K, Lattenmayer C, Kunert R, Vorauer-Uhl K, Weik R, Borth N, Katinger H, et al. Process parameter shifting: part II. Biphasic cultivation - A tool for enhancing the volumetric productivity of batch processes using Epo-Fc expressing CHO cells. Biotechnol Bioeng. 2006;94:1045–1052. doi:10.1002/bit.20958.
- Bollati-Fogolín M, Forno G, Nimtz M, Conradt HS, Etcheverrigaray M, Kratje R. Temperature reduction in cultures of hGM-CSF-expressing CHO cells: effect on productivity and product quality. Biotechnol Prog. 2005;21:17–21. doi:10.1021/bp049825t.
- Kou TC, Fan L, Ye ZY, Zhou Y, Liu XP, Zhao L, Tan W-S. Process analysis of reduced specific productivity of TNFR-Fc in Chinese hamster ovary cells at high cell density. Process Biochem. 2011;46:1492–1499. doi:10.1016/j.procbio.2011.04.001.
- Martínez VS, Buchsteiner M, Gray P, Nielsen LK, Quek LE. Dynamic metabolic flux analysis using B-splines to study the effects of temperature shift on CHO cell metabolism. Metab Eng Commun. 2015;2:46–57. doi:10.1016/j.meteno.2015.06.001.
- Yang WC, Lu J, Kwiatkowski C, Yuan H, Kshirsagar R, Ryll T, Huang Y-M. Perfusion seed cultures improve biopharmaceutical fed-batch production capacity and product quality. Biotechnol Prog. 2014;30:616–625. doi:10.1002/btpr.1884.
- Golabgir A, Gutierrez JM, Hefzi H, Li S, Palsson BO, Herwig C, Lewis NE. Quantitative feature extraction from the Chinese hamster ovary bioprocess bibliome using a novel meta-analysis workflow. Biotechnol Adv. 2016;34:621–633. doi:10.1016/j.biotechadv.2016.02.011.
- Sou SN, Sellick C, Lee K, Mason A, Kyriakopoulos S, Polizzi KM, Kontoravdi C. How does mild hypothermia affect monoclonal antibody glycosylation? Biotechnol Bioeng. 2015;112:1165–1176. doi:10.1002/bit.25524.
- Xu S, Hoshan L, Chen H. Improving lactate metabolism in an intensified CHO culture process: productivity and product quality considerations. Bioprocess and Biosyst Eng. 2016;39:1689–1702. doi:10.1007/s00449-016-1644-3.
- Mason M, Sweeney B, Cain K, Stephens P, Sharfstein ST. Reduced culture temperature differentially affects expression and biophysical properties of monoclonal antibody variants. Antibodies. 2014;3:253–271. doi:10.3390/antib3030253.
- Bedoya-López A, Estrada K, Sanchez-Flores A, Ramírez OT, Altamirano C, Segovia L, Miranda-Ríos J, Trujillo-Roldán MA, Valdez-Cruz NA, Coles JA. Effect of temperature downshift on the transcriptomic responses of Chinese hamster ovary cells using recombinant human tissue plasminogen activator production culture. PLoS ONE. 2016;11. doi:10.1371/journal.pone.0151529.
- Chung S, Tian J, Tan Z, Chen J, Lee J, Borys M, Li ZJ. Industrial bioprocessing perspectives on managing therapeutic protein charge variant profiles. Biotechnol Bioeng. 2018;115:1646–1665. doi:10.1002/bit.26587.
- Karra S, Sager B, Karim MN. Multi-scale modeling of heterogeneities in mammalian cell culture processes. Ind Eng Chem Res. 2010;49:7990–8006. doi:10.1021/ie100125a.
- Selişteanu D, Endrescu D, Georgeanu V, Roman M. Mammalian cell culture process for monoclonal antibody production: nonlinear modelling and parameter estimation. BioMed Res Int. 2015;2015: article ID 598721. doi:10.1155/2015/598721.
- Ahn WS, Antoniewicz MR. Towards dynamic metabolic flux analysis in CHO cell cultures. Biotechnol J. 2012;7:61–74. doi:10.1002/biot.201100052.
- Toussaint C, Henry O, Durocher Y. Metabolic engineering of CHO cells to alter lactate metabolism during fed-batch cultures. J Biotechnol. 2016;217:122–131. doi:10.1016/j.jbiotec.2015.11.010.
- Le H, Kabbur S, Pollastrini L, Sun Z, Mills K, Johnson K, Karypis G, Hu W-S. Multivariate analysis of cell culture bioprocess data–lactate consumption as process indicator. J Biotechnol. 2012;162:210–223. doi:10.1016/j.jbiotec.2012.08.021.
- Altamirano C, Paredes C, Cairó JJ, Gòdia F. Improvement of CHO cell culture medium formulation: simultaneous substitution of glucose and glutamine. Biotechnol Prog. 2000;16:69–75. doi:10.1021/bp990124j.
- Carrillo-Cocom LM, Genel-Rey T, Araíz-Hernández D, López-Pacheco F, López-Meza J, Rocha-Pizaña MR, Ramírez-Medrano A, Alvarez MM. Amino acid consumption in naïve and recombinant CHO cell cultures: producers of a monoclonal antibody. Cytotechnology. 2015;67:809–820. doi:10.1007/s10616-014-9720-5.
- Jedrzejewski PM, Del Val IJ, Constantinou A, Dell A, Haslam SM, Polizzi KM, Kontoravdi C. Towards controlling the glycoform: A model framework linking extracellular metabolites to antibody glycosylation. Int J Mol Sci. 2014;15:4492–4522. doi:10.3390/ijms15034492.