
 ?Mathematical formulae have been encoded as MathML and are displayed in this HTML version using MathJax in order to improve their display. Uncheck the box to turn MathJax off. This feature requires Javascript. Click on a formula to zoom.
ABSTRACT
Biotherapeutic drugs against tumor necrosis factor (TNF) are effective treatments for moderate to severe inflammatory bowel disease (IBD). Here, we evaluated CNTO 5048, an antimurine TNF surrogate monoclonal antibody (mAb), in a CD45RBhigh adoptive T cell transfer mouse colitis model, which allows examination of the early immunological events associated with gut inflammation and the therapeutic effects. The study was designed to quantitatively understand the effects of IBD on CNTO 5048 disposition, the ability of CNTO 5048 to neutralize pathogenic TNF at the colon under disease conditions, and the impact of dosing regimen on CNTO 5048 treatment effect. CNTO 5048 and TNF concentrations in both mice serum and colon homogenate were also measured. Free TNF concentrations in colon, but not in serum, were shown to correlate well with the colon pharmacodynamic readout, such as the summed histopathology score and neutrophil score. A minimal physiologically based pharmacokinetic (mPBPK) model was developed to characterize CNTO 5048 PK and disposition, as well as colon soluble TNF target engagement (TE). The mPBPK/TE model reasonably captured the observed data and provided a quantitative understanding of an anti-TNF mAb on its colon TNF suppression and therapeutic effect in a physiologically relevant IBD animal model. These results also provided insights into the potential benefits of using induction doses for the treatment of IBD patients.
Introduction
The phrase inflammatory bowel disease (IBD) is used to describe disorders that involve chronic inflammation of the digestive tract, and usually includes ulcerative colitis (UC) and Crohn’s disease (CD).Citation1 UC causes long-lasting inflammation and sores (ulcers) in the mucosa in the innermost lining of large intestine (colon) and rectum, while CD is characterized by inflammation of the lining of digestive tract (from the mouth to the rectum) and can affect all layers of the intestinal tissues. IBD can be debilitating and sometimes leads to life-threatening complications. Both UC and CD are complex disorders associated with multiple pathogenic factors, including environmental changes, genetics, gut microbiota and a broadly dysregulated innate and adaptive immune response.Citation1,Citation2 Tumor necrosis factor (TNF) is an essential mediator of inflammation in the gut, and its levels are markedly elevated in patients with UC or CD.Citation1 The introduction of TNF antagonist biotherapies, such as infliximab, adalimumab, golimumab and certolizumab pegol, as a treatment option has fundamentally altered the treatment paradigm in IBD.Citation3 These anti-TNF therapies are highly effective in the treatment of both UC and CD. They can lead to mucosal healing, reduce hospitalizations and surgeries, and improve patients’ quality of life.Citation4–Citation6
TNF is produced as a transmembrane protein and its extracellular domain is subsequently released via proteolytic cleavage to generate soluble TNF.Citation7 Soluble TNF at physiological concentrations was reported to exist as(at) a dynamic equilibrium between biological active homotrimer and inactive monomer conformations.Citation7 Anti-TNF therapies function via dose-dependent binding and neutralization of pathologic proinflammatory TNF activity in the gut. Both soluble and membrane-bound TNF can signal via TNF receptors I and II. However, etanercept, a TNF receptor II-Fc fusion protein that mainly binds to membrane TNF (mTNF) but not soluble TNF, was shown to be ineffective in the treatment of CD, showing that not all anti-TNF agents are equally effective.Citation6,Citation8,Citation9
The treatment regimens for most of the approved biologics for IBD include an initial short-term, high-dose (or more frequently dosed) induction period followed by a long-term, low-dose maintenance period.Citation3 Induction doses given in clinical situations are usually used as a high initial target clearing dose to neutralize locally (disease tissue) high targets. The mechanistic understanding of the rationale behind such induction doses for IBD is still lacking, and there have been questions on whether an induction dose regimen is necessary. These knowledge gaps highlight the importance of quantitative and holistic understanding of the mechanism of action and pharmacokinetic/pharmacodynamic (PK/PD) relationship of anti-TNF therapies at their tissue site of action.
Here, we conducted quantitative analysis of colon TNF suppression and treatment effects for CNTO 5048 in a mouse model of chronic colitis induced by adoptive T cell transfer. This animal model has been widely used to study IBD because it provides an opportunity to examine the early immunological events associated with gut inflammation and the therapeutic effects in preclinical models.Citation10
To quantitatively assess the effective concentration profiles of biotherapeutics at the tissue sites of action, the minimal physiologically based pharmacokinetic (mPBPK) model is a commonly used approach. The mPBPK model concept was first proposed by Cao and Jusko in 2012.Citation11,Citation12 A typical mPBPK model for a monoclonal antibody (mAb) is composed of a central compartment, tissue compartments and a lymph compartment connected by lymph flow. It inherits the key advantages of a whole-body PBPK model by using physiologically relevant PK parameters, but it is easier to implement as it lumps all tissues into two compartments (tight or leaky) based on their vascular endothelial structure. Furthermore, the model allows inclusion of additional compartments to assess any tissue of interest, usually the tissue site of action. With specific tissue PK of mAb and target dynamic data support, target-mediated drug disposition (TMDD) kinetics can be incorporated into central circulation or the specific tissue compartment of the mPBPK model.Citation13 We had previously applied mPBPK models to characterize the ability of an anti-IL-6 mAb to neutralize IL-6 in the joint lavage fluid in a mouse collagen-induced arthritis (CIA) modelCitation14 and an anti-IL-23 mAb to neutralize IL-23 in lesional skin of a psoriasis-like mouse model.Citation15 Here, a mPBPK model coupled with TMDD in both central circulation and colon was used to characterize the disposition kinetics of CNTO 5048, and to understand the impact of IBD on an anti-TNF mAb disposition, the ability of anti-TNF mAb to neutralize TNF at the colon and the potential mechanism behind utilization of induction dose regimens for treatment of IBD.
Results
Treatment effect of CNTO 5048 in the adoptive T cell transfer model of colitis
On Study Day 0, a total of 114 female SCID mice each received an intraperitoneal (IP) injection of ~ 4 ×10⁴ CD45RBhigh cells from female Balb/C donor mice, and these recipient mice were called “IBD mice”. Another group of female SCID mice (N = 30) did not receive the CD45RBhigh cells, and they served as the non-IBD controls (Group 1). Groups 1 mice were dosed with a single 10 mg/kg intravenous (IV) dose of CNTO 5048 on Day 21. Adoptive transfer of CD45RBhigh T cells induces colitis in the recipient mice approximately 4 weeks following the T cell transfer.Citation10 The IBD mice were randomized into five groups (Groups 2–6) based on body weight (BW) on Day 21. The Group assignments and dosing paradigm are summarized in . The different dosing regimens of CNTO 5048 were designed to investigate the dose-response relationship and potential effects of an induction dose of CNTO 5048. The total dose in Group 5 (10 ×1.4 mg/kg = 14 mg/kg) was designed to be approximately the same as that in Group 4 (1 ×10 + 9 ×0.3 mg/kg = 12.7 mg/kg).
Table 2. Parameter estimates of the mPBPK model.
Table 1. Study design showing treatment groups and dosing regimen.
The disease activity in all animals was first examined. Compared to the mice not receiving T cell transfer (Group 1), the mice that received CD45RBhigh T cell transfer (“IBD mice”) but no CNTO 5048 treatment (Group 2) started to show reduction in BW from Day 23 and the trend continued until the end of study on Day 48 ()), indicating development of IBD. All the “IBD mice” that received CNTO 5048 treatment (Groups 3–6) showed less BW loss than the isotype control group (Group 2). Group 6 mice, which received the least total dose of CNTO 5048 (10 × 0.3 mg/kg), appeared to show the least treatment effect. However, there was no apparent dose-response relationship for BW loss for the other CNTO 5048 treatment groups.
Figure 1. Summary of representative experimental observations: (a) percent change (mean ± standard error of the mean, SEM) in body weight (BW) from baseline (day 21); (b) full colon histopathology summed score (mean ± SEM), day 30 on the left and day 49 on the right for each group (i.e., 9 and 28 days after the first dose). G1: Non-IBD mice (without CD45RBhigh T cell transfer), CNTO 5048 (10 mg/kg); G2: IBD mice (+ CD45RBhigh T cell transfer), isotype control (1 × 10 + 9 × 0.3 mg/kg); G3: IBD mice, CNTO 5048 (1 × 10 mg/kg); G4: IBD mice, CNTO 5048 (1 × 10 + 9 × 0.3 mg/kg); G5: IBD mice, CNTO 5048 (10 × 1.4 mg/kg); G6: IBD mice, CNTO 5048 (10 × 0.3 mg/kg).
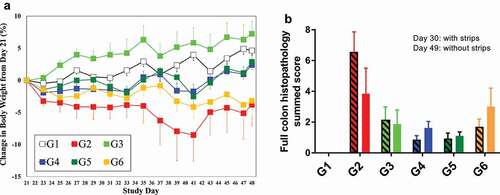
More quantitative colon disease status was measured by the sum of histopathology scores (i.e., 4 primary scored parameters: inflammation, glandular loss, erosion, hyperplasia) on Study Days 30 and 49, respectively. The Group 1 non-IBD mice all had a histopathology score of zero at all time points. The “IBD mice” with no CNTO 5048 treatment (Group 2) had much higher histopathology scores on both Days 30 and 49 ()). All mice that received CNTO 5048 treatment (Groups 3–6) exhibited significantly lower histopathology scores than Group 2 (p value < 0.05), though none achieved a histopathology score of zero, as the non-IBD control animals (Group 1). The IBD mice that received the higher total CNTO 5048 doses, either as 1 × 10 + 9 × 0.3 mg/kg (Group 4) or 10 × 1.4 mg/kg (Group 5), appeared to exhibit lower histopathology scores than the mice that received lower total doses, either as 1 × 10 mg/kg (Group 3, induction dose only) or 10 × 0.3 mg/kg (Group 6, maintenance dose only), though the differences were not statistically significant (p value > 0.05). When an approximately equivalent amount of total CNTO 5048 dose was given, no apparent therapeutic benefit of the induction dose + maintenance dose scenario (Group 4, 1 ×10 + 9 × 0.3 = 12.7 mg/kg) over a constant dosing regimen (Group 5, 10 × 1.4 = 14 mg/kg) was observed. Disease status was also characterized by colon weight/length ratios on Study Days 30 and 49, respectively, and the results were similar to that with the histopathology scores (data not shown).
Given the effectiveness of CNTO 5048 treatment and high inter-subject variability in disease severity in this mouse IBD model, there was a limited window to directly examine any potential therapeutic benefit of using induction doses. Therefore, we analyzed the impact of IBD on CNTO 5048 disposition kinetics and the ability of CNTO 5048 to neutralize serum and colon TNF to understand if the use of an induction dose could have potential therapeutic benefit for the treatment of IBD.
TNF suppression and correlation of colon free TNF and disease severity
The serum and colon free soluble TNF concentrations were below the limit of quantification (BLQ) in the non-IBD mice (Group 1) before and after CNTO 5048 treatment. The lower limit of quantification (LLOQ) for TNF was 1.12 pM in serum and 2.81 pM in colon, respectively. The IBD mice had significantly elevated TNF levels, and they were measurable in both serum and colon. For the IBD mice that received isotype control (Group 2), the mean ± standard deviation (SD) free TNF levels were at 2.2 ± 2.3 pM and 73 ± 63 pM for serum and colon for all sampling time points, respectively. For Group 2 animals, all 18 colon samples collected on Days 22, 30, and 49 had measurable free TNF, while only 46% of the 54 serum samples collected through Day 49 had measurable levels of TNF. Half of LLOQ was used for calculation of mean and SD for all BLQ samples.
For Groups 3–6 animals, free TNF levels in the serum and colon of IBD mice decreased significantly right after receiving the first dose of CNTO 5048. At 24-hr post the first dose (Day 22). Serum free TNF in all of the Groups 3–5 animals, except for 1 animal in Group 3, fell BLQ, and was reduced by 22% on average in Group 6 ()). Compared to the isotype control antibody-treated IBD mice (Group 2), CNTO 5048-treated IBD mice exhibited 43%, 67%, 61%, and 28% reduction in mean colon free TNF for Groups 3–6, respectively ()). Half of LLOQ was used for calculation for all BLQ samples. Using 1-sided t-test, the p value are 0.13, 0.006, 0.006 and 0.20 for Groups 3, 4, 5, and 6, respectively, compared to Group 2. Note that 1 of the 6 animals in Group 3 had twofold higher free TNF value compared to the mean of Group 2 (control) at 24 hr post the first CNTO 5048 dosing, resulting in the relatively high p value.
Figure 2. Observed percent (%) change (mean ± SD) from the mean TNF in the control group (G2) for serum (a) or colon free TNF in Groups 3–6 on Day 22, 30 and 49 (i.e., 1, 9, and 28 days after the first dose), and correlations between individual free TNF in serum (c) or colon (d) versus full colon histopathology summed score or neutrophil score on Day 30 and 49 (i.e., 9 and 28 days after the first dose). All BLQ TNF values were plotted at ½ of LLOQ.
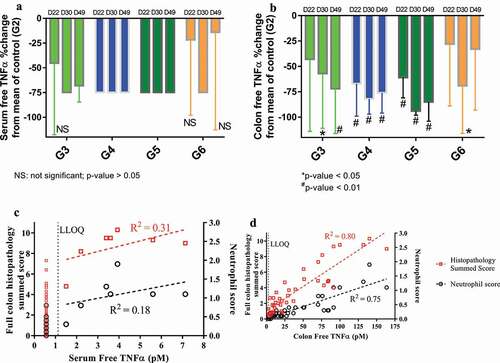
CNTO 5048 presumably exerted its function via the neutralization of pathogenic TNF at the tissue site of action (colon). To examine this hypothesis, we first examined the relationship between free soluble TNF (i.e., TNF free from CNTO 5048 binding) concentrations in serum or colon and disease severities. As shown in ), the free soluble TNF concentrations in the colon tissue correlated well with colon histopathology sum scores and neutrophil scores (RCitation2 = 0.80 and 0.75, respectively). In contrast, no apparent correlation between serum free TNF concentrations and disease activities was seen ()). The majority of the serum free TNF concentrations were BLQ, and they were plotted as ½ of LLOQ, but excluded for correlation analysis. A few colon free TNF concentrations were also BLQ, and they were treated similarly. Even though the correlation itself does not guarantee causality, this result clearly demonstrated the value of assessing pathogenic cytokine neutralization at the tissue site of action.
A mPBPK/TE model for CNTO 5048 Disposition kinetics in serum and colon of the adoptive T cell transfer model of colitis
Next, a mPBPK/TE model was developed to quantitatively assess serum and colon distribution kinetics of CNTO 5048, the ability of CNTO 5048 to neutralize TNF in both central circulation and at colon. The step-wise mPBPK/TE model scheme is shown in ; details of its development process can be found in the Materials and Methods section. For convenience, Study Day 21, the day the animals received their first mAb dose, was defined as Day 0 (elapsed time) for modeling purposes. Model fitting results for CNTO 5048 and TNF concentrations are shown in and , respectively. The estimated model parameters are summarized in .
Figure 3. Scheme of mPBPK/TE model for the CNTO 5048 interaction with TNF in serum and colon. (a) Basic second-generation minimal PBPK was used to characterize serum CNTO 5048 pharmacokinetics; (b) Colon compartments were incorporated into the basic mPBPK model to characterize colon CNTO 5048 distribution; (c) TMDD in the serum compartment was integrated into Model B to characterize the free TNF profile in serum; and (d) TMDD in the colon compartment was added to Model C to characterize the free TNF dynamics in colon.
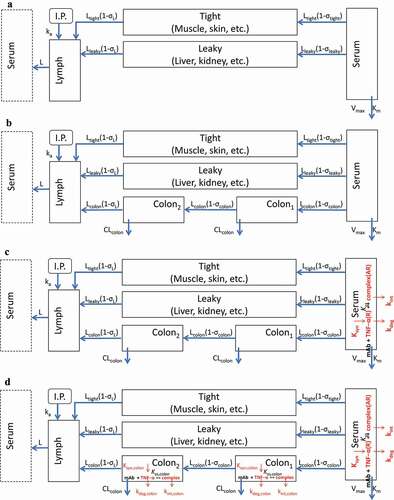
Figure 4. Model fitting for (a) CNTO 5048 in serum; (b) CNTO 5048 in colon homogenate Symbols represent the observed data (mean±SD); solid black lines and blue dashed lines represent model fitting results. The LLOQ of CNTO 5048 in serum and colon tissue were 0.533 and 2.67 nM, respectively. LLOQ for colon shown in black dotted lines, while serum mean concentrations are above LLOQ for all groups and therefore the LLOQ for serum is not shown.
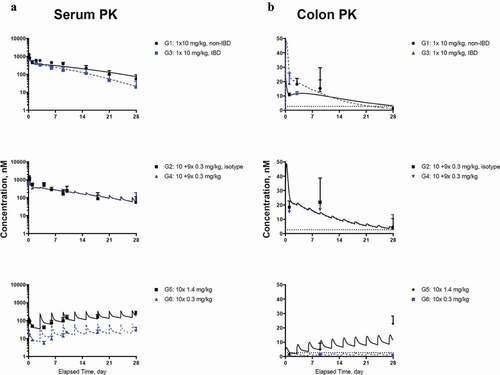
Figure 5. Model fitting for (a) free TNF in serum; (b) free TNF in colon homogenate. Symbols represent the observed data (mean±SD); lines represent model fitting results. The LLOQ of TNF in serum and colon tissue were 1.12 and 2.81 pM, respectively (shown in dotted lines).
Following a single IV bolus dose, CNTO 5048 exhibited apparent non-linear clearance as suggested by the accelerated terminal elimination in the serum concentration-time profiles of both non-IBD and IBD mice (), G1 and G3). CNTO 5048 exposure was approximately twofold higher in non-IBD mice than IBD mice. The intrinsic clearance of CNTO 5048 (i.e., ) in IBD mice was found to be ~33% higher than that in non-IBD controls (0.020 vs. 0.015 mL/hr), and this difference is statistically significant (p value <0.005 with Wald test). The estimated reflection coefficients for tight and leaky tissues (0.955 and 0.201, respectively) were consistent with the values reported for mAbs across species such as in mouse, rat, rabbit, cat, monkey, dog, sheep, and human.Citation20,Citation21
Following a 10 mg/kg IV bolus dose, CNTO 5048 colon concentrations at 24 hr were approximately twofold higher in IBD mice (Group 3) compared to those in the non-IBD mice (Group 1) ()), while the serum CNTO 5048 concentrations at 24 hr were lower in the IBD mice. This might be due to higher colon blood capillary permeability in IBD mice, though higher residual blood volume in the inflamed colon could have also contributed. Interestingly, colon CNTO 5048 concentrations increased from Day 1 (24 h) to Day 3 in the non-IBD mice, but decreased in the IBD mice, suggesting differences in both reflection coefficient for colon () and clearance of antibody from colon between the nondiseased and diseased mice. The colon concentration-time profiles of CNTO 5048 in non-IBD and IBD mice for all dose groups were simultaneously modeled with a series of transit compartments within colon. Different numbers of transit compartments (1, 2, and 3) were tested and a model with 2 transit compartments resulted in the lowest −2LL value and best captured the trend of data. The estimated
was considerably lower in the IBD mice compared to non-IBD mice (0.391 vs. 0.978), consistent with the expectation that inflammation can cause an increase in vascular permeability.Citation22 The ratio of estimated clearance of CNTO 5048 to the lymph flow rate in colon interstitial fluid (ISF) compartment was ~ 14 times higher for the IBD mice compared to the non-IBD ones (
). Clearance of CNTO 5048 from the colon of IBD mice was ~ 2-fold of the lymph drainage clearance from colon (calculated as:
.
TNF target suppression and CNTO 5048 treatment effect
We next examined the ability of CNTO 5048 to neutralize soluble TNF in both serum and colon, with a quasi-equilibrium PK/TE model incorporated into both compartments (-)). We were unable to obtain reliable total TNF measurements due to technical difficulties, so only free TNF values were used for model development. The model reasonably captured the free TNF profiles in all dose groups and all model parameters were successfully estimated.
The degradation rate constant for free TNF in serum () was estimated to be 12.8 hr,−Citation1 corresponding to a half-life (t1/2) of 3.25 min, which was within 2-fold of the reported ~6–7 min t1/2 of radiolabelled mouse TNF in mice serumCitation23 and ~5–8 min t1/2 of recombinant human TNF in rat serum.Citation24 The apparent quasi-equilibrium binding constant (
) in serum was estimated to be 1.88 nM, which was similar to the 1.5 nM in vitro binding affinity for CNTO 5048 to purified recombinant TNF (internal data). The degradation rate constant for free TNF in colon (
) was estimated to be ~10-fold lower than that in serum (
), clearly indicating different elimination mechanisms for TNF in colon and in serum. In IBD mice, the baseline TNF concentration in the colon ISF was estimated to be ~0.42 nM (corresponding to 0.073 nM in colon homogenate), ~190-fold higher than that in serum (0.0022 nM) based on results from the isotype control group. The synthesis rate of TNF in colon was estimated to be ~17 times higher than that in serum (
= 0.49 nM/hr;
= 0.028 nM/hr).
The current model assumed that the relationship between free TNF synthesis and disease state did not change between Study Day 30 and 49, which might not be entirely true in the current animal model, but the limited sampling time points prevented us from evaluation of more sophisticated models on disease progression.
Discussion
The disposition and mechanism of action of CNTO 5048, an anti-TNF surrogate mAb of golimumab, was studied in a mouse CD45RBhigh adoptive T cell transfer IBD model.Citation10 Chronic gut inflammation is largely mediated by T lymphocytes. Adoptive transfer of CD45RBhigh T cells (naive T cells) from healthy mice induces a pancolitis and small bowel inflammation in the SCID mice in approximately 4 weeks following the T cell transfer. This T cell transfer model is responsive to a variety of immunological treatments including anti-TNF therapies, and it was selected as the IBD mouse model for our study.
Many of the anti-TNF agents are highly effective in the treatment of IBD. It has been suggested that suppression of colon TNF is critical for treatment effect.Citation25,Citation26 Our data from this study also showed that free soluble TNF concentrations in colon, but not in serum, correlated well with their disease severity. Given the number of animals used in the study, only sparse sampling scheme for colon pharmacodynamic measurements was implemented and the temporal change of inflammation after the colon TNF suppression could not be evaluated fully. Nevertheless, these results suggested colon soluble TNF neutralization may be a potential prognostic biomarker for the treatment effect of anti-TNF agents for IBD. This does not mean only soluble TNF is important for IBD, and it only indicates soluble TNF neutralization may be a surrogate for overall TNF signaling blockade in the colon. Indeed, TNF is also expressed in membrane-bound form in activated macrophages, monocytes and T cells. Both soluble and mTNF can signal,Citation25,Citation26 and mTNF has been suggested to be important for IBD.Citation26 CNTO 5048, the anti-TNF antibody we studied, recognizes both soluble and mTNF.Citation26 The conclusion here may not be applicable to anti-TNF agents that interact differentially to soluble and mTNF.
It is technically challenging to develop free target assays because some equilibrium disruption during sample manipulation is unavoidable.Citation27,Citation28 The free TNF assay was designed to minimize the potential disruption of equilibrium by minimizing dilution during tissue homogenization, weighing all tissue samples to ensure consistent dilution, and one-step removal of all antibody-bound TNF before any further dilution and measurement. Physiological concentrations of soluble TNF exist as(at?) a dynamic equilibrium between homotrimer and monomer conformations, and only the homotrimer is biological active.Citation7 In our free TNF assay, the partial antibody-bound trimeric TNF is expected to be removed and not counted as free TNF. There is no direct evidence to show whether a partial antibody-bound trimeric TNF is biologically active or not. Even if it has some biological activity, assuming the anti-TNF antibody binds to each TNF monomeric unit with similar affinity, the level of free TNF can still be used as a surrogate for overall TNF signaling blockade. In addition, we examined the free TNF assay performance by spiking in various amounts of TNF and anti-TNF antibodies, and showed that the measured free TNF values in general agreed with the theoretical values.
Human tissue samples are difficult to obtain, and it is not practical to study the tissue target suppression profiles in humans directly. In order to understand the antibody and target interplay at the tissue site of action, a mPBPK/TE model was developed to characterize CNTO 5048 disposition and the ability of CNTO 5048 to neutralize soluble TNF in both serum and the colon in the mouse IBD model. The physiological nature of this model made it possible to extrapolate the learnings from this preclinical disease model to clinical scenarios.
The mPBPK/TE model was developed using CNTO 5048 PK and free TNF data from both serum and colon homogenate in IBD and non-IBD control mice. The intrinsic systemic clearance for free CNTO 5048 (i.e., ) in IBD mice was estimated to be ~0.020 mL/hr, ~33% higher than that in non-IBD controls (0.015 mL/hr). Using 20 gram mean BW for mice, the intrinsic systemic clearance for free CNTO 5048 in IBD and non-IBD mice were ~24 and 18 mL/kg/day, respectively, slightly higher than the reported range from 13 mAbs with no apparent TMDD in mouse (3–16 mL/day/kg).Citation29 While anti-drug antibodies (ADAs) can be a significant contributing factor for faster antibody clearance, and anti-TNF antibodies have been associated with relatively high incidence of ADA,Citation30 the faster clearance of CNTO 5048 in IBD mice vs control mice is unlikely due to ADA because the exposure differences can be seen within the first couple of days following the first dose.
Although CNTO 5048 exhibited ~33% higher systemic clearance in the IBD mice and the serum concentration of CNTO 5048 was consistently lower than that in the non-IBD mice, the colon concentrations of CNTO 5048 at 24 hr were approximately twofold higher in the IBD mice, providing direct evidence that inflammatory diseases such as IBD can increase vascular permeability and change mAb disposition.Citation31 It has been well established that acute and chronic inflammation is associated with vasodilation and blood flow increase, which will lead to increased extravasation of plasma proteins.Citation32,Citation33 There had been limited reports on quantitatively how inflammatory conditions would change the tissue distribution of macromolecules. Secukinumab, an anti-IL-17 mAb whose concentrations in human dermal interstitial fluid were measured using dermal open flow microperfusion method, is a well-known example.Citation34 The results showed that secukinumab concentrations in the nonlesional and lesional skin of psoriatic patients were between 28% and 39% of the corresponding serum concentrations measured, comparing to about 23% in the skin of healthy subjects.Citation34 The mAb distribution to the inflamed joint had also been studied in a mouse CIA model, and the results showed that the joint lavage/serum ratios were on average 5- to 10-fold higher in the CIA mice than the control mice.Citation35 The approximately twofold higher colon concentrations of CNTO 5048 in the IBD mice we found here are within the range of relevant previous reports.
Previous mPBPK modeling work had suggested that convection and lymph drainage are the dominant pathways for the uptake and removal of two cytokine-targeting mAbs from tissues.Citation14,Citation15 Consistently, the estimated clearance of CNTO 5048 from colon ISF compartment in the IBD mice (0.00217 mL/hr) was similar to the reported lymph flow rate in IBD mice (0.00205 mL/hr). The estimated colon clearance of CNTO 5048 in the non-IBD mice was much lower, which is consistent with the higher blood capillary permeability and lymph drainage in the inflamed tissue.Citation31 Note that the magnitude of the difference may not be accurate, given the limited data points in the non-IBD animals.
The suppression of TNF, i.e., TNF target engagement (TE), in blood circulation and colon was assessed by incorporating a quasi-equilibrium TMDD component into both the serum and the colon compartments of the mPBPK model. Since there was no measurable TNF concentration in the non-IBD animals in either serum or colon, TMDD was only evaluated for the IBD animals. Based on data from the isotype control treated IBD mice, the calculated baseline TNF concentration in colon ISF (not homogenate) was nearly 200-fold higher than serum, indicating that colon TNF mainly comes from local secretion, instead of from systemic circulation. The synthesis rate constant (calculated as baseline × degradation rate constant) of TNF in colon was estimated to be ~17-fold higher than that in serum, and the elimination rate constant was estimated to be ~11-fold lower. Together, they lead to the substantially higher TNF concentrations in colon ISF.
Following dosing, CNTO 5048 binds to TNF in both serum and colon ISF and forms mAb/TNF complexes. For mAbs against cytokines, the serum elimination rate constant for mAb/target complex is often found to be similar to the mAb and much slower than the target.Citation14,Citation36 Interestingly, the serum elimination rate constant for CNTO 5048/TNF complex (kint) was estimated to be 0.866 hr−Citation1 in this IBD mouse model, substantially lower than the degradation rate of free TNF (12.8 hr−Citation1), but considerably higher than the free antibody (0.024 hr,−Citation1 calculated by the intrinsic clearance of CNTO 5048 in the serum divided by serum volume), possibly related to the anticipated larger complex formed between trimeric TNF and the bivalent mAbs, or to other target-specific elimination pathways.Citation37
The estimated quasi-equilibrium constant Kss between CNTO 5048 and TNF in serum and in colon (1.88 and 1.32 nM, respectively) were both similar to the in vitro equilibrium dissociation constant (1.5 nM).
is a parameter incorporating both complex dissociation rate constant koff and complex elimination rate constant kint
. The quasi-equilibrium constant
can be different between serum and the tissue sites, depending on the
values.Citation14,Citation15 The
and
were estimated to be 0.866 and 0.0492 hr,−Citation1 respectively. The model estimated
value corresponds to a clearance of CNTO 5048/TNF complex at 0.001 mL/hr in colon ISF (calculated by
in each of the colon compartment), within the same range of the reported lymph flow rate (
0.00205 mL/hr), suggesting the elimination of CNTO 5048/TNF complex in colon was also likely mediated by lymph drainage, similar to what was reported by Chen et al. for a mAb/IL-6 complex in the joint of mouse with collagen-induced arthritis.Citation14
For IBD, there remains considerable unmet medical needs for new treatment options that can maximize the percentage of patients who can achieve long-term clinical remission.Citation3 The treatment regimens for most of the approved biologics for IBD include an initial short-term, high-dose (or more frequently dosed) induction period followed by a long-term, low-dose maintenance period.Citation38 Infliximab is the first therapeutic protein approved for IBD treatment. For both CD and UC, the dosing regimen for infliximab is 5 mg/kg IV administration at Weeks 0, 2, and 6 (i.e., induction), then followed by 5 mg/kg every 8 weeks (i.e., maintenance).Citation5 Many of the therapeutic proteins approved later followed a similar induction dosing philosophy, though mechanistic understanding of the rationale behind such induction dose is still lacking. The posology of those approved therapeutic proteins in IBD suggests that once the disease inflammatory burden is reduced, the drug exposure required to maintain efficacy may be lower than the exposure attained with initial induction doses. However, to the best of our knowledge, the necessity of an induction dose for biologic therapy for the treatment of IBD has not been fully demonstrated, and, in many cases, the selection of induction dosing regimen versus maintenance dosing regimen in IBD appear to be more empirical than mechanistically directed.Citation3 We compared the effectiveness of two dosing regimen of CNTO 5048 in this IBD mouse model. However, the overall effectiveness of anti-TNF treatment and high inter-subject variability left no window for us to directly assess the impact of induction dose, i.e., when the total dose is comparable, no direct evidence was shown for any additional benefit of an induction dose (e.g.,10 mg/kg dose) vs. 9 × 1.4 mg/kg maintenance doses of CNTO 5048, in this study. Nevertheless, the PK/TE assessments and mPBPK model provided evidence to support the potential benefit of induction dose regimen in IBD treatment. Firstly, higher mAb distribution to inflamed tissue was demonstrated. Previous studies have demonstrated mucosal healing in patients with IBD treated with biological agents such as anti-TNF, anti-integrin, and anti‐interleukin agents, and mucosal healing has been associated with reduced inflammation.Citation38,Citation39 Reduction in inflammation and mucosal healing are expected to result in less macromolecule distribution. Indeed, the reflection coefficient for colon in IBD mice was estimated to be significantly lower than that in the non-IBD mice (0.391 vs. 0.978), providing evidence that CNTO 5048 distribution to the IBD colon would be substantially lower when the inflammation is reduced.
Secondly, the importance of neutralizing TNF at colon for IBD treatment and higher TNF production in inflamed colon were demonstrated. The baseline TNF concentration in the IBD colon was shown to be at least 26 times higher in the IBD mice (73 pM) than the non-IBD mice (LLOQ = 2.81pM). Results from the isotype control treated IBD mice group (G2) also showed a trend of reduction in colon TNF concentrations with natural healing of disease. One of the physiological consequences of TNF signaling is the recruitment of neutrophils, monocytes and other immune cells and aggravation of acute inflammation, which will lead to more TNF production in the inflamed tissues.Citation6 In our study, in the CNTO 5048 treatment group of IBD mice (G6, 10 × 0.3 mg/kg) with continuous suboptimal colon TNF suppression, a trend of increased inflammation in a subset of the animals was observed. These results suggested the importance of quick and complete TNF suppression in IBD treatment, as insufficient suppression of TNF would likely allow continuous exacerbation of inflammation. They also suggested that once the inflammatory burden and TNF production are controlled, the dose required to neutralize colon TNF and maintain efficacy may be lower. Overall, our results provided insights into the potential benefits of induction dose(s) for IBD treatment, although quantitative assessment of more preclinical and clinical readouts will be needed to understand how to design effective induction dose regimen in humans.
In summary, the disposition of an anti-TNF mAb and TNF TE in both serum and the colon were characterized in a mouse IBD model, and a mPBPK/TE model was successfully developed to understand mAb disposition and its interplay with the therapeutic target. This work sets a solid foundation for additional future studies, which may use wider dosing range, other dosing paradigms and more robust temporal histopathology and PK/TE/PD assessments at the tissue site of action. These future works will be critical to evaluate and advance our current understandings regarding IBD disease dynamics and drug therapeutic effects.
Materials and methods
Test articles
CNTO 5048, a rat/mouse chimeric IgG2a, kappa mAb specific for murine TNF, and CNTO 1322, an isotype control of CNTO 5048, were produced at Janssen R&D, LLC (Spring House, PA, USA) and used in the study.
Adoptive T cell transfer mouse model: study design and sample collection
The in-life part of the animal study was conducted at Bolder BioPATH (Boulder, CO). The study was approved by the Institutional Animal Care and Use Committee (IACUC) of Bolder BioPATH.
Adoptive transfer of CD45RBhigh T cells (naive T cells) from healthy wild-type mice into SCID mice induces colitis approximately 4–8 weeks following the T cell transfer.Citation10 Histopathological inspection of colon from mice with active disease reveals similar pathology findings as that in IBD patients.Citation10 On Study day 0, female Balb/C mice were terminated and spleens were obtained for CD45RBhigh cell isolation. The female SCID mice (Fox Chase C.B-17) each received an IP injection of ~ 4 × 10⁵ CD45RBhigh cells/ml (100 µL/mouse injections). On study day 21, mice were weighed and randomized into 6 treatment groups as outlined below based on body weight.
Study design
The study design was based on dose titration studies previously conducted using the same animal model in the same facility. Group 1 is a non-IBD control group, i.e., the animals did not receive a T cell transfer. Groups 2–6 animals all received T cell transfer and developed IBD-like syndrome, and they were referred to as “IBD mice”. All animals in Group 1 (N =30) and Group 2 (N =30) received only a single IV dose of CNTO 5048 on Study Day 21. Groups 3–6 animals received an IV induction dose on Study Day 21, and then nine IP maintenance doses on Study Days 24, 27, 30, 33, 36, 39, 42, 45, and 48, respectively. Group 3 (N =18) is an isotype control group and all animals received CNTO 1322 with a 10 mg/kg induction dose and 0.3 mg/kg maintenance doses. Group 4 (N =22) animals received CNTO 5048 with a 10 mg/kg induction dose and nine 0.3 mg/kg maintenance doses; Group 5 (N =22) animals received CNTO 5048 with a 1.4 mg/kg induction dose and nine 1.4 mg/kg maintenance doses; and Group 6 (N =22) animals received CNTO 5048 with a 0.3 mg/kg induction dose and nine 0.3 mg/kg maintenance doses.
Sample collection
At terminal time point, the animals were sacrificed by CO2. Terminal blood samples (~800 μL) were collected via cardiac puncture. Colons were harvested, length measured from the ileocecal junction to the anus, and weighed. The colon was then cut into 2 pieces: a piece of the distal part of the colon (about 2 cm, 20% of the total colonic tissue), were fixed in 6% paraformaldehyde for 3 hr and then embedded in paraffin for histology evaluation; the remaining colon were snap frozen in liquid nitrogen immediately, and used for measuring the tissue drug and TNF levels. Serial blood samples were also collected from selected animals at specified time points via retro-orbital bleeding. The number of retro-orbital bleedings was no more than two per animal.
Histology analysis
Histopathology was performed on colons that were collected on Days 30 and 49. The histopathology score which indicates the overall disease activity was determined based on established criteria at Bolder BioPATH. The summed histopathology score used in our analysis includes four primary scored parameters: inflammation, glandular loss, erosion, and hyperplasia. The inflammation score was determined by macroscopic examination, attributing one point for each centimeter of moderate inflammation or two points for each centimeter of severe inflammation, evaluated by the thickness of the colon, and attributing one additional point if adhesion, hyperemia, or lesions were observed. The extent of inflammation (macrophage, lymphocyte and polymorphonuclear cell infiltrate) was assigned severity scores according to set criteria. Colon glandular loss includes crypt epithelial as well as remaining gland epithelial loss. Colon Erosion reflects loss of surface epithelium and generally is associated with mucosal hemorrhage (reflective of the bleeding seen clinically and at necropsy). For each hematoxylin and eosin stained section, submucosal edema was quantitated by measuring the distance from the muscularis mucosa to the internal border of the outer muscle layer in a nontangential area thought to be most representative of the severity of this change. Mucosal thickness was also measured in a nontangential area of the section that best represented the overall mucosal thickness. This parameter is indicative of gland elongation and mucosal hyperplasia. In order to incorporate this parameter into the summed score, a hyperplasia score was derived.
Inflammatory cell infiltrates in the colonic mucosa were evaluated for approximate percent of neutrophils in the total infiltrate using set criteria (0 = approximately 0%; 10 = approximately 10%; 25 = approximately 25%;50 = approximately 50%; 75 = 75% or greater). This value was then multiplied by the 0–5 inflammation score to determine the Neutrophil Score in an attempt to semiquantify relative polymorphonuclear leukocyte infiltration across sections and animals. The %inhibition from disease controls is calculated by comparing values for treated and normal animals. Data was analyzed using a two-tailed homoscedastic t-test in Excel. p value <0.05 was used as the threshold of statistical significance.
Colon homogenate preparation
The colon samples used for PK and soluble TNF measurements were snap frozen immediately after collection. After all colon samples were collected, the frozen colon samples were thawed and pulverized using Covaris cryoPREP™ impactor (Covaris Part #CP02). Samples were weighed and resuspended in Dulbecco’s phosphate-buffered saline without magnesium or calcium with protease inhibitor (Roche Part# 1183615300) at a ratio of 0.2 g tissue/mL homogenization buffer and divided into 0.5 mL aliquots per tube. The slurry was centrifuged at approximately 16,500 × g for 30 minutes at 4°C. The resulting supernatant, henceforth called colon homogenate, was removed and stored as frozen aliquots for PK and TNF measurements.
Bioanalytical methods
PK assay to measure total CNTO 5048 in serum and colon homogenate
Total CNTO 5048 concentrations in serum and colon homogenate samples were quantified using MSD® Gold Streptavidin-coated plates (MesoScale Discovery; L15SA) and electrochemiluminescent (ECL) readout. Briefly, plates were blocked with phosphate-buffered saline + 1% bovine serum albumin buffer then incubated with biotinylated mouse antimouse IgG2a (BD Pharmingen™; 553502) for 1 hr. Plates were washed and diluted standards, controls, and samples were added to the plate and incubated for 1 hr. Following another wash step, ruthenium-labeled goat antimouse IgG2a Fc (Jackson ImmunoResearch; 115–005-206) was added and incubated for 1 hr. Plates were washed and read on MSD S6000 SECTOR® Imager. Sample results were back-calculated from standard curve regression performed with 5-parameter logistic fit and 1/YCitation2 weighting in Watson LIMS (Thermo). The LLOQ of CNTO 5048 in serum and colon homogenate were both 80 ng/mL (0.533 nM). The CNTO 5048 concentrations in colon homogenate was converted to that in the wet tissue using 0.2 g tissue/mL of homogenization buffer, assuming wet colon tissue density = 1.0 g/mL. The LLOQ for CNTO 5048 in colon tissue was 2.67 nM (0.533 nM/0.2). The BLQ data were treated as ½ LLOQ values for plotting.Citation40
Target Engagement (TE) assay to measure free soluble TNF concentration in serum and colon homogenate
All calibrators, QCs and serum/colon homogenate samples were first incubated with Protein G resin (Pierce Part#) to remove all IgGs. CNTO 5048-bound TNF would also be removed in this immunodepletion step, and only free (unbound) soluble TNF remained. The free soluble TNF concentrations were quantitated using a V-Plex™ assay from MSDTM and the manufacturer’s protocol except that the calibrator panel was replaced with mouse TNF (R&D Systems Part# 410-MT/CF) and a minimum required dilution of 1/10 was applied for all calibrators, QCs and samples. Calibrator curve regressions and sample interpolation were completed in Watson LIMS (Thermo). All TNF concentrations in colon homogenates were converted to tissue concentrations by dividing by 0.2 (0.2 g tissue/mL of homogenization buffer, assuming wet colon tissue density = 1.0 g/mL). The LLOQ for TNF in serum and colon homogenate was 19.53 and 9.77 pg/mL, respectively. Using the molecular weight of monomeric TNF as 17.4 kDa, the LLOQs for TNF in serum and colon tissue were 1.12 pM and 2.81 pM, respectively. When suitable, the BLQ data were treated as ½ LLOQ values for plotting purposes. For serum or colon free TNF (Groups 3–6) on Days 22, 30, and 49, percent change from the respective mean TNF in the control group (Group 2) was further analyzed using a one-tailed t-test in Excel. p value <0.05 was used as the threshold of statistical significance.
Modeling the pharmacokinetics of CNTO 5048 and its interplay with TNF in serum and colon
The mPBPK modeling approach with TMDD was applied to characterize the PK of CNTO 5048 and its interplay with TNF in mouse serum and colon. For modeling and graphing of all modeling results, study day 21 is relabeled as day 0 as it was the first dosing day. A stepwise modeling strategy was adopted for model development as illustrated in . The serum concentrations of CNTO 5048 were used to describe the PK of mAb with the second-generation mPBPK model in the first step ()).Citation12 Colon components were added into the mPBPK model to describe the biodistribution of CNTO 5048 into colon interstitium ()). Particularly, colon was divided into 2 compartments with equal volume of distribution to capture the delay of CNTO 5048 uptake observed in the non-IBD mice group. Then TMDD in serum ()) and in colon interstitial space ()) were incorporated sequentially by including concentrations of antibody in colon homogenate and free TNF concentrations in both serum and in colon homogenate.
Step I: serum PK of CNTO 5048
A second-generation mPBPK model was used to fit serum concentration profiles of CNTO 5048 in non-IBD control (10 mg/kg), IBD mice (1 ×10, 1 ×10 + 9 ×0.3, 10 ×1.4 and 10 ×0.3 mg/kg) and isotype control of CNTO 1322 with IBD (1 ×10 + 9 ×0.3 mg/kg). This model includes serum, lymph, and two lumped tissue compartments (leaky and tight based on vascular endothelium structures) connected in an anatomical manner ()). The model was described by the following equations with their initial conditions:
where is the total concentration of CNTO 5048 in serum,
and
are the concentrations in ISF in two types of lumped tissues categorized by continuous and fenestrated vascular endothelium,
is the concentration in lymph, and
is the amount of CNTO 5048 at the absorption site after IP administration. The
is the serum volume;
(0.65 ∙ ISF ∙ Kp, where Kp is the available fraction of ISF for IgG antibody distribution and Kp = .8), and Vleaky (0.35 ∙ ISF ∙ Kp) are ISF volumes of the two lumped tissues. The
is lymph volume. The L is total lymph flow rate and
and
account for 1/3 and 2/3 of the total lymph flow. The
and
are vascular reflection coefficients for tight and leaky tissues. The
is the lymphatic capillary reflection coefficient and is assumed to be 0.2.Citation12 Michaelis–Menten clearance from serum was assumed to account for the nonlinear PK of CNTO 5048 in mice.
Step II: CNTO 5048 disposition in colon
Concentrations of CNTO 5048 in colon homogenate were assessed together with serum concentrations.
Colon was assumed as two equally divided compartments that represented two colon segments that CNTO 5048 will distribute sequentially ()), and the reflection coefficient between serum to the first colon compartment and between the first and the second colon compartment was assumed equal. This model structure effectively captured the observed colon CNTO 5048 profiles. Colon ISF volume was assumed as 17.4% of colon weight.Citation16 Averaged colon length was assumed to be 7.5 cm (reported 7~8 cm).Citation17,Citation18 Averaged non-IBD mice colon weight to length ratio was measured as 0.02 g/cm,Citation19 and this ratio was assumed to be 0.03 g/cm for IBD mice due to inflammation-mediated swelling. Therefore, total ISF volume for colon was calculated as:
According to the tissue grouping in the mPBPK model, colon was assumed to be part of the leaky tissue.Citation2 Thus, the physiological value of colon ISF volume used in this model accounted for 1.71% of the lumped leaky tissue compartment for non-IBD mice and 2.56% for IBD mice. The lymph flow rate to ISF volume ratio for colon was assumed to be equal to the ratio as leaky tissue. Therefore, the colon lymph flow rate was calculated as:
This lymph flow rate was consistent with the value reported as 0.015 mL/min/100 g tissue for large intestine,Citation41 equivalent to of 0.00135 mL/hr for non-IBD mice, and 0.00202 mL/hr for mice with IBD. In addition,
and
values were adjusted to (0.35 ∙ ISF ∙ Kp –
) and (2/3 L –
), respectively. The final concentrations of CNTO 5048 in the colon homogenate are the total amount of antibody in both colon ISF and residual blood, averaged by total tissue weight. According to the previous report,Citation16 the ratio of ISF volume to total tissue weight in mice large intestine was 17.5%, and the ratio of residual serum volume to total tissue weight was 1.59%.
Additional equations for colon compartments were listed as following:
where and
are the concentrations of CNTO 5048 in colon interstitium,
is the clearance of the antibody occurred in colon,
is the concentration of antibody in colon homogenate.
is a hybrid parameter that contained the information of both colon vasculature leakiness and delay in antibody uptake into the colon.
Step III: TNF TE and CNTO 5048 TMDD in serum
The interplay of CNTO 5048 and TNF in serum was characterized using TMDD kinetics ()). Serum concentration – time profiles of free CNTO 5048 as well as free TNF in IBD mice were assessed. The model was described as:
where is the free CNTO 345 concentration in serum, the
and AR are the total TNF and the CNTO 5048/TNF complex concentrations in serum,
is the zero order rate and
is the first order rate constants for TNF biosynthesis and degradation in serum, and
refers to the elimination rate constant of CNTO 5048/TNF complex in serum. The formed complex is also expected to circulate through serum and tissues. However, the complex accounted minimally to total CNTO 5048 concentrations across the entire sampling time and all dose groups (< 0.1% of free CNTO 5048 concentrations in serum and < 2% of free CNTO 5048 concentrations in colon). Therefore, tissue distribution of complex was not included in our model for simplification purpose.
Assuming quasi-equilibrium condition when the antibody binding kinetics occurs much more rapidly compared to the distribution processes,Citation42 can be described as:
And
where and
are the association and the dissociation rate constants for CNTO 5048 to TNF. The concentration of CNTO 5048/TNF complex was described as:
The free TNF concentration in serum was described as:
Step IV: TNF TE and CNTO 5048 TMDD in colon
CNTO 5048 and free TNF concentrations in colon homogenate were examined and a TMDD model with quasi-equilibrium assumption.Citation42 The baseline TNF concentration was assumed equal in two colon compartments.
The CNTO 5048-TNF complex in the two colon compartments were calculated as:
The free CNTO 5048 concentration in colon homogenate was:
The free TNF concentration in each colon ISF compartment was:
The free TNF concentration in colon homogenate was:
where and
were total CNTO 5048 concentrations in two segments of the colon ISF,
and
were total TNF concentrations,
was the steady state quasi-equilibrium constant for both compartments.
Model fitting was performed with Monolix 2019R1 (Lixoft, France) using naive pooling of data. Since data were from serial destruction and being pooled together, between-subject variability (IIV) was not considered for the parameters and the omega matrix was fixed to zero. Importance sampling algorithm was used to calculate likelihood and Stochastic Approximation was used to derive Fisher information matrix.Citation43 The proportional residual error model was used for serum CNTO 5048 concentrations; constant residual error models were used for colon concentrations of CNTO 5048, serum and free TNF concentrations. Model performance was evaluated by goodness-of-fit plots and −2 log likelihood value (−2LL).
Abbreviations
Acknowledgments
The authors would like to acknowledge Beverley Moore and Dave Shealy for their scientific input towards the study design. We would also like to thank Phillip J. Bendele, Alison M. Bendele, Robert O’Connell, Kyle Wagner, George Bendele from Bolder BioPATH for conducting the in-life part of the animal study as well as the final in-life pathology data assembly and statistical analysis. In addition, we want to thank Gopi Shankar and Donald Heald for their scientific review of the manuscript.
References
- Hendrickson BA, Gokhale R, Cho JH. Clinical aspects and pathophysiology of inflammatory bowel disease. Clin Microbiol Rev. 2002;15(1):79–15. doi:https://doi.org/10.1128/CMR.15.1.79-94.2002.
- de Souza HS, Fiocchi C. Immunopathogenesis of IBD: current state of the art. Nat Rev Gastroenterol Hepatol. 2016;13:13–27.
- Rawla P, Sunkara T, Raj JP. Role of biologics and biosimilars in inflammatory bowel disease: current trends and future perspectives. J Inflamm Res. 2018;11:215–26. doi:https://doi.org/10.2147/JIR.S165330.
- Magro F, Portela F. Management of inflammatory bowel disease with infliximab and other anti-tumor necrosis factor alpha therapies. BioDrugs. 2010;24(Suppl 1):3–14. doi:https://doi.org/10.2165/11586290-000000000-00000.
- Peyrin-Biroulet L. Anti-TNF therapy in inflammatory bowel diseases: a huge review. Minerva Gastroenterol Dietol. 2010;56:233–43.
- Billmeier U, Dieterich W, Neurath MF, Atreya R. Molecular mechanism of action of anti-tumor necrosis factor antibodies in inflammatory bowel diseases. World J Gastroenterol. 2016;22(42):9300–13. doi:https://doi.org/10.3748/wjg.v22.i42.9300.
- Corti A, Fassina G, Marcucci F, Barbanti E, Cassani G. Oligomeric tumour necrosis factor alpha slowly converts into inactive forms at bioactive levels. Biochem J. 1992;284(Pt 3):905–10. doi:https://doi.org/10.1042/bj2840905.
- Levin AD, Wildenberg ME, van den Brink GR. van den Brink GR. Mechanism of Action of Anti-TNF Therapy in Inflammatory Bowel Disease. J Crohns Colitis. 2016;10(8):989–97. doi:https://doi.org/10.1093/ecco-jcc/jjw053.
- Marotte H, Cimaz R. Etanercept - TNF receptor and IgG1 Fc fusion protein: is it different from other TNF blockers? Expert Opin Biol Ther. 2014;14(5):569–72. doi:https://doi.org/10.1517/14712598.2014.896334.
- Ostanin DV, Bao J, Koboziev I, Gray L, Robinson-Jackson SA, Kosloski-Davidson M, Price VH, Grisham MB. T cell transfer model of chronic colitis: concepts, considerations, and tricks of the trade. Am J Physiol Gastrointest Liver Physiol. 2009;296(2):G135–46. doi:https://doi.org/10.1152/ajpgi.90462.2008.
- Cao Y, Jusko WJ. Applications of minimal physiologically-based pharmacokinetic models. J Pharmacokinet Pharmacodyn. 2012;39(6):711–23. doi:https://doi.org/10.1007/s10928-012-9280-2.
- Cao Y, Balthasar JP, Jusko WJ. Second-generation minimal physiologically-based pharmacokinetic model for monoclonal antibodies. J Pharmacokinet Pharmacodyn. 2013;40(5):597–607. doi:https://doi.org/10.1007/s10928-013-9332-2.
- Cao Y, Jusko WJ. Incorporating target-mediated drug disposition in a minimal physiologically-based pharmacokinetic model for monoclonal antibodies. J Pharmacokinet Pharmacodyn. 2014;41(4):375–87. doi:https://doi.org/10.1007/s10928-014-9372-2.
- Chen X, Jiang X, Jusko WJ, Zhou H, Wang W. Minimal physiologically-based pharmacokinetic (mPBPK) model for a monoclonal antibody against interleukin-6 in mice with collagen-induced arthritis. J Pharmacokinet Pharmacodyn. 2016;43(3):291–304. doi:https://doi.org/10.1007/s10928-016-9472-2.
- Chen X, Jiang X, Doddareddy R, Geist B, McIntosh T, Jusko WJ, Zhou H, Wang W. Development and Translational application of a minimal physiologically based pharmacokinetic model for a monoclonal antibody against interleukin 23 (IL-23) in IL-23-induced psoriasis-like mice. J Pharmacol Exp Ther. 2018;365(1):140–55. doi:https://doi.org/10.1124/jpet.117.244855.
- Shah DK, Betts AM. Towards a platform PBPK model to characterize the plasma and tissue disposition of monoclonal antibodies in preclinical species and human. J Pharmacokinet Pharmacodyn. 2012;39(1):67–86. doi:https://doi.org/10.1007/s10928-011-9232-2.
- Banerjee S, Oneda B, Yap LM, Jewell DP, Matters GL, Fitzpatrick LR, Seibold F, Sterchi EE, Ahmad T, Lottaz D, et al. MEP1A allele for meprin A metalloprotease is a susceptibility gene for inflammatory bowel disease. Mucosal Immunol. 2009;2(3):220–31. doi:https://doi.org/10.1038/mi.2009.3.
- Zheng T, Zhang B, Chen C, Ma J, Meng D, Huang J, Hu R, Liu X, Otsu K, Liu AC, et al. Protein kinase p38alpha signaling in dendritic cells regulates colon inflammation and tumorigenesis. Proc Natl Acad Sci U S A. 2018;115(52):E12313–E22. doi:https://doi.org/10.1073/pnas.1814705115.
- Naeem M, Choi M, Cao J, Lee Y, Ikram M, Yoon S, Lee J, Moon HR, Kim MS, Jung Y, et al. Colon-targeted delivery of budesonide using dual pH- and time-dependent polymeric nanoparticles for colitis therapy. Drug Des Devel Ther. 2015;9:3789–99. doi:https://doi.org/10.2147/DDDT.S88672.
- Cao Y, Jusko WJ. Survey of monoclonal antibody disposition in man utilizing a minimal physiologically-based pharmacokinetic model. J Pharmacokinet Pharmacodyn. 2014;41(6):571–80. doi:https://doi.org/10.1007/s10928-014-9374-0.
- Zhao J, Cao Y, Jusko WJ. Across-species scaling of monoclonal antibody pharmacokinetics using a minimal PBPK model. Pharm Res. 2015;32(10):3269–81. doi:https://doi.org/10.1007/s11095-015-1703-5.
- Bischoff SC, Barbara G, Buurman W, Ockhuizen T, Schulzke JD, Serino M, Tilg H, Watson A, Wells JM. Intestinal permeability–a new target for disease prevention and therapy. BMC Gastroenterol. 2014;14:189.
- Beutler BA, Milsark IW, Cerami A. Cachectin/tumor necrosis factor: production, distribution, and metabolic fate in vivo. J Immunol. 1985;135:3972–77.
- Chen X, DuBois DC, Almon RR, Jusko WJ. Interrelationships between infliximab and recombinant tumor necrosis factor-alpha in plasma using minimal physiologically based pharmacokinetic models. Drug Metab Dispos. 2017;45:790–97. doi:https://doi.org/10.1124/dmd.116.074807.
- Spriggs DR, Deutsch S, Kufe DW. Genomic structure, induction, and production of TNF-alpha. Immunol Ser. 1992;56:3–34.
- Perrier C, de Hertogh G, Cremer J, Vermeire S, Rutgeerts P, Van Assche G, Szymkowski DE, Ceuppens JL. Neutralization of membrane TNF, but not soluble TNF, is crucial for the treatment of experimental colitis. Inflamm Bowel Dis. 2013;19(2):246–53. doi:https://doi.org/10.1002/ibd.23023.
- Lee JW, Kelley M, King LE, Yang J, Salimi-Moosavi H, Tang MT, Lu JF, Kamerud J, Ahene A, Myler H, et al. Bioanalytical approaches to quantify “total” and “free” therapeutic antibodies and their targets: technical challenges and PK/PD applications over the course of drug development. Aaps J. 2011;13(1):99–110. doi:https://doi.org/10.1208/s12248-011-9251-3.
- Zheng S, McIntosh T, Wang W. Utility of free and total target measurements as target engagement and efficacy biomarkers in biotherapeutic development–opportunities and challenges. J Clin Pharmacol. 2015;55(Suppl S3):S75–84. doi:https://doi.org/10.1002/jcph.357.
- Deng R, Iyer S, Theil FP, Mortensen DL, Fielder PJ, Prabhu S. Projecting human pharmacokinetics of therapeutic antibodies from nonclinical data: what have we learned? MAbs. 2011;3(1):61–66. doi:https://doi.org/10.4161/mabs.3.1.13799.
- Wang W, Leu J, Watson R, Xu Z, Zhou H. Investigation of the mechanism of therapeutic protein-drug interaction between methotrexate and golimumab, an anti-tnfalpha monoclonal antibody. Aaps J. 2018;20(3):63. doi:https://doi.org/10.1208/s12248-018-0219-4.
- Schwager S, Detmar M. Inflammation and Lymphatic Function. Front Immunol. 2019;10:308. doi:https://doi.org/10.3389/fimmu.2019.00308.
- Claesson-Welsh L. Vascular permeability–the essentials. Ups J Med Sci. 2015;120(3):135–43. doi:https://doi.org/10.3109/03009734.2015.1064501.
- Pober JS, Sessa WC. Inflammation and the blood microvascular system. Cold Spring Harb Perspect Biol. 2014;7(1):a016345. doi:https://doi.org/10.1101/cshperspect.a016345.
- Dragatin C, Polus F, Bodenlenz M, Calonder C, Aigner B, Tiffner KI, Mader JK, Ratzer M, Woessner R, Pieber TR, et al. Secukinumab distributes into dermal interstitial fluid of psoriasis patients as demonstrated by open flow microperfusion. Exp Dermatol. 2016;25(2):157–59. doi:https://doi.org/10.1111/exd.12863.
- Wang W, McIntosh TS, Jiang X, Doddareddy R, Dell EC, Zhou H. Deciphering the in vivo performance of a monoclonal antibody to neutralize its soluble target at the site of action in a mouse collagen-induced arthritis model. Pharm Res. 2016;33(4):1040–49. doi:https://doi.org/10.1007/s11095-015-1850-8.
- Wang W, Wang X, Doddareddy R, Fink D, McIntosh T, Davis HM, Zhou H. Mechanistic pharmacokinetic/target engagement/pharmacodynamic (PK/TE/PD) modeling in deciphering interplay between a monoclonal antibody and its soluble target in cynomolgus monkeys. Aaps J. 2014;16(1):129–39. doi:https://doi.org/10.1208/s12248-013-9545-8.
- Rojas JR, Taylor RP, Cunningham MR, Rutkoski TJ, Vennarini J, Jang H, Graham MA, Geboes K, Rousselle SD, Wagner CL, et al. Formation, distribution, and elimination of infliximab and anti-infliximab immune complexes in cynomolgus monkeys. J Pharmacol Exp Ther. 2005;313(2):578–85. doi:https://doi.org/10.1124/jpet.104.079277.
- Van den Berghe N, Gils A, Thomas D. Achieving mucosal healing in inflammatory bowel diseases: which drug concentrations need to be targeted? Clin Pharmacol Ther. 2019;106(5):945–54. doi:https://doi.org/10.1002/cpt.1609.
- Pineton de Chambrun G, Blanc P, Peyrin-Biroulet L. Current evidence supporting mucosal healing and deep remission as important treatment goals for inflammatory bowel disease. Expert Rev Gastroenterol Hepatol. 2016;10:915–27.
- Bergstrand M, Karlsson MO. Handling data below the limit of quantification in mixed effect models. Aaps J. 2009;11(2):371–80. doi:https://doi.org/10.1208/s12248-009-9112-5.
- Alexander JS, Ganta VC, Jordan PA, Witte MH. Gastrointestinal lymphatics in health and disease. Pathophysiology. 2010;17(4):315–35. doi:https://doi.org/10.1016/j.pathophys.2009.09.003.
- Gibiansky L, Gibiansky E, Kakkar T, Ma P. Approximations of the target-mediated drug disposition model and identifiability of model parameters. J Pharmacokinet Pharmacodyn. 2008;35(5):573–91. doi:https://doi.org/10.1007/s10928-008-9102-8.
- Nguyen DL, Limketkai B, Medici V, Saire Mendoza M, Palmer L, Bechtold M. Nutritional strategies in the management of adult patients with inflammatory bowel disease: dietary considerations from active disease to disease remission. Curr Gastroenterol Rep. 2016;18(10):55. doi:https://doi.org/10.1007/s11894-016-0527-8.