
ABSTRACT
Rapid release of biopharmaceutical products enables a more efficient drug manufacturing process. Multi-attribute methods that target several product quality attributes (PQAs) at one time are an essential pillar of the rapid-release strategy. The novel, high-throughput, and nondestructive multi-attribute Raman spectroscopy (MARS) method combines Raman spectroscopy, design of experiments, and multivariate data analysis (MVDA). MARS allows the measurement of multiple PQAs for formulated protein therapeutics without sample preparation from a single spectroscopic scan. Variable importance in projection analysis is used to associate the chemical and spectral basis of targeted PQAs, which assists in model interpretation and selection. This study shows the feasibility of MARS for the measurement of both protein purity-related and formulation-related PQAs; measurements of protein concentration, osmolality, and some formulation additives were achieved by a generic multiproduct model for various protein products containing the same formulation components. MARS demonstrates the potential to be a powerful methodology to improve the efficiency of biopharmaceutical development and manufacturing, as it features fast turnaround time, good robustness, less human intervention, and potential for automation.
Introduction
Formulated protein therapeutics make up the largest and fastest growing therapeutic market in the past two decades.Citation1,Citation2 Increases in product development costs, loss of revenue to emerging biosimilars and growing diversity of therapeutic formats have placed increasing pressure on biomanufacturing to be more cost-efficient and productive.Citation3 A typical quality control (QC) system for a formulated protein therapeutic comprises a panel of assays, with each responsible for monitoring product quality attributes (PQAs) for release and stability () and all labor intensive, time consuming, and cost ineffective. Advanced analytical solutions are needed to increase efficiency and enable cost-effective monitoring of PQAs throughout the lifecycle of a product while still ensuring desired product quality.
Table 1. Feasibility assessment of using MARS for measuring the PQAs on a typical control system of formulated monoclonal antibody therapeutics
One well-known rapidly emerging analytical technique for PQA monitoring of therapeutic proteins is the liquid chromatography mass spectrometry (LC-MS)-based multi-attribute method (MAM).Citation4,Citation5 MAM allows the characterization and relative quantification of multiple post-translational modifications in a single MS run, thus offering higher specificity and efficiency for PQA monitoring during the biomanufacturing process than existing methods. MAM is used at different development stages and process steps to enable a better understanding of the impact of process parameters on PQAs. While the LC/MS-based MAM has demonstrated the value of using multi-attribute methods for protein therapeutics, it cannot measure all required PQAs in biopharmaceutical production, thus motivating the development of additional complementary multi-attribute analytical techniques.
Raman spectroscopy has the potential to be a valuable multi-attribute method for characterizing biotherapeutics.Citation6 Raman spectroscopy is a nondestructive vibrational spectroscopic method that requires little to no sample preparation and is suitable for measuring aqueous samples. Raman spectroscopy measures the energy of the inelastic scattering of photons by analytes. The wavelength shifts from the excitation wavelength of a monochromatic light source correlate to the vibrational energies of chemical bonds. A molecule can have multiple vibrational modes, each causing characteristic scattering and resulting in multiple Raman peaks that provide rich spectral information. Raman spectroscopy can simultaneously quantify the components of mixtures and provide insight into sample composition, structure, and conformation of analytes.Citation7,Citation8 The relationship between all the components with Raman responses and each wavenumber measurement in the Raman spectra can be modeled by multivariate data analysis (MVDA), which enables the predictions of multiple analytes or attributes in a complex mixture through the acquisition of a single spectrum.Citation9–11
In biopharmaceutical development, Raman spectroscopy is increasingly being used as a process analytical technology (PAT) for bioprocess monitoring,Citation6,Citation12,Citation13 with many established applications such as evaluating the components of the cell culture media,Citation14,Citation15 glucose and lactate concentration,Citation16,Citation17 antibody titer,Citation18 and glycan occupancy.Citation19 Raman spectroscopy has also been used to evaluate protein product identification,Citation20,Citation21 protein aggregation,Citation22–24 protein oxidation,Citation25 and protein–protein interaction,Citation26 as well as for stressed material characterization.Citation27 McAvan et al. demonstrated the capability of using Raman spectroscopy to differentiate between force-degraded monoclonal antibody with different levels of PTMs.Citation28 While Raman spectroscopy has been implemented as a quality control (QC) method in small-molecule drug development and manufacturing,Citation29–32 and as a PAT and protein characterization tool in biopharmaceutical development, there is limited information regarding extensive PQA monitoring in formulated protein therapeutics using Raman spectroscopy because of the complexity of decoupling all the formulation components (i.e., protein and excipients) in the Raman spectra. As an example, shows a representative spectrum acquired from a formulated monoclonal antibody therapeutic, mAb A, at the concentration of 30 mg/mL along with the individual spectra of each formulation component (20 mM histidine acetate, 240 mM sucrose, 0.06% polysorbate 20 (PS20), and 10 mM methionine). The convoluted fingerprint of all spectral contributions from the protein and formulation components shown in the spectrum makes it extremely challenging to identify a single peak correlated with a specific PQA. Therefore, as with other spectroscopic methods, MVDA models are required when using Raman spectroscopy to predict certain PQAs in a complex system such as a formulated protein.
Figure 1. (a) Sample Raman spectra for a formulated protein (red) at 30 mg/mL concentration and all formulation components, including 20 mM histidine acetate (green), 240 mM sucrose (blue), 10 mM methionine (yellow), and 0.06% (w/v) PS20 (purple) in the finger-printing region. (b) The overall workflow of developing, validating and application of the MARS method. (c) Experimental design process of MARS for formulated protein
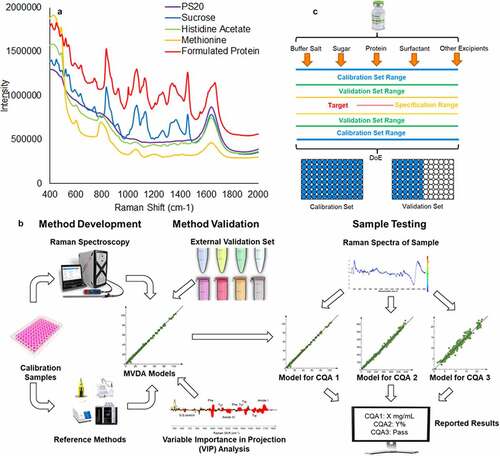
The aim of this study was to explore the potential of Raman spectroscopy as a new type of multi-attribute method for PQA monitoring in formulated protein therapeutics. A novel multi-attribute Raman spectroscopy (MARS) workflow (shown in ) was developed to measure and characterize multiple PQAs. Both the feasibility and limitations of using Raman spectroscopy combined with MVDA as an alternative to the methods currently used for characterization and quantification of a variety of PQAs (), including formulation components and post-translational modifications (PTMs) were assessed.
Results
MARS method optimization
The method optimization of MARS was performed on a set of mAb A samples (N = 55) with various levels of protein aggregation. Three factors, acquisition method optimization, reference method variability assessment, and preprocessing method optimization, were studied. Increasing total acquisition time improves the signal-to-noise ratio of the spectra. As shown in , the noise level reduces, while the number of scans increases. The partial least square (PLS) model on protein aggregation shows that the increasing number of scans also improves the model predictivity (). Therefore, all subsequent measurements were generated using averaged spectra of 90 scans, resulting in an analysis time of 22.5 minutes for each sample.
Figure 2. Optimization of the MARS method. (a) Heat map of absolute difference in intensity between each cumulative spectrum and the 90-scan spectrum with 15 s exposure per scan. The color scale indicates the magnitude of variability when compared to the longest acquisition spectrum at each wavenumber. Arbitrary units apply to the intensity after normalization and differentiation. (b) Root Mean Square Error from cross-validation (RMSEcv) plot compares the prediction ability of models with different acquisition times in the units of the product quality attribute. Statistics are shown for models generated from spectra with between 10 and 90 scans. (c) Observed values vs. predicted values of the response variable (Blue: data from measurement 1; Red: data from measurement 2). (d) RMSEcv based on the best PLS models using data only from measurement 1, data only from measurement 2, or combined data set in the units of protein aggregation. (e) Comparison of overlaid preprocessed spectra without (top) and with (bottom) first-order derivative. The color of the spectra indicates the concentration of the PS20. The bias between two instruments were eliminated with first-order derivative filter
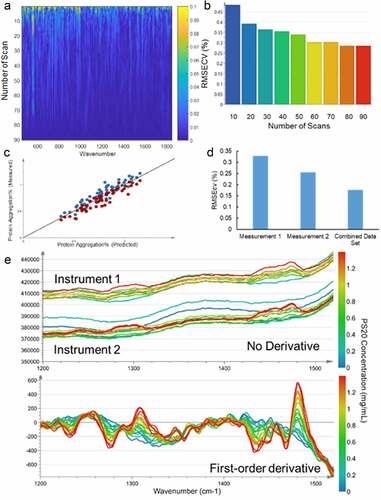
The variability of the reference methods significantly affect the model quality. While 15% differences in HMW forms was observed for the same sample between the duplicate measurements by size-exclusion chromatography (SEC) (), including both sets of SEC assay data into the model incorporated assay variability and reduced both Q2 and Root Mean Square Error from cross-validation (RMSEcv) (). The predictive power of the model depends on not only the size of the calibration set and the quality of the Raman spectra but also on the accuracy of the reference method values. Therefore, to improve the method quality, the mean values of duplicate reference method measurements were used for all the MARS models.
The preprocessing of the Raman spectra includes multiple filters such as the second-order Savitzky-Golay (SG) smoothingCitation33 for noise reduction, followed by standard normal deviation (SNV) for normalization, and finally a first-order derivative filter. The first-order derivative reduces the risk from the systematic offset in baseline between instruments, which is essential for low abundant excipients, such as PS20 and N-acetyl tryptophan (NAT). As shown in , a significant bias between two Raman instruments is observed with a set of PS20 solution range from 0 to 1.2 mg/mL without derivative filter. After treating with a first-order derivative filter, the same set of data shows a good correlation between signal intensity and PS20 concentration.
Multiproduct MARS assessment on quantitation of formulation-related PQAs
From the calibration set composed of 384 samples from five protein molecules, three samples were excluded as outliers during the principal component analysis (PCA) analysis. The remaining samples demonstrated that the multiproduct model is appropriate for measuring protein concentration, osmolality, and methionine concentration from cross validation and an external validation set of 55 samples. However, the multiproduct model is not appropriate for measuring pH and PS20 due to protein interference.
Protein concentration, osmolality, and methionine concentration
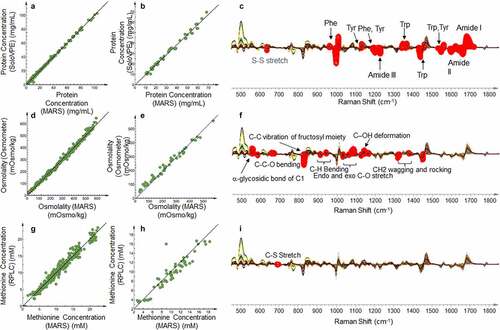
Among the PQAs assessed, protein concentration (), osmolality () and methionine concentration () correlate well with Raman spectra. Models for each attribute featured high R2Y and Q2, low RMSEcv for the calibration set, and low root mean square error of prediction (RMSEP) for the validation set (Table S1). Prediction scores and Hotelling’s T2 of validation set shown in Figure S1A and S1B are helpful tools in identifying outliers and flagging potential errors occurred during the measurement. The outlier identified from Figure S1B is shown to be a true outlier from a failed acquisition of the spectrum (Figure S1C). The Raman shifts with major contributions to the protein concentration model as identified through variable importance in projection (VIP) analysis are those associated with amide backbones, aromatic amino acids (Tyr, Phe and Trp), and disulfide bonds (), which are chemical structures unique to proteins. For osmolality, the contributing Raman shifts observed correspond to the C–O and C–C bond vibrations of sucrose (), which is the major contributor to osmolality in this formulation condition. The peak at 702 cm−1 is the only region showing significant contributions in the methionine model, which corresponds to the unique C–S stretch of methionine ().
Figure 3. Multiproduct PLS model based on the Raman spectra of formulation-related PQAs. (a) Correlation between MARS and protein concentration in the calibration set through PLS model. (b) Correlation between MARS and protein concentration in the validation set through PLS model. (c) Overlaid pre-processed Raman spectra of all the calibration samples. Red circles highlight the wavenumbers with the highest VIP weight of protein concentration in the model shown in Figure 3a and labeled with the identified chemical structure. (d) Correlation between MARS and osmolality in the calibration set through PLS model. (e) Correlation between MARS and osmolality in the validation set through PLS model. (f) Overlaid pre-processed Raman spectra of all the calibration samples. Red circles highlight the wavenumbers with the highest VIP weight of osmolality in the model shown in Figure 3d and labeled with the identified chemical structure. (g) Correlation between MARS and free methionine concentration in the calibration set through PLS model. (h) Correlation between MARS and free methionine in the validation set through PLS model. (i) Overlaid pre-processed Raman spectra of all the calibration samples. Red circles highlight the wavenumbers with the highest VIP weight of free methionine in the model shown in Figure 3g and labeled with the identified chemical structure
pH and PS20
The models of pH and PS20 concentration show good correlation with high R2Y and Q2 (both >0.85) for the calibration set (Figure S2A and S3A) but failed in predictions for validation-set samples containing proteins not included in the calibration set (Figure S2B and S3B). The RMSEP is significantly higher than RMSEcv for these two PQAs in the multiproduct model (Table S1). In the PLS model, pH is measured by protonated and deprotonated pairs of histidine (Figure S2C). PS20 can be distinguished by the CH2 rocking from the alkyl chain in the polymer (Figure S3C). Both pH and PS20 models predict moderately well for samples containing proteins within the calibration set, but predict poorly for those containing proteins outside the calibration set, which strongly supports the existence of protein interference due to variations in the levels of histidine and CH2 groups present in different proteins. In addition, proteins acting as buffering agents also contribute to the pH model, which can cause interference.Citation34 The protein interference observed for pH and PS20 concentration affects the predictability of the models and resulted in failure of the multiproduct approach for both PQAs. Therefore, we performed a product-specific study to assess the feasibility of using MARS to measure pH and the concentration of low abundant formulation excipients like PS20.
Product-specific MARS assessment on quantitation of formulation-related PQAs
Product-specific model parameters were explored to determine whether improvements in the model performance for some PQAs were possible. First, for all concentration-related PQAs, the reference methods were switched from assay measurement to theoretical values calculated by the dilution because of the assay variability observed with some reference methods. Sample-size planning is another important aspect of any MVDA method.Citation35 To determine the most cost-effective calibration sample set size, the data in the previous multi-product model study (N = 384) was used to create and evaluate models using mini-calibration sets through the following 4-step procedure: 1) Randomly create a mini-calibration set of predefined size from a subset of the multiproduct dataset; 2) Build PLS models to predict protein concentration, osmolality, pH, and methionine concentration using the mini-calibration set; 3) Repeat Steps 1 and 2 for 14 different levels of mini-calibration set size; and 4) Calculate the RMSEcv for each PLS model and plot the RMSEcv as a function of the number of calibration samples. As shown in Figure S4, the flattened RMSEcv curve illustrates that significantly diminishing returns in decreasing RMSEcv occur typically above 100 samples. Based on this observation, a cost-effective calibration set size of 96 samples and a validation set size of 48 samples were chosen for the product-specific study.Citation36 Compared to the multiproduct study, this study included assessment of an additional buffer component, N-acetyl tryptophan (NAT) that was added to the formulation as an anti-oxidant.Citation37 By narrowing the study parameter ranges, the calibration set samples were closer to the target formulation condition of the molecule, and thus better model accuracy could be achieved.
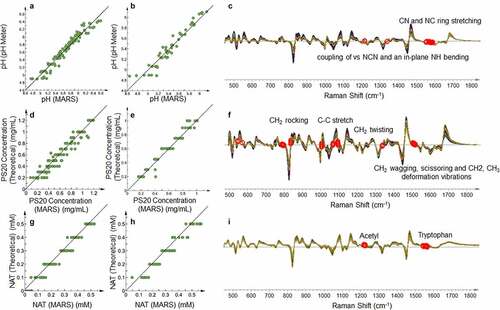
The product-specific PLS models performed well for the prediction of protein concentration and osmolality (Figures S5 and S6) with improved accuracy compared to the multiproduct models (Table S2). For pH, PS20 concentration and NAT concentration, the product-specific PLS models demonstrate good correlation and accuracy (). The statistical properties of the product-specific PLS models are summarized in Table S2, with RMSEcv and RMSEP close to or lower than the variability of the current reference method. The plot of prediction scores and Hotelling’s T2 of validation set is shown in Figure S7A and S7B, with no outlier identified. In this experiment, the target pH (5.8) was close to the pKa2 of histidine (6.0); thus, the histidine in solution was present in its both protonated and deprotonated forms. The pH of the solution is related to the abundance of both forms, which appear in the Raman spectra corresponding to spectral changes at 1600 cm−1 due to the imidazole ring stretch ().Citation38,Citation39 Multiple spectral regions have significant contributions in the PS20 model, which align with the pure PS20 spectra described in prior studies.Citation40,Citation41 The region of 1000–1700 cm−1 corresponding to C–C and C–H vibrations from the alkyl chain did not contribute significantly to the multiproduct model, but contributes strongly in the product-specific model because of the interference from the amide peaks from the protein backbone (). The characteristic Raman peaks of tryptophan around 1580 cm−1 and the acetyl group around 1215 cm−1 are heavily weighted in the PLS model for NAT concentration (). The tryptophan peak corresponds to the tryptophan portion of NAT’s structure and the acetyl group peak differentiates free NAT in solution from the tryptophan residues in the protein.
Figure 4. Product-specific PLS model based on the Raman spectra of formulation-related PQAs. (a) Correlation between MARS and pH in the calibration set through PLS model. (b) Correlation between MARS and pH in the validation set through PLS model. (c) Overlaid pre-processed Raman spectra of all the calibration samples. Red circles highlight the wavenumbers with the highest VIP weight of pH in the model shown in Figure 4a and labeled with the identified chemical structure. (d) Correlation between MARS and PS20 concentration in the calibration set through PLS model. (e) Correlation between MARS and PS20 concentration in the validation set through PLS model. (f) Overlaid pre-processed Raman spectra of all the calibration samples. Red circles highlight the wavenumbers with the highest VIP weight of PS20 concentration in the model shown in Figure 4d and labeled with the identified chemical structure. (g) Correlation between MARS and n-acetyltryptophan (NAT) concentration in the calibration set through PLS model. (h) Correlation between MARS and NAT in the validation set through PLS model. (i) Overlaid pre-processed Raman spectra of all the calibration samples. Red circles highlight the wavenumbers with the highest VIP weight of NAT concentration in the model shown in Figure 4g and labeled with the identified chemical structure
Product-specific MARS assessment on characterizing protein purity-related PQAs
The overall PLS model performances of using MARS for protein purity-related PQAs are summarized in Table S3. The five pure stressed materials were originally included in the sample set, but identified as outliers during the PCA. Thus, the pure stressed materials are not included in the PLS modeling. For size variants, good correlations with R2Y > 0.85 and Q2 > 0.75 (Table S3) between measurements by MARS and SEC were shown in PLS models for both protein aggregation and fragmentation ( and c). Within this dataset, there are multiple mechanisms of protein aggregation, including nucleation dominated, chain polymerization, and associated polymerization, which might cause change in multiple regions on the Raman spectra.Citation24 In this experiment, since the dominant form of aggregate is dimer, the primary mechanism of aggregate formation is nucleation dominated. The amide III region near 1200 cm−1 corresponds to the formation of the β-sheet.Citation42 The disulfide structural change reflected in the region between 500 and 700 cm−1 is expected during the formation of the protein aggregation ().Citation42,Citation43 The heat-induced aggregation from thermal stress leads to higher-order structure change, which leads to the spectral changes associated with C–H deformation at around 1320 cm−1, C=N stretching at 1450 cm−1, and phenylalanine (Phe) near 1000 cm−1.Citation23,Citation44 The region between 770 and 900 cm−1 was also found to be critical for detecting protein aggregation formation with tyrosine (Tyr)- and tryptophan (Trp)-associated Raman shifts, especially aggregation changes related to protein folding and unfolding.Citation22,Citation28,Citation44,Citation45 Protein fragments measured by SEC also correlated well with Raman spectra (). Protein fragments detected by SEC are primarily attributed to antibody antigen-binding and Fc domains, which are captured in the Raman spectra as the C–S stretch band between 650 and 700 cm−1, indicating disulfide reduction and protein higher-order structure changes reflected in the amide I region and other regions associated with multiple aromatic amino acids.
Figure 5. Product-specific PLS model based on the Raman spectra of protein purity-related PQAs. (a) Correlation between MARS in PLS prediction and protein aggregation measured by size exclusion chromatography (SEC). (b) Overlaid pre-processed Raman spectra of all the calibration samples. Red circles highlight the wavenumbers with the highest VIP weight of protein aggregation in the model shown in Figure 5a and labeled with the identified chemical structure. (c) Correlation between MARS in PLS prediction and protein fragments measured by SEC. (d) Overlaid pre-processed Raman spectra of all the calibration samples. Red circles highlight the wavenumbers with the highest VIP weight of protein fragments in the model shown in Figure 5c and labeled with the identified chemical structure. (e) Correlation between MARS in PLS prediction and protein oxidation measured by reversed-phase liquid chromatography (RPLC). (f) Overlaid pre-processed Raman spectra of all the calibration samples. Red circles highlight the wavenumbers with the highest VIP weight of protein oxidation in the model shown in Figure 5e and labeled with the identified chemical structure
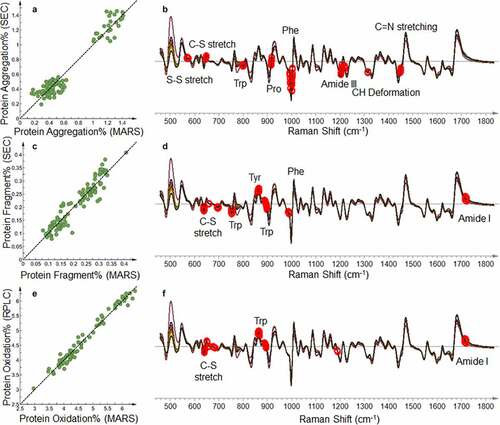
The oxidation level measured by MARS correlates well with the protein oxidation level measured by RPLC (, Table S3). The oxidation model showed strong dependence on the 702 cm−1 band associated with the C–S stretch, which indicates Raman spectroscopy is capable of probing methionine oxidation in proteins as shown in prior literature.Citation25 In addition, the highly weighted tryptophan peak near 880 cm−1 corresponds to changes in the hydrogen bonds in tryptophan, which indicates that tryptophan is oxidized through radical reactions during 2,2ʹ-azobis(2-amidinopropane) dihydrochloride (AAPH) and light stress.Citation28,Citation46
Charge variants and glycosylation variants show poor correlation to Raman spectra (Figures S8 and S9, Table S3). The R2Y and Q2 are both low for all charge and glycan PQAs. The charge variants contain a variety of protein modifications, including deamidation, isomerization, glycation in acidic variants and C-terminal lysine, and terminal valine-histidine-serine in basic variants and potential protein conformational variants. Decoupling all of the different types of modifications separated by ion-exchange chromatography or imaged capillary isoelectric focusing may require a much larger sample set or may be impossible using MARS. The basic variants have relatively better correlation, which may come from their more defined components (e.g., C-terminal lysine). For glycosylation variants, the current benchtop Raman spectroscopic system might not have sufficient sensitivity to distinguish different structural compositions of the complex glycan structure. In addition, the chemical bonds in glycan could be heavily outweighed by protein and sucrose in the formulation. Therefore, MARS is not a suitable method for measuring the charge and glycosylation variants for protein therapeutics, while LC/MS-based MAM is a more suitable method for that purpose.
Discussion
As shown in the results, MARS demonstrates the capability of quantitatively measuring multiple formulated protein PQAs within a single method and has the potential to be used for biopharmaceutical applications. The development of the MARS method follows the near IR (NIR) guidance documents from the U.S. Food and Drug Administration and European Medicines Agency to fulfill the industrial requirements for method validation because MARS and NIR are both spectroscopy-based chemometirc quantitation methods.Citation47,Citation48 Risk assessment for using MARS in place of an existing method will be required for each PQA based on the circumstance of the usage. In this study, the feasibility of MARS was assessed by demonstrating the method comparability with the existing method and validating the MVDA model.
The model validation is a critical step to ensure model reliability, robustness, and equivalence to the reference method. PLS models are prone to over‐fitting, which may overestimate their predictive ability. During the MARS method development, multiple approaches were taken to ensure the models are not over-fitted.
First, during the calibration set design, the DOE approach was applied to both calibration and validation sets. This approach was used to reduce the chances of interference between PQAs. In the formulation-related PQA studies, since each component is relatively orthogonal, the specificity and robustness of the model were improved by co-varying all formulation components to fill the multi-dimensional design space. In the protein purity-related PQA studies, different stressed materials were included to cover various degradation pathways.
During the MVDA method development, the number of components (N) in each PLS model were determined by maximizing the Q2, which first increases then decrease as N increases. In most of our models except one, the N is close to or less than 10. Permutation tests with 100 permutations were performed for all the models. The permutation plots (Figures S10, S11, and S12) demonstrate that the models are founded and robust, as all blue Q2 values to the left are lower than the original points to the right, and the blue regression line of the Q2 points intersects the vertical axis (on the left) at or below zero. Finally, the models to be used for quantitation purposes were validated by predicting an independent set of validation samples. For multi-product models, two proteins outside the calibration set were included in the validation set to assess if the models could be used across different types of proteins with the same buffer platforms. The precision of Raman spectra acquisition was assessed by measuring an unknown sample on both instruments three times to calculate the intermediate precision (Table S4). The method's robustness was evaluated by measuring one mAb and its thermal-stressed form under the same formulation condition to assess the protein interference and by measuring the same sample at reduced laser power (Table S5). These results demonstrate that MARS is precise and robust for quantitation of formulation related PQAs. All the RMSEPs, RMSEcvs, and standard deviations are below or similar to the variability of the reference methods. Therefore, we conclude that the models are validated for use.
These MVDA models were validated both with statistical parameters and by linking the MVDA and physicochemical properties of the PQAs. All the wavenumbers with high contributions in the PLS model were found to align with the expected chemical structure change caused by PQA. In addition, these wavenumbers with high contributions in the MVDA model are close to zero in the pre-processed spectra, which includes a first-order derivative step. Therefore, in the original Raman spectra shown in Figure S13, these regions are PQA-related peaks and correctly picked up during the MVDA. This observation provides strong evidence that MARS is able to differentiate between various formulation components and quantitate the PQAs.
The comparison between MARS and each reference method is essential to demonstrate the feasibility for MARS replacing the existing method. The existing analytical method was used as the reference method in training and validation in the multiproduct study. The comparison between MARS and the existing method was measured by the correlation coefficient of the calibration set and the RMSEP of the validation set. Although Raman spectra acquisition by itself shows good repeatability and intermediate precision, the quality of a MARS model also relies on the accuracy and precision of the reference method. As shown in the multiproduct formulation PQA study, the reference methods with high accuracy and precision showed a good MARS model (e.g., SoloVPE method for protein concentration); reference methods with relative high variability show a low-quality MARS model with high number of components and low predictivity (e.g., HPLC-ELSD method for PS20 concentration).
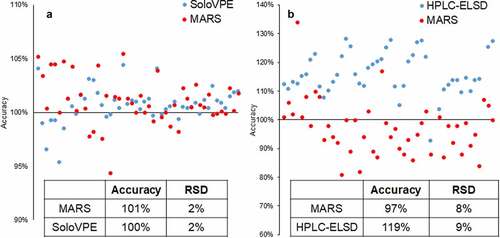
The quality of the MARS model for PS20 concentration was improved by using volumetric calculation as the reference method. Since the theoretical calculated value was used as a reference in the product-specific model development, the existing method and MARS were used on the same set of qualification samples to demonstrate method comparability. The comparison between MARS and the existing methods is demonstrated by the two-sided t-test (TOST) method with a predefined maximum allowable difference (MAD), which is based on the current method accuracy, precision, and product specification. As two examples shown in , the TOST test shows MARS is comparable with SoloVPE and HPLC-ELSD for measuring protein concentration and PS20 concentration, respectively, at a confidence level of 99%. These results demonstrate the advantage of using volumetric calculation as an alternative reference value in certain circumstances, while the accuracy or precision of the reference methods may be impacted by matrix effects. However, the volumetric calculation also has its own limitation on the reliability of stock solution concentration and pipetting accuracy of the automated platform. For each product and PQA, a case-by-case assessment needs to be performed on the choice of reference method.
Figure 6. Method comparison between MARS and existing analytical method with the product-specific models (N = 48). (a) Method comparison between MARS and SoloVPE for protein concentration. MARS performance is comparable with SoloVPE (b) Method comparison between MARS and HPLC-ELSD for PS20 concentration. MARS shows superior accuracy to HPLC-ELSD
In summary, we report here the development of a rapid, noninvasive MARS method for protein therapeutic testing. By combining Raman spectroscopy and MVDA, MARS can evaluate the relationship between PQAs and individual Raman shifts, and measure multiple PQAs of formulated protein therapeutics in one single acquisition. VIP analysis is used to identify the spectral basis of the PQA measurements based on the weights of each statistical MVDA model, providing a chemical basis for interpretation of models that are traditionally characterized purely by statistical methods. Initial feasibility studies indicate that MARS can quantitate protein concentration, osmolality, pH, PS20 concentration, methionine concentration, and NAT concentration methods and potentially be used in place of existing method for these PQAs. MARS also shows substantial potential as a tool for characterizing protein modification-related PQAs, including aggregation, fragmentation, and oxidation. MARS could potentially be a good complementary method comparing with LC/MS peptide map-based MAM for the testing of formulated protein therapeutics by measuring the formulation- and size-related quality attributes that LC/MS peptide map-based MAM cannot measure. In addition, MARS provides a holistic overview of formulated protein under native state, while LC/MS peptide map-based MAM examines detailed post-translational modifications of protein down to single amino acid level. We believe continuous technology development will enable MARS to characterize protein therapeutics noninvasively under native conditions and replace multiple existing QC assays, thereby potentially saving substantial costs and resources for biopharmaceutical development and manufacturing and shorten the testing time by several days. With the parallel technology advance to speed up the biological assays such as bioactivity and bioburden, the multi-attribute methods and rapid biologic testing can form a complete landscape of rapid release of protein therapeutics.
Materials and methods
Materials
The proteins used in this study were manufactured through the Chinese hamster ovary (CHO) cell culture process followed by downstream purification at Genentech Inc. (South San Francisco, CA, USA).Citation49 Five stressed proteins (AAPH oxidation, low pH, high pH, light, and thermal stresses) were prepared in the Pharmaceutical Development department at Genentech (South San Francisco, CA, USA). All other chemicals and reagents were purchased from MilliporeSigma (Burlington, MA, USA).
MARS data acquisition and data analysis
All Raman spectroscopic analyses were carried out using two Kaiser RamanRXN2 instruments (Kaiser Optics, Ann Arbor, MI, USA) with identical setup. Both instruments were equipped with a 785 nm excitation laser source with the laser power at its maximum output, 400 mW. A sample volume of 200 μL of formulated protein without any sample preparation was loaded into a 500 μL quartz cuvette with a 10 mm light path (Hellma Analytics, Plainview, NY, USA) and placed inside the enclosed sample compartment (Kaiser Optics, Ann Arbor, MI, USA). The laser power in the sample ranges between 200 and 250 mW on different instruments. The scattered light was detected by a contactless RamanRXN probe with a NCO-0.4-NIR optic. The distance between the probe and cuvette and focal plane was optimized prior to the experiment to maximize the signal. The laser was controlled by Invictus Laser control. Spectra in the range of 150–3425 cm−1 were acquired with a 1 cm−1 resampling interval. Each spectrum was collected for 22.5 minutes (90 scans of 15 second exposure time per scan) with cosmic ray correction with iCRaman (Kaiser Optics, Ann Arbor, MI, USA). Additional experimental details of the optimization of the acquisition method are included in Supplemental material S1.1.
The spectral data were exported and aligned with the reference method results through an R scriptCitation50 developed in-house. MVDA was carried out using SIMCA Version 15.0.2 (Sartorius Stedim, UMEA, Sweden). The outliers were identified by PCA and the quantitative model was established by PLS regression. The VIP analysis was used for spectral interpretation and identification of key Raman wavenumber shifts, which correspond to chemical bond changes in the PQA. Both cross validation and external validation were used to validate the quantitative models. Additional experimental details of data analysis are included in Supplemental material S1.2.
Feasibility assessment of MARS on measuring the PQAs for formulated protein therapeutics
To assess the feasibility of MARS to measure protein PQAs, several studies were performed to evaluate all the PQAs that Raman spectroscopy has the potential to detect (). Formulation-related PQAs and purity-related PQAs were split into two individual studies to decrease the number of samples to fill the design space of the training model to a reasonable size. In the formulation-related PQA study, both multi-product study and product-specific study were performed.
DOEs were used to introduce sufficient variation and prevent interference between PQAs. The experimental design concepts are summarized in . For each component, the range of the validation set was designed to cover the desired specification and the range of the calibration set was designed to cover the validation range (). The calibration and validation sets were generated based on DOE methodology with custom design using JMP 11 software (SAS Institute, Cary, NC, USA).
Table 2. Experimental Design of the Multiproduct Models for the protein formulation PQAs
Table 3. Experimental design of the product-specific models for the protein formulation PQAs
To assess the feasibility of using MARS to quantitate formulation-related PQAs, one multi-product study and one product-specific study were performed at the target formulation of 20 mM histidine acetate, 240 mM sucrose, 10 mM methionine, and 0.06% (w/v) PS20, with protein concentrations between 0 and 100 mg/mL and pH between 5–6 selected. The assessed formulation-related PQAs were protein concentration, osmolality, pH, PS20 concentration, methionine concentration, and NAT concentration. Supplemental material S2.1 and show the detailed design of the multi-product study and Supplemental material S2.2 and show the detailed design of the product-specific study. Although both designs target the same formulation platform in this study, formulations from other buffer systems should follow the same concept and methodology for the experimental design.
To assess the feasibility of using MARS to characterize purity-related PQAs, four representative categories of the protein purity-related PQAs were assessed: size variants, charge variants, glycosylation variants, and oxidation variants. Supplemental material S2.3 shows the detailed designs of protein purity-related PQA studies. The purity-related PQAs were only assessed on the product-specific model because the complex structural heterogeneity of monoclonal antibody product variants made the multi-product model almost impossible.
Supplemental Material
Download MS Word (2.7 MB)Acknowledgments
The authors thank Feng Yang, Lorenz Liesum and David Michels for their critical review and helpful suggestions, and Theo Koulis for his review, suggestions, and input in statistics. We thank Aine McGorvern for her review and revision on the manuscript. The authors also thank Cindy Quan, Feng Yang, David Michels, Matthew Kalo, John Stults, Vikas Sharma, John Joly and Guoying Jiang for their support on the project.
Funding
This work is funded by Genentech and Roche.
Disclosure statement
No potential conflict of interest was reported by the author(s).
Supplementary material
Supplemental data for this article can be accessed on the publisher’s website
References
- de la Torre BG, Albericio F. The pharmaceutical industry in 2018. An analysis of FDA drug approvals from the perspective of molecules. Molecules. 2019;24(4):809. doi:10.3390/molecules24040809.
- Grilo AL, Mantalaris A. The increasingly human and profitable monoclonal antibody market. Trends Biotechnol. 2019;37(1):9–12. doi:10.1016/j.tibtech.2018.05.014.
- Gottschalk U, Brorson K, Shukla AA. The need for innovation in biomanufacturing. Nat Biotechnol. 2012;30(6):489–92. doi:10.1038/nbt.2263.
- Rogers RS, Nightlinger NS, Livingston B, Campbell P, Bailey R, Balland A. Development of a quantitative mass spectrometry multi-attribute method for characterization, quality control testing and disposition of biologics. MAbs. 2015;7(5):881–90. doi:10.1080/19420862.2015.1069454.
- Rogers RS, Abernathy M, Richardson DD, Rouse JC, Sperry JB, Swann P, Wypych, J, Yu, C, Zang, L, and Deshpande, R, et al. AView on the importance of “Multi-Attribute Method” for measuring purity of biopharmaceuticals and improving overall control strategy. Aaps J . 2018;20(1):1–8.
- Wen ZQ, Cao XL, Li GY, Ren D. Industrial application of raman spectroscopy in protein pharmaceutical manufacturing. Aip Conf Proc. 2010;1267:718–19.
- Krishnan RS, Shankar RK. Raman effect - History of the discovery. J Raman Spectrosc. 1981;10:1–8. doi:10.1002/jrs.1250100103.
- Raman CV, Krishnan KS. A new type of secondary radiation. Nature. 1928;121:501–02. doi:10.1038/121501c0.
- Goetz MJ Jr., Cote GL, Erckens R, March W, Motamedi M. Application of a multivariate technique to Raman spectra for quantification of body chemicals. IEEE Trans Biomed Eng. 1995;42(7):728–31. doi:10.1109/10.391172.
- Rohleder D, Kiefer W, Petrich W. Quantitative analysis of serum and serum ultrafiltrate by means of Raman spectroscopy. Analyst. 2004;129(10):906–11. doi:10.1039/b408927h.
- Wei D, Chen S, Liu Q. Review of fluorescence suppression techniques in Raman Spectroscopy. Appl Spectrosc Rev. 2015;50(5):387–406. doi:10.1080/05704928.2014.999936.
- Esmonde-White KA, Cuellar M, Uerpmann C, Lenain B, Lewis IR. Raman spectroscopy as a process analytical technology for pharmaceutical manufacturing and bioprocessing. Anal Bioanal Chem. 2017;409(3):637–49. doi:10.1007/s00216-016-9824-1.
- Ashton L, Xu Y, Brewster VL, Cowcher DP, Sellick CA, Dickson AJ, Stephens GM, Goodacre R. The challenge of applying Raman spectroscopy to monitor recombinant antibody production. Analyst. 2013;138(22):6977–85. doi:10.1039/c3an01341c.
- Li B, Ryan PW, Ray BH, Leister KJ, Sirimuthu NMS, Ryder AG. Rapid characterization and quality control of complex cell culture media solutions using raman spectroscopy and chemometrics. Biotechnol Bioeng. 2010;107(2):290–301. doi:10.1002/bit.22813.
- Abu-Absi NR, Kenty BM, Cuellar ME, Borys MC, Sakhamuri S, Strachan DJ, Hausladen MC, Li ZJ. Real time monitoring of multiple parameters in mammalian cell culture bioreactors using an in-line Raman spectroscopy probe. Biotechnol Bioeng. 2011;108(5):1215–21. doi:10.1002/bit.23023.
- Kozma B, Hirsch E, Gergely S, Parta L, Pataki H, Salgo A. On-line prediction of the glucose concentration of CHO cell cultivations by NIR and Raman spectroscopy: comparative scalability test with a shake flask model system. J Pharm Biomed Anal. 2017;145:346–55. doi:10.1016/j.jpba.2017.06.070.
- Shah NC, Lyandres O, Walsh JT Jr., Glucksberg MR, Van Duyne RP. Lactate and sequential lactate-glucose sensing using surface-enhanced Raman spectroscopy. Anal Chem. 2007;79:6927–32. doi:10.1021/ac0704107.
- Andre S, Saint Cristau L, Gaillard S, Devos O, Calvosa E, Duponchel L. In-line and real-time prediction of recombinant antibody titer by in situ Raman spectroscopy. Anal Chim Acta. 2015;892:148–52. doi:10.1016/j.aca.2015.08.050.
- Li MY, Ebel B, Paris C, Chauchard F, Guedon E, Marc A. Real-time monitoring of antibody glycosylation site occupancy by in situ Raman spectroscopy during bioreactor CHO cell cultures. Biotechnol Prog. 2018;34:486–93. doi:10.1002/btpr.2604.
- Paidi SK, Siddhanta S, Strouse R, McGivney JB, Larkin C, Barman I. Rapid identification of biotherapeutics with label-free Raman spectroscopy. Anal Chem. 2016;88:4361–68. doi:10.1021/acs.analchem.5b04794.
- Le LMM, Kegl B, Gramfort A, Marini C, Nguyen D, Cherti M, Tfaili S, Tfayli A, Baillet-Guffroy A, Prognon P, et al. Optimization of classification and regression analysis of four monoclonal antibodies from Raman spectra using collaborative machine learning approach. Talanta. 2018;184:260–65. doi:10.1016/j.talanta.2018.02.109.
- de la Cuesta RG, Goodacre R, Ashton L. Monitoring antibody aggregation in early drug development using raman spectroscopy and perturbation-correlation moving windows. Anal Chem. 2014;86:11133–40.
- Zhang C, Springall JS, Wang X, Barman I. Rapid, quantitative determination of aggregation and particle formation for antibody drug conjugate therapeutics with label-free Raman spectroscopy. Anal Chim Acta. 2019;1081:138–45. doi:10.1016/j.aca.2019.07.007.
- Ettah I, Ashton L. Engaging with Raman spectroscopy to investigate antibody aggregation. Antibodies (Basel). 2018;7. doi:10.3390/antib7030024.
- Balakrishnan G, Barnett GV, Kar SR, Das TK. Detection and identification of the vibrational markers for the quantification of methionine oxidation in therapeutic proteins. Anal Chem. 2018;90(11):6959–66. doi:10.1021/acs.analchem.8b01238.
- Ota C, Noguchi S, Nagatoishi S, Tsumoto K. Assessment of the protein-protein interactions in a highly concentrated antibody solution by using raman spectroscopy. Pharm Res. 2016;33:956–69. doi:10.1007/s11095-015-1842-8.
- Bueno J, Long D, Kauffman JF, Arzhantsev S. Deep-Ultraviolet Resonance Raman (DUVRR) Spectroscopy Of Therapeutic Monoclonal Antibodies Subjected To Thermal Stress. Anal Chem. 2015;87:7880–86. doi:10.1021/acs.analchem.5b01606.
- McAvan BS, Bowsher LA, Powell T, O’Hara JF, Spitali M, Goodacre R, Doig AJ. Raman spectroscopy to monitor post-translational modifications and degradation in monoclonal antibody therapeutics. Anal Chem. 2020;92(15):10381–89. doi:10.1021/acs.analchem.0c00627.
- Degardin K, Roggo Y, Been F, Margot P. Detection and chemical profiling of medicine counterfeits by Raman spectroscopy and chemometrics. Anal Chim Acta. 2011;705(1–2):334–41. doi:10.1016/j.aca.2011.07.043.
- Degardin K, Guillemain A, Roggo Y. Comprehensive study of a handheld Raman spectrometer for the analysis of counterfeits of solid-dosage form medicines. J Spectrosc. 2017;2017:1–13. doi:10.1155/2017/3154035.
- Wabuyele BW, Sotthivirat S, Zhou GX, Ash J, Dhareshwar SS. Dispersive Raman spectroscopy for quantifying amorphous drug content in intact tablets. J Pharm Sci. 2017;106(2):579–88. doi:10.1016/j.xphs.2016.10.014.
- Inoue M, Osada T, Hisada H, Koide T, Fukami T, Roy A, Carriere, J, and Heyler, R. Solid-state quantification of cocrystals in pharmaceutical tablets using transmission low-frequency Raman spectroscopy. Anal Chem. 2019;91(21):13427–32. doi:10.1021/acs.analchem.9b01895.
- Savitzky A, Golay MJ. Smoothing and differentiation of data by simplified least squares procedures. Anal Chem. 1964;36:1627–39. doi:10.1021/ac60214a047.
- Karow AR, Bahrenburg S, Garidel P. Buffer capacity of biologics–from buffer salts to buffering by antibodies. Biotechnol Prog. 2013;29:480–92. doi:10.1002/btpr.1682.
- Ali N, Girnus S, Rosch P, Popp J, Bocklitz T. Sample-size planning for multivariate data: a raman-spectroscopy-based example. Anal Chem. 2018;90(21):12485–92. doi:10.1021/acs.analchem.8b02167.
- Guyon I. A scaling law for the validation-set training-set size ratio. 1997; (AT&T Bell Laboratories)
- Dion MZ, Leiske D, Sharma VK, Zuch de Zafra CL, Salisbury CM. Mitigation of oxidation in therapeutic antibody formulations: a biochemical efficacy and safety evaluation of N-Acetyl-tryptophan and L-methionine. Pharm Res. 2018;35:222. doi:10.1007/s11095-018-2467-5.
- Takeuchi H, Harada I. Normal coordinate analysis of the indole ring. Spectrochim Acta A. 1986;42(9):1069–78. doi:10.1016/0584-8539(86)80021-6.
- Mesu JG, Visser T, Soulimani F, Weckhuysen BM. Infrared and Raman spectroscopic study of pH-induced structural changes of L-histidine in aqueous environment. Vib Spectrosc. 2005;39(1):114–25. doi:10.1016/j.vibspec.2005.01.003.
- Dotlich MA, Giri I. Developing portable Raman spectroscopy methods for identification of raw materials used in pharmaceutical development and manufacturing. Spectroscopy-Us. 2017;32:52–64.
- Saggu M, Liu J, Patel A. Identification of subvisible particles in biopharmaceutical formulations using Raman spectroscopy provides insight into polysorbate 20 degradation pathway. Pharm Res. 2015;32(9):2877–88. doi:10.1007/s11095-015-1670-x.
- Li CH, Li TS. Application of vibrational spectroscopy to the structural characterization of monoclonal antibody and its aggregate. Curr Pharm Biotechno. 2009;10(4):391–99. doi:10.2174/138920109788488950.
- Barnett GV, Qi W, Amin S, Lewis EN, Razinkov VI, Kerwin BA, Liu, Y, and Roberts, CJ. Structural changes and aggregation mechanisms for anti-streptavidin IgG1 at elevated concentration. J Phys Chem B. 2015;119(49):15150–63. doi:10.1021/acs.jpcb.5b08748.
- Ota C, Noguchi S, Tsumoto K. The molecular interaction of a protein in highly concentrated solution investigated by Raman spectroscopy. Biopolymers. 2015;103:237–46.
- Zhou C, Qi W, Lewis EN, Carpenter JF. Concomitant Raman spectroscopy and dynamic light scattering for characterization of therapeutic proteins at high concentrations. Anal Biochem. 2015;472:7–20. doi:10.1016/j.ab.2014.11.016.
- Hensel M, Steurer R, Fichtl J, Elger C, Wedekind F, Petzold A, Schlothauer T, Molhoj M, Reusch D, Bulau P, et al. Identification of potential sites for tryptophan oxidation in recombinant antibodies using tert-butylhydroperoxide and quantitative LC-MS. PLoS One. 2011;6(3):e17708. doi:10.1371/journal.pone.0017708.
- FDA. Development and submission of near infrared analytical procedures-guidance for industry. MD (USA): FDA Office Publisher: Silver Spring; 2015.
- EMA. Guideline on the use of near infrared spectroscopy by the pharmaceutical industry and the data requirements for new submissions and variations. 2014.
- Wurm FM. Production of recombinant protein therapeutics in cultivated mammalian cells. Nat Biotechnol. 2004;22(11):1393–98. doi:10.1038/nbt1026.
- Team RC. R: a language and environment for statistical computing. Vienna (Austria); 2013.