
 ?Mathematical formulae have been encoded as MathML and are displayed in this HTML version using MathJax in order to improve their display. Uncheck the box to turn MathJax off. This feature requires Javascript. Click on a formula to zoom.
ABSTRACT
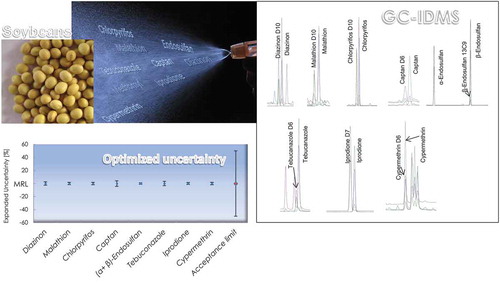
The production of certified reference materials requires the application of highly accurate methods for characterisation. A gas chromatography-isotope dilution mass spectrometry method, setting ambitious performance criteria, was developed for eight selected pesticides in soybeans. Pressurised liquid extraction was followed by automated gel-permeation chromatography and solid-phase extraction clean-up. Pesticides identification respected a Commission Decision and guidelines of the Directorate General for Health and Food Safety (DG SANTE). Reliable quantification involved stable isotopically labelled analogues as internal standards. Validation, according to ISO/IEC 17,025 and DG SANTE guidelines, assessed linearity, LOD/LOQ, trueness, selectivity, precision, stability and robustness. Mean recoveries ranges (83–109%, relative standard deviations < 3%), repeatability (2.2–4.8%), day-to-day variation (0.6–4.2%) and combined uncertainty (1.2–4.2%) were fit for purpose. The method is highly accurate and suitable for certification of the selected pesticides in soybean matrix reference material.
Chemical compounds studied in this article: Diazinon (PubChem CID: 3017); malathion (PubChem CID: 4004); chlorpyrifos (PubChem CID: 2730); captan (PubChem CID: 8606); endosulfan (PubChem CID: 3224); tebuconazole (PubChem CID: 86,102); iprodione (PubChem CID: 37,517); cypermethrin (PubChem CID: 2912).
Graphical Abstract
Introduction
Soybean [Glycine max] is a legume that, together with wheat, rice, corn and potatoes, belongs to the most abundant food and feed crops in the world (Pizzutti I. R. et al. Citation2009). The crop gives high yields and adapts easily to different conditions. The total production of soybean worldwide was 334.9 million tonnes in 2016, the main producers being the USA (35.0%), Brazil (28.8%), Argentina (17.6%), India (4.2%) and China (12.0%) (FAO, Citation2017). The European Union (EU) is the second largest importer (18.9 million tonnes in 2016) after China (86.3 million tonnes in 2010) (FAO, Citation2017). Soybean is applied for industrial and technical applications as cosmetics, textiles, biofuel, etc., but mainly used as food and feed due to its high protein, lipid, vitamin and mineral contents. Far-eastern countries have cultivated and consumed this grain for centuries and, more recently, western countries seek to incorporate soy-based foods into their regular diet, because of its nutritional and nutraceutical benefits including, e.g. alleviating menopausal symptoms and reducing the risk of breast cancer, cardiovascular diseases or osteoporosis (Messina Citation1997; Kumar et al. Citation2006).
Pesticides are widely applied during cultivation to prevent crop damage by fungal diseases, insects, mites, rodents and other pest, and post-harvest to prolong storage life and maintain quality. To minimise risks for consumers, Maximum Residue Levels (MRLs) in food are implemented by different governmental authorities including the EU (European Commission Citation2005; Wu et al. Citation2011). In order to comply with the regulation and to ensure effective consumer protection, accurate, sensitive and fully validated analytical methods are a prerequisite. A repeatability threshold of 20% and trueness estimation, based on recovery experiments, in the range 70–120% are acceptable for methods applied in routine analyses according to the Guidance document by the European Commission (EC) (European Commission Citation2017). However, more stringent performance criteria are needed for analytical methods employed for the assignment of certified values to a reference material (International Organization for Standarisation, Citation2017b).
Reliable determination of pesticides in high fat content vegetables, as soybean, is yet a demanding task due to the low concentration levels to be quantified and the matrix complexity, especially when considering fat-soluble non-polar pesticides, which tend to concentrate in the fat (García-Reyes et al. Citation2007; Gilbert-López et al. Citation2009; David et al. Citation2017). Analytical methods usually involve extraction of the target pesticides, clean-up of the obtained extract and chromatographic tandem mass spectrometry analysis. The most widely used extraction techniques are organic solvent-based by means of liquid-liquid or solid-liquid extraction by high-speed homogeniser, shake-flask, Soxhlet extraction, sonication, microwave-assisted extraction and pressurised liquid extraction (PLE) (Garrido Frenich A. et al. Citation2006; Gilbert-López et al. Citation2009; Wu et al. Citation2011). Although state-of-the-art instrumentation allows the simplification of sample treatment (by dilution of sample extract, for instance), a clean-up step is usually required after extraction, to eliminate the co-extracted lipids and other contaminants from fatty matrices that could interfere in the determination of the target analytes, cause matrix effects and/or damage the chromatographic system (David et al. Citation2017). Gel-permeation chromatography (GPC) and solid-phase extraction (SPE) can be easily semi-automatised, and are probably the most widely applied techniques for cleaning-up the extracts from fatty vegetable samples (Garrido Frenich A. et al. Citation2006; Gilbert-López et al. Citation2009). Extraction of pesticides from soybeans or soy-derived products has been achieved mostly by QuEChERS (standing for Quick, Easy, Cheap, Effective, Rugged and Safe) (Lehotay et al. Citation2010; Wang et al. Citation2013; Huertas Pérez et al. Citation2015; Páleníková et al. Citation2015; Kim et al. Citation2016; May et al. Citation2017). Other sample preparation procedures involved liquid extraction without clean-up (Pizzutti Ionara R. et al. Citation2007; Pizzutti I. R. et al. Citation2009; Domingos Alves et al. Citation2016), or followed by either SPE (Hirahara et al. Citation2005) or d-SPE (Nguyen et al. Citation2010), GPC (Presta et al. Citation2009), disposable pipette extraction (Li et al. Citation2012) or matrix solid-phase dispersion (Maldaner et al. Citation2008).
Current trends in pesticide analysis have focused on liquid chromatography mainly because of the increasing use of polar pesticides; however, GC combined with mass spectrometry (MS) is still an essential tool for the monitoring of these contaminants (Raina-Fulton Citation2015; Villaverde et al. Citation2016). The use of GC is particularly suited to the analysis of volatile and non-polar compounds, and coupled with single quadrupole MS, it is the most widely used technique for pesticide residue determination in fatty vegetables (Alder et al. Citation2006; Gilbert-López et al. Citation2009; Cunha and Fernandes Citation2011; Villaverde et al. Citation2016). Most of the published methods for the determination of pesticides in soybeans or soy products are based on LC-MS/MS (Pizzutti Ionara R. et al. Citation2007; Pizzutti I. R. et al. Citation2009; Lehotay et al. Citation2010; Huertas Pérez et al. Citation2015; Domingos Alves et al. Citation2016; Kim et al. Citation2016; May et al. Citation2017; Viera et al. Citation2017), GC-MS (Hirahara et al. Citation2005; Nguyen et al. Citation2010; Li et al. Citation2012) or GC-MS/MS (Páleníková et al. Citation2015). LC coupled to high resolution MS (LC-HRMS) (Xinyi et al. Citation2007; Wang et al. Citation2013), LC-UV (Maldaner et al. Citation2008) and GC coupled to electron capture detector (Presta et al. Citation2009) have also been applied. One of the key problems in quantitative analysis of pesticide residues in food samples by chromatography hyphenated to MS are the matrix effects, which produce an enhancement or suppression of the target analyte signals in matrix extracts (Erney et al. Citation1997; Hajšlová and Zrostlı́ková Citation2003; LeDoux Citation2011). Different approaches can be followed to eliminate or reduce matrix effect such as a thorough clean-up protocol, use of different injection techniques (i.e. on-column, programmed temperature vaporisation injector or pulsed splitless injector), and compensation by appropriate calibration methods (i.e. matrix matched calibration, analyte protectants, correction factors, standard addition or isotopic dilution mass spectrometry [IDMS]) (Garrido Frenich et al. Citation2009).
Some dedicated methods covering a limited number of pesticides in soybeans or soy-based products provide recoveries close to 100% with a precision close to 5% (Huertas Pérez et al. Citation2015; Kim et al. Citation2016). However, the performance of most aforementioned methods is considered good enough for routine analysis when fulfilling the current EU guidelines for pesticides analysis (recoveries within the range 70–120%, and precision lower than 20%) (May et al. Citation2017), and some pesticides are even out of this specification (Páleníková et al. Citation2015; Domingos Alves et al. Citation2016). Therefore, it is not possible to consider them as sufficiently reliable for the characterisation of a RM, and consequently suitable analytical methods with emphasis on high precision and recovery are needed for this purpose. The goal of this study was to develop and validate a method for the determination of selected pesticides in soybean by GC-MS, with high degree of trueness and low measurement uncertainty. A limited scope of pesticides was selected (diazinon, malathion, chlorpyrifos, captan, α-endosulfan, β-endosulfan, tebuconazole, iprodione and cypermethrin) taking physico-chemical properties, chemical group representativeness, typical difficulty/easiness of analysis, usage frequency and the availability of related commercial isotopically labelled standards into consideration to represent the large variety of pesticides in use nowadays (Sejeroe-Olsen et al. Citation2014). After extraction by PLE, a thorough clean-up was performed by GPC followed by consecutive SPE with C18 and PSA. The analysis was completed by an accurate quantification of all compounds using solvent-based pure calibrant solutions and the application of IDMS. The method is intended to be used in combination with an LC-MS/MS method for the development of a soybeans matrix certified reference material (CRM) (Huertas Pérez et al. Citation2015).
Materials and methods
Chemicals and materials
Calibration standards of diazinon (98.3%), malathion (97.2%), chlorpyrifos (99.5%), captan (99.4%), tebuconazole (99.6%), iprodione (99.3%) and cypermethrin (99.1%) were purchased from Pestanal©, Sigma-Aldrich Co St. Louis (Mo, USA), whereas α- and β-endosulfan (99.0%) were obtained from Dr. Ehrenstorfer (Augsburg, Germany).
Isotopically labelled pesticide analogues employed as internal standards were purchased either as solids, whenever commercially available, or in solution. Diazinon-d10 (diethyl D10, 100 µg mL−1 in acetone, 97.5% isotopic purity), malathion-d10 (diethyl D10, 100 µg mL−1 in acetonitrile, 99.0% isotopic purity), chlorpyrifos-d10 (diethyl D10, solid, 98.0% isotopic purity), captan-d6 (100 µg mL−1 in acetone, 97.0% isotopic purity), tebuconazole-d6 (ethylene D4, methylene D2, 100 µg mL−1 in acetone, 96.5% isotopic purity), iprodione-d7 (isopropyl D7, 100 µg mL−1 in acetonitrile, 99.0% isotopic purity) were obtained from Dr. Ehrenstorfer (Augsburg, Germany). β-endosulfan-13C9 (100 µg mL−1 in nonane, 99% isotopic purity) and cypermethrin (phenoxy-13C6, 100 µg mL−1 in nonane 99% isotopic purity) were purchased from Cambridge Isotopes laboratories, Inc., (Andover, MA, USA).
Toluene, ethyl acetate, cyclohexane, acetonitrile (pesticide quality solvents) were purchased from Merck KGaA (Darmstadt, Germany). Sodium sulphate (≥ 99.0%) and Calflo E (calcium silicate, CaSiO3) used during sample treatment were obtained from Sigma-Aldrich, whereas primary-secondary amine (PSA) and C18 sorbents (100 g, bulk) were provided by Supelco (Bellefonte, PA, USA).
CRM 7509a for pesticides in soybean was obtained from the National Metrology Institute of Japan. Certified values for diazinon and chlorpyrifos in the material are 21.7 ± 3.2 µg/kg and 11.1 ± 3.2 µg/kg, respectively.
Preparation of calibration standards
Individual standard stock solutions of either native or isotopically labelled compounds (ISs) in toluene were prepared gravimetrically at the concentration of approximately 1 mg g−1 and kept in capped amber vials at −20 °C until use. Intermediate stock solutions of native and ISs compounds, were prepared by gravimetrical dilution of each stock solution with toluene to reach a concentration of 4–100 mg kg−1 approximately, depending on the pesticide. These concentration levels were selected according to the MRL allowed by the EU Regulation [10] for each pesticide in soybean matrix. Part of the solution containing the native compounds was further diluted gravimetrically with toluene to a final mass fraction corresponding to 0.2–5 mg kg−1, depending on the pesticide, subsequently mixed with the ISs solution, and finally diluted with toluene to obtain the working standard solutions used for calibration.
Equipment
Pressurised liquid extraction was performed using a Dionex (Sunnyvale, CA, USA) ASE 300 system equipped with an autosampler carousel, solvent controller and a collection tray that allows up to 24 separate samples to be extracted sequentially; 33-mL stainless extraction cells and 60 mL glass collecting vials were used.
The first clean-up step was carried out with a GPC system from J2 Scientific AccuPrep MPS™ (J2 Scientific, Columbia, MO, USA), equipped with an autosampler module with a 24 vial (10 mL) tray, a Series II pump to deliver the solvent, a UV-Vis detector operating at 254 nm detection wavelength and a fraction collector. The column (75 × 25 mm i.d) was packed with Bio-Beads S-X3 (55 g), and the GPC organic mobile phase was cyclohexane–ethyl acetate (1:1, v/v) in isocratic mode at the flow rate of 5 mL min−1. Injection volume was 5 mL.
The GC-MS system consisted of an Agilent 6890N GC system (Agilent Technologies, Waldbronn, Germany), coupled to an Agilent 5973 inert single quadrupole mass-selective detector. Sample extracts were injected by means of a 7683 B series injector autosampler (Agilent Technologies), into an Agilent split/splitless programmed-temperature injector using a 10 µL syringe. The mass spectrometer operated in electron ionisation (EI) mode (electron energy 70 eV). The GC separation was performed using a fused silica DB-5MS capillary column (Phenyl Arylene polymer) as a non-polar stationary phase with a length of 30 m, an internal diameter of 0.25 mm and a film thickness of 0.25 μm (Agilent J&W GC Columns, Folson, CA, USA). Helium 99.9997% (AirLiquid, Belgium) was used as carrier gas at a flow rate of 1 mL min−1.
Sample treatment procedure
Soybeans were acquired in a local market specialised in organic products. A portion of the material was milled and fortified with selected pesticides. In brief, the milling consisted on a prior freezing of approximately 900 g of soybeans with liquid N2, and subsequent milling into a Palla vibrating mill (KHD Humboldt Wedag, Köln, Germany) during 8 min at −180 ºC. The resulting powder was distributed in glass bottles and stored at −20 ºC. The maximum particle size of the soya powder as determined by laser diffraction was 500 µm (Huertas Pérez et al. Citation2015).
PLE extraction procedure
An amount of 5 g soybean powder was weighted in a glass beaker and mixed with 2.5 g of Calflo E inert material using a glass rod. Subsequently, the mixture was loaded on a 33 mL PLE stainless cell and packed tightly. A cellulose micro-filter was placed at one end (bottom) of each cell. Twenty-five mg of the intermediate ISs solution were subsequently added. The cell was allowed to stand open at room temperature, protected from light, for at least 1 h to equilibrate before extraction, and then it was tightly closed for extraction with ethyl acetate at 90 ºC and 2000 psi without pre-heat. Heat and static times were 5 and 10 min, respectively, solvent flush volume was 60% and purge time was 100 s. Under these conditions, quantitative extraction was achieved within 1 cycle. The extract collected in a 60 mL PLE vials was dried by adding approximately 2 g of Na2SO4, transferred to a round flask and evaporated to a small volume (~ 2 mL) on a Büchi rotary evaporator at 40 ºC under vacuum (−240 mbar). The extract was then filtered through a 0.45 µm PTFE syringe filter directly into a 10 mL GPC vial, and diluted to a total volume of approximately 5 mL with cyclohexane/ethyl acetate mixture (1:1, v/v) before injection into the GPC system.
Sample clean-up
In order to isolate target analytes from fat and other matrix compounds, a thorough clean-up of the extract was performed in two steps, first GPC and subsequent SPE.
For this purpose, 5 mL of the extract were injected into the automated GPC system, operated with a mobile phase consisting on cyclohexane–ethyl acetate (1:1, v/v) in isocratic mode at a flow rate of 5 mL min−1. The fraction from 24 to 36 min was collected (60 mL). To eliminate the ethyl acetate, which would prevent an efficient clean-up by the SPE procedure, 5 mL of MeCN were added to the extract before rotary evaporation (40 ºC, 240 mbar) down to 1 mL. This step was repeated once more.
The extract was further cleaned up by SPE using C18 and PSA sorbents. Both cartridges (500 mg, 6 mL) were previously conditioned with 5 mL MeCN and loaded without allowing them to run dry after conditioning. Then, the extract (1 mL) was loaded onto the C18 cartridge. 1 mL of MeCN was used to rinse the round flask, and subsequently collected and added to the cartridge. Elution was done with 5 mL of MeCN, which were evaporated down to 1 mL under a gentle N2 stream. The procedure was repeated with the PSA cartridge with the exception that 4 mL were used for elution. Finally, 2 mL toluene were added to the clean extract, evaporated under N2 stream down to ~ 1 mL and transferred to a GC vial for analysis.
GC-MS analysis
The injection of sample extract (2 µL) into the chromatographic system was performed in the pulsed splitless mode. The injector temperature was constantly held at 250 ºC while a pulse pressure of 25 psi lasted for 1 min. Subsequently, the injector was purged during 1 min at a flow rate of 50 mL min−1. The oven temperature was programmed as follows: 120 ºC held for 1 min, ramped to 180 ºC at 10 ºC min−1, ramped to 200 ºC at 2.5 ºC min−1, ramped to 230 at 3 ºC min−1, and finally ramped to 300 ºC at 20 ºC min−1 and held for 4.5 min. The total run time was 33 min.
The GC–MS auxiliary temperature was 290 ºC, and the mass spectrometric parameters were set as follows: electron ionisation with 70 eV energy, the ion source temperature was 230 ºC, and the quadrupole temperature was 150 ºC. Each target compound was monitored in the selective ion monitoring mode (SIM) according to its retention time, with one quantifier ion and two qualifier ions. The programmed time segmented group and related selected ions monitored for each selected pesticide are shown in .
Table 1. GC-MS parameters for the determination of the selected pesticides.
Identification and quantification
Pesticides were identified and quantified following the criteria specified in the Commission Decision 2002/657/EC (European Commission Citation2002), and the Guidance document (SANTE/11813/Citation2017 Citation2017) published by the European Commission:
(a) The retention time of each compound is the same in the matrix extract and in the calibration standard with a tolerance of ± 0.1 min. Larger retention time deviations are acceptable where both retention time and peak shape of the analyte match with those of the IS.
(b) Three ions in the case of single quadrupole mass spectrometry (one quantification and two confirmation ions, ).
(c) At least one ion ratio shall be measured. The relative intensities of the detected ions should correspond to those of the calibration standard at comparable concentration with a tolerance of ± 30% (See ).
Peak area was used as analytical signal, and each pesticide was quantified using their respective isotopically labelled analogue as IS. α-endosulfan and β-endosulfan were quantified individually and, since endosulfan sulphate was not present in the matrix, results were expressed as the sum of the two detected isomers required by European Regulation (Regulation EC/396/2005 of the European Parliament and of the Council of February 23, on maximum residue levels of pesticides in or on food and feed of plant and animal origin and amending Council Directive 91/414/EEC Citation2005).
Method validation and quality control
The method was validated according to the ISO/IEC 17,025 standard and the Guidance document on analytical quality control and validation procedure (SANTE/11813/Citation2017 Citation2017; International Organisation for Standardization Citation2017a, Citation2017b), by evaluating selectivity, linearity, recovery, repeatability, day-to-day variation, limits of detection and quantification (LOD and LOQ), stability of the extracts, method robustness and measurement uncertainty for each pesticide. Experiments were carried out on 5 days. Each day, a method blank (no soya) was prepared following the procedure described in section 2.4 and analysed in order to check any possible reagent or material cross contamination.
For assessing method selectivity, 10 different blank soybean samples were analysed and checked for the absence of interfering peaks at the retention time of the pesticide. During the analysis of spiked samples, target compounds were distinguished from any possible matrix interferent by fulfilment of the three identification and confirmation criteria, i.e. retention times within a ± 0.1 min time window of those corresponding to calibration standards, presence of the quantification ion as well as two confirmation ions, and compliance of relative ion abundances within the permitted tolerances.
On each analytical sequence, an independent calibration curve was included by injecting, randomly, a set of calibration standards in triplicate. For constructing the calibration curves, the peak area ratio (native/isotopically labelled) versus the mass fraction ratios (native/isotopically labelled) were plotted, as obtained from calibration standard solutions in toluene at seven different mass fraction levels (see section 2.2), covering ranges of 0.0024–0.035 mg kg−1 for diazinon, malathion, captan and iprodione, 0.006–0.087 mg kg−1 for chlorpyrifos and cypermethrin, 0.012–0.175 mg kg−1 for tebuconazole and 0.060–0.875 mg kg−1 for endosulfan. The ranges were selected according to the MRL of the pesticide and correspond to mass fractions of 0.002–0.040 mg kg−1 for diazinon, malathion, captan and iprodione, 0.005–0.1 mg kg−1 for chlorpyrifos and cypermethrin, 0.01–0.200 mg kg−1 for tebuconazole and 0.050–1.00 mg kg−1 for endosulfan in the final extracts when 5 g soybeans are analysed. The linearity of each calibration curve within the selected working range was firstly evaluated by visual inspection of the plotted data (area ratio and mass fraction ratio of analytes and isotopically labelled standards), and then by the residual plots and calculation of the correlation coefficient (r). In addition P-values for the lack-of-fit test at 95% confidence interval (α = 0.05) were obtained using Statgraphics Plus 5.0. Software.
The LOD and LOQ were estimated as 3 and 10 times the standard deviation as obtained from the measurement of different blank samples spiked at low concentration level. For this purpose, three blank samples spiked daily, at a concentration corresponding to the lowest point of the calibration curve for each compound, were processed according to the sample treatment procedure described and subsequently measured.
Repeatability is defined by ISO 5725–1 as the precision under conditions where independent test results are obtained with the same method, on identical test items, in the same laboratory, using the same equipment and within short intervals of time (International Organization for Standardization Citation1994). The same conditions apply to the day-to-day variation although tested over an extended period of time. To assess the method repeatability and day-to-day variation, three blank soya samples were spiked at MRL concentration levels on each of the 5 days of the study. Each subsample was injected three times on the GC. The results were evaluated by a single-factor analysis of variance (ANOVA). The approach applied for the assessment of trueness included standard addition experiments at three different concentration levels. Samples were spiked in triplicate for each level and recoveries were estimated as the ratio of analytical concentration of target pesticide obtained by IDMS to the corresponding spiked concentration. In addition, a recently released matrix CRM certified for the mass fractions of four pesticides in soybean was analysed for the content of diazinon and chlorpyrifos (Yarita et al. Citation2014) and the results assessed for correspondence with the certified values.
Robustness of an analytical method is defined in the EURACHEM Guide, as the capacity to remain unaffected by small changes in experimental variables (EURACHEM Guide: The Fitness for Purpose of Analytical Methods. A Laboratory Guide to Method Validation and Related Topics Citation2014), and it gives an idea of the reliability of the method when it is applied under regular conditions. Assuming the high automation and accurate performance of the equipment used for sample preparation (PLE and GPC) and analysis (GC-MS), variations are less likely to happen. SPE is the most significant manual handling step, and therefore it was considered for further investigation. Small changes in the amount of elution solvent in the two SPE steps were tested, ± 10% variations of their optimised value, with samples spiked at concentration level similar to those used for the precision studies.
Stability of the extracts was investigated at different times by measuring spiked samples (n = 3), the day of preparation, and every week over a period of 1 month. Between injections, the vials containing the extracts were re-capped and kept in the dark at + 4 ºC.
Results and discussion
Method validation
Selectivity
The method selectivity was evaluated by the analysis of 10 different soybean blank samples. No peaks from the matrix interfering with the target analytes were found, except for tebuconazole, which showed evidence of a matrix interference, which was not separable from the analyte even with a longer temperature gradient. During an analytical sequence, this interference became less and less clear and the peak for tebuconazole showed increased tailing, indicating degradation of the chromatographic system and possibly creation of active sites resulting in a worsening of the peak shape.
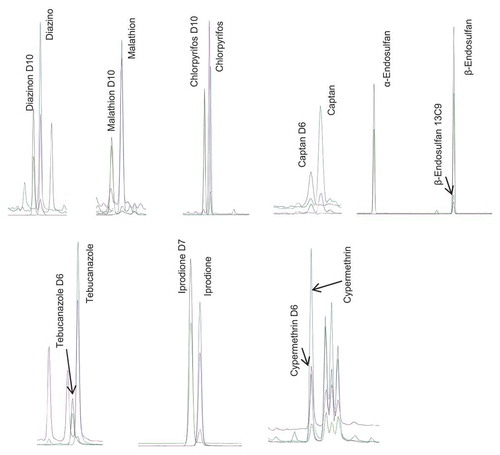
Retention time was used for identification of the target analytes, which were distinguished from any interfering matrix compound by comparing i) the relative retention time and ii) the relative intensity of the qualification ions obtained in the sample and in solvent calibration standards. For illustration, includes a chromatogram obtained for a spiked soybean sample. shows the relative intensity average ratio of quantification and qualification ions, and the relative retention time, obtained for the calibration standards (average of the value obtained in all calibration levels) for the selected pesticides over the 5 days of the validation study. In all cases, the retention time of each analyte in a sample extract was within ± 0.1 min of the one found in calibration solutions. Ratios of quantifying and qualifying ions (QT/QL1) in samples were within ± 30% (relative) of average of calibration standards from same sequence, in accordance with criteria specified on the European guidelines (SANTE/11813/Citation2017 Citation2017), in all cases except for tebuconazole for which this tolerance was exceeded. For this reason, and although the rest of the validation criteria were fulfilled for tebuconazole, this compound was excluded from the final scope of the method.
Figure 1. Chromatogram obtained for a soybean sample spiked with pesticides corresponding to MRL levels.
Working range and performance characteristics
The goal of the method is the quantification of the selected pesticides in soybean samples contaminated at a concentration close to the MRL established by current Regulation (Regulation EC/396/2005 of the European Parliament and of the Council of February 23, on maximum residue levels of pesticides in or on food and feed of plant and animal origin and amending Council Directive 91/414/EEC Citation2005). Therefore, the working range was determined taking this into account and calibration curves were constructed as described in section 2.4.5. The statistical parameters calculated from least-square regression are presented in . The resulting correlation coefficients (r) were higher than 0.99, and the P-values for the lack-of-fit test (α = 0.05) higher than 0.05, thus confirming the linearity of the target pesticides over the selected working range.
Table 2. Working range and external calibration equation a. Results are shown for 1 day and are representative for all validation days (n = 5).
In order to estimate the LOD and LOQ of the method, three blank soybean samples were spiked daily at the lowest level of the working range for each pesticide (n = 15). The LODs and LOQs were taken as 3 and 10 times respectively, the standard deviation of the measured concentration for those samples. As shown in , all LOQs for all pesticides were below the MRL currently set for each target pesticide.
The precision of the method was estimated via the repeatability and day-to-day variation (3 samples × 5 days). For this purpose, ANOVA and the following formulae described elsewhere (Van Der Veen et al. Citation2001), were applied:
where RSDrep: relative standard deviation of repeatability [%]; RSDday: relative standard deviation of day-to-day variation [%]; MSwithinGroups: mean square within groups obtained from ANOVA; MSbetweenGroups: mean square between groups obtained from ANOVA; ymean: grand mean of all observations [mg kg−1]; n: number of observation in each group (n = 3).
In the case of diazinon and chlorpyrifos RSDday could not be calculated because MSWithinGroups was bigger than the MSBetweenGroups. Instead, the between-run component of the precision for these analytes was estimated as u*br according to Eq. 3 adapted (Linsinger et al. Citation2001):
where u*br: relative standard deviation of between-run component of the precision [%]; n: number of observations in each group (n = 3); N: number of groups (N = 5).
As can be seen in , repeatability and day-to-day variation RSD values were in all cases below 5%. The outcome from studies carried out at three different concentration levels of each individual pesticide are summarised in and include recoveries (ratio of analytical concentration of target pesticides obtained by IDMS to the corresponding spiked concentration) in the range 80–115% with RSDs varying from 0.3 to 7.9%. For diazinon and chlorpyrifos, the additional results obtained from the application of the method to the material CRM 7509-a, confirm the absence of statistically significant bias, since the results (21.1 ± 0.5 ng g−1 and 9.3 ± 0.1 ng g−1 for diazinon and chlorpyrifos respectively (n = 2) are in agreement with the certified values of the reference material. The trueness and precision linked to the proposed method make it suited for its application in the characterisation of a candidate reference material.
Table 3. Precision of the method, precision of the trueness estimation and uncertainty budget.
Table 4. Mean recoveries (estimated as ratio of analytical concentration of target pesticides obtained by IDMS to the corresponding spiked concentration,%) and RSD (%, n = 5) obtained for the selected pesticides spiked at different levels in milled soyabeans.
Robustness
In order to evaluate method robustness, high and low limits around an optimised value are set for critical identified variables. As mentioned in section 2.5, the elution volumes of the two SPE steps were varied at ± 10% of the nominal value (0.5 mL of MeCN for both C18 and PSA cartridges). Subsequently, a t-test was applied to compare the results obtained when applying those changes on the analytical method, which showed no statistical significant differences between the mean values obtained for any of the pesticides included in this study.
Stability of extracts
The stability of the sample extracts was investigated within a period of 1 month. Extracts prepared and measured during the validation experiments were kept at + 4 °C in the dark, and measured again once every week over a period of 1 month. The results obtained were statistically compared by a t-test, which revealed no significant difference between the means and consequently no signs of degradation, although it is advisable to analyse the samples as quick as possible after extraction.
Measurement uncertainty
The measurement uncertainty estimation followed a top-down approach considering validation data and the use of formal error propagation principles defined by the EURACHEM/CITAC Guide CG 4 (International Organisation for Standardization Citation2010; EURACHEM/CITAC Guide: Quantifying Uncertainty in Analytical Measurement Citation2012). Repeatability, day-to-day variation, and trueness were the main contributions to the global uncertainty associated to the measurement (). The trueness contribution was estimated from the recovery experiments as the relative standard deviation of the recovery obtained by the triplicate analysis of each concentration level (n = 9). The expanded uncertainty was then estimated as the combination of individual uncertainty contributions with a coverage factor of k = 2 (level of confidence of approximately 95%), as follows:
where U: combined expanded uncertainty; RSDrep: relative standard deviation of repeatability; n1: number of independent samples analysed (15 for the repeatability study); RSDday relative standard deviation day-to-day component of the precision; n2: number of days (5 for the intermediate precision study); RSDtrue: relative standard deviation of trueness estimation by recovery experiment at mass fraction levels matching the centre of the calibration range per compound (0.020 mg kg−1 for diazinon, malathion, captan and iprodione, 0.050 mg kg−1 for chlorpyrifos and cypermethrin, 0.100 mg kg−1 for tebuconazole and 0.500 mg kg−1 for endosulfan), i.e. identical to the RSD of the recovery at these spiking concentration levels; n3: number of replicates analysed for recovery estimation. According to the Guidance document on analytical quality control and validation procedure, intermediate precisions lower than 20% and combined expanded uncertainties lower than 25%, should be obtained if isotopically labelled congeners are used as internal standards (SANTE/11813/Citation2017 Citation2017). As shown in , the actual method performance is significantly better than the stringent performance requirements set at the beginning, not only for the particular experimental set up during validation, including the analysis of three independent sample replicates on five different days, but also for triplicate analysis of samples performed within the same run (n1 = 3 and n2 = 1). Thus, the proposed analytical method fits for the homogeneity, stability and characterisation studies of soybean-based reference materials, as for these tasks, better performance than for routine analysis is needed.
Conclusions
A method based on GC-IDMS was developed and validated for the accurate determination of diazinon, malathion, chlorpyrifos, captan, α-endosulfan, β-endosulfan, iprodione and cypermethrin in soybeans. Tebuconazole fulfilled all the validation criteria with the exception of the required QT/QL1 ion ratio, most likely due to the presence of matrix interferences. Therefore, the determination of this compound was not sufficiently reliable after application of the method followed by a clean-up step using GPC and SPE. The combination of this sample clean-up and the application of isotopic dilution mass spectrometry permitted an accurate quantification with solvent-based pure substance calibration solutions, thus preventing the need of laborious and time consuming matrix matched calibrations. The analytical method was validated following the ISO/IEC 17025 standard and taking into account DG SANTE guidelines with extra stringent performance criteria. Satisfactory recoveries for the full working range (80–115%), RSDs (< 5% is all cases) and uncertainties (U < 4.2%) were achieved. The high accuracy of the results confirms the improved performance of this method over other published for the determination of pesticides in soybean matrix, and demonstrates its suitability to be applied for the evaluation of homogeneity and stability in addition to certification studies/value assignment in the context of the production of a certified reference material.
Acknowledgements
The Reference Materials Unit Processing Sector at Directorate for Health, Consumers and Reference Materials of the Joint Research Centre, is greatly acknowledged for the preparation of the soybean material employed for the study, and Professor Amadeo R. Fernández-Alba (Pesticide Residue Research Group, European Union Reference Laboratory for pesticides in fruits and vegetables (EURL-FVs)) for useful discussions and support on the selection of the combination of target pesticides in a plant origin matrix.
Disclosure statement
No potential conflict of interest was reported by the authors.
References
- Alder L, Greulich K, Kempe G, Vieth B. 2006. Residue analysis of 500 high priority pesticides: better by GC-MS or LC-MS/MS? Mass Spectrom Rev. 25(6):838–865.
- Cunha SC, Fernandes JO. 2011. Multipesticide residue analysis in maize combining acetonitrile-based extraction with dispersive liquid–liquid microextraction followed by gas chromatography–mass spectrometry. J Chromatogr. 1218(43):7748–7757.
- David F, Devos C, Dumont E, Yang Z, Sandra P, Huertas-Pérez JF. 2017. Determination of pesticides in fatty matrices using gel permeation clean-up followed by GC-MS/MS and LC-MS/MS analysis: A comparison of low- and high-pressure gel permeation columns. Talanta. 165:201–210.
- Domingos Alves R, Romero-González R, López-Ruiz R, Jiménez-Medina ML, Garrido Frenich A. 2016. Fast determination of four polar contaminants in soy nutraceutical products by liquid chromatography coupled to tandem mass spectrometry. Anal Bioanal Chem. 408(28):8089–8098.
- Erney DR, Pawlowski TM, Poole CF. 1997. Matrix-induced peak enhancement of pesticides in gas chromatography: is there a solution? HRC J High Resolut Chromatogr. 20(7):375–378.
- EURACHEM Guide: The Fitness for Purpose of Analytical Methods. A Laboratory Guide to Method Validation and Related Topics. 2014. Magnusson B and Örnemark U, editor. 2nd ed.
- EURACHEM/CITAC Guide: Quantifying Uncertainty in Analytical Measurement. 2012. Ellison SLR and Williams A, editor. 3rd ed.
- European Commission 2002/657/EC 2002. Commission decision of 12 august 2002 implementing council directive 96/23/EC concerning the performance of analytical methods and the interpretation of results. Official Journal of the European Communities. p. 29
- [FAO] Food and Agriculture Organization of the United Nations. 2017. FAOSTAT [Acccessed 2018 Jun] http://www.fao.org/faostat/en/#data/TP.
- García-Reyes JF, Ferrer C, Gómez-Ramos MJ, Fernández-Alba AR, García-Reyes JF, Molina-Díaz A. 2007. Determination of pesticide residues in olive oil and olives. TrAC Trends Anal Chem. 26(3):239–251.
- Garrido Frenich A, Martínez Vidal JL, Cruz Sicilia AD, González Rodríguez MJ, Plaza Bolaños P. 2006. Multiresidue analysis of organochlorine and organophosphorus pesticides in muscle of chicken, pork and lamb by gas chromatography–triple quadrupole mass spectrometry. Anal Chim Acta. 558(1):42–52.
- Garrido Frenich A, Martínez Vidal JL, Fernández Moreno JL, Romero-González R. 2009. Compensation for matrix effects in gas chromatography–tandem mass spectrometry using a single point standard addition. J Chromatogr. 1216(23):4798–4808.
- Gilbert-López B, García-Reyes JF, Molina-Díaz A. 2009. Sample treatment and determination of pesticide residues in fatty vegetable matrices: a review. Talanta. 79(2):109–128.
- Hajšlová J, Zrostlı́ková J. 2003. Matrix effects in (ultra)trace analysis of pesticide residues in food and biotic matrices. J Chromatogr. 1000(1):181–197.
- Hirahara Y, Kimura M, Inoue T, Uchikawa S, Otani S, Haganuma A, Matsumoto N, Hirata A, Maruyama S, Iizuka T, et al. 2005. Validation of multiresidue screening methods for the determination of 186 pesticides in 11 agricultural products using gas chromatography (GC). J Health Sci. 51(5):617–627.
- Huertas Pérez JF, Sejerøe-Olsen B, Fernández Alba AR, Schimmel H, Dabrio M. 2015. Accurate determination of selected pesticides in soya beans by liquid chromatography coupled to isotope dilution mass spectrometry. Talanta. 137:120–129.
- International Organization for Standardization. 1994. ISO 5725-1:1994 - accuracy (trueness and precision) of measurement methods and results - Part 1: general principles and definitions. Geneva: ISO.
- International Organization for Standardization. 2010. ISO 21748:2010 - guidance for the use of repeatability, reproducibility and trueness estimates in measurement uncertainty estimation. Geneve: ISO.
- International Organization for Standardization. 2017a. ISO/IEC 17025:2017. General requirements for the competence of testing and calibration laboratories. Geneva: ISO.
- International Organization for Standardization. 2017b. ISO/IEC Guide 35 Reference materials – general and statistical principles for certification. Geneva: ISO.
- Kim K-G, Park D-W, Kang G-R, Kim T-S, Yang Y, Moon S-J, E-A C, D-R H, E-S K, B-S C. 2016. Simultaneous determination of plant growth regulator and pesticides in bean sprouts by liquid chromatography–tandem mass spectrometry. Food Chem. 208:239–244.
- Kumar V, Rani A, Solanki S, Hussain SM. 2006. Influence of growing environment on the biochemical composition and physical characteristics of soybean seed. J Food Composition Anal. 19(2):188–195.
- LeDoux M. 2011. Analytical methods applied to the determination of pesticide residues in foods of animal origin. A review of the past two decades. J Chromatogr. 1218(8):1021–1036.
- Lehotay SJ, Mastovska K, Lightfield AR, Gates RA. 2010. Multi-analyst, multi-matrix performance of the QuEChERS approach for pesticide residues in foods and feeds using HPLC/MS/MS analysis with different calibration techniques. J AOAC Int. 93(2):355–367.
- Li Z, Li Y, Liu X, Li X, Zhou L, Pan C. 2012. Multiresidue analysis of 58 pesticides in bean products by disposable pipet extraction (DPX) cleanup and gas chromatography-mass spectrometry determination. J Agric Food Chem. 60(19):4788–4798.
- Linsinger TPJ, Pauwels J, Van Der Veen AMH, Schimmel H, Lamberty A. 2001. Homogeneity and stability of reference materials. Accreditation Qual Assur. 6(1):20–25.
- Maldaner L, Santana CC, Jardim ICSF. 2008. HPLC determination of pesticides in soybeans using matrix solid phase dispersion. J Liquid Chromatogr Relat Technologies. 31(7):972–983.
- May MM, Ferronato G, Bandeira NMG, Prestes OD, Zanella R, Adaime MB. 2017. Determination of pesticide residues in soy-based beverages using a QuEChERS method (with clean-up optimized by central composite design) and ultra-high-performance liquid chromatography-tandem mass spectrometry. Food Analytical Methods. 10(2):369–378.
- Messina M. 1997. Soyfoods: their role in disease prevention and treatment. In: Liu K, editor. Soybean chemistry and utilisation. New York: Chapman and Hall; p. 442–477.
- Nguyen TD, Lee MH, Lee GH. 2010. Rapid determination of 95 pesticides in soybean oil using liquid–liquid extraction followed by centrifugation, freezing and dispersive solid phase extraction as cleanup steps and gas chromatography with mass spectrometric detection. Microchemical J. 95(1):113–119.
- Páleníková A, Martínez-Domínguez G, Arrebola FJ, Romero-González R, Hrouzková S, Frenich AG. 2015. Multifamily determination of pesticide residues in soya-based nutraceutical products by GC/MS–MS. Food Chem. 173:796–807.
- Pizzutti IR, de Kok A, Hiemstra M, Wickert C, Prestes OD. 2009. Method validation and comparison of acetonitrile and acetone extraction for the analysis of 169 pesticides in soya grain by liquid chromatography-tandem mass spectrometry [Article]. J Chromatogr. 1216(21):4539–4552.
- Pizzutti IR, de Kok A, Zanella R, Adaime MB, Hiemstra M, Wickert C, Prestes OD. 2007. Method validation for the analysis of 169 pesticides in soya grain, without clean up, by liquid chromatography–tandem mass spectrometry using positive and negative electrospray ionization. J Chromatogr. 1142(2):123–136.
- Presta MA, Kolberg DIS, Wickert C, Pizzutti IR, Adaime MB, Zanella R. 2009. High resolution gel permeation chromatography followed by GC-ECD for the determination of pesticide residues in soybeans. Chromatographia. 69(3–4):237–241.
- Raina-Fulton R. 2015. New trends in pesticide residue analysis in cereals, nutraceuticals, baby foods, and related processed consumer products. J AOAC Int. 98(5):1163–1170.
- European Commission. 2005. Regulation EC/396/2005 of the European Parliament and of the Council of February 23. on maximum residue levels of pesticides in or on food and feed of plant and animal origin and amending council directive 91/414/EEC. Strasbourg: Official Journal of the European Union. p. 16.
- European Commission. 2017. SANTE/11813/2017. Guidance document on analytical quality control and method validation procedures for pesticides residues analysis in food and feed. European Commission Directorate-General for Health and Food Safety; [Accessed Jan 2018].https://ec.europa.eu/food/sites/food/files/plant/docs/pesticides_mrl_guidelines_wrkdoc_2017-11813.pdf
- Sejeroe-Olsen B, Shegunova P, Grimalt Brea S, Harbeck S, Fernandez-Alba A.R.Dabrio M. 2014. Certified reference material for pesticide residue analysis: how to deal with thousands of pesticide-matrix combinations? 10th European pesticide residue workshop. https://www.eprw2014.com
- Van Der Veen AMH, Linsinger T, Pauwels J. 2001. Uncertainty calculations in the certification of reference materials. 2. Homogeneity study. Accreditation Qual Assur. 6(1):26–30.
- Viera MS, Rizzetti TM, de Souza MP, Martins ML, Prestes OD, Adaime MB, Zanella R. 2017. Multiresidue determination of pesticides in crop plants by the quick, easy, cheap, effective, rugged, and safe method and ultra-high-performance liquid chromatography tandem mass spectrometry using a calibration based on a single level standard addition in the sample. J Chromatogr. 1526:119–127.
- Villaverde JJ, Sevilla-Morán B, López-Goti C, Alonso-Prados JL, Sandín-España P. 2016. Trends in analysis of pesticide residues to fulfil the European regulation (EC) No. 1107/2009. TrAC Trends Anal Chem. 80:568–580.
- Wang J, Cheung W, Chow W. 2013. Ultra-high performance liquid chromatography/electrospray ionization-tandem mass spectrometry determination of 151 pesticides in soybeans and pulses. J AOAC Int. 96(5):1114–1133.
- Wu G, Bao X, Zhao S, Wu J, Han A, Ye Q. 2011. Analysis of multi-pesticide residues in the foods of animal origin by GC–MS coupled with accelerated solvent extraction and gel permeation chromatography cleanup. Food Chem. 126(2):646–654.
- Xinyi C, Xiwu G, Xiaogang C, Wei Y, Yun L, Mingli Y, Xiuqing L, Daning W, Yanyan F, Zweigenbaum JA. 2007. Application of liquid chromatography-time-of-flight-mass spectrometry for the analysis of urea herbicides residues in soybean. Anal Lett. 40(6):1117–1130.
- Yarita T, Otake T, Aoyagi Y, Kuroda Y, Numata M, Iwata H, Watai M, Mitsuda H, Fujikawa T, Ota H. 2014. Development of soybean certified reference material for pesticide residue analysis. Talanta. 119:255–261.