
Abstract
Fourier transform mid-infrared spectroscopy (MIR-FTIR) and a partial least square algorithm (PLS-1) were used to predict the deterioration indices, pH, and chemical composition of Atlantic bluefin tuna, crevalle jack, and Atlantic Spanish mackerel chilled fillets. To build calibration models, 90 samples from the 3 fish species were analysed to different seasons and were stored for various times. The performance of the regression models was evaluated based on the coefficients of determination (R2), residual predictive deviation of cross-validation (RPDcv), and percentage relative difference (% RD). Chemometric models provided good reliability in the prediction of the chemical composition (R2 between 0.969 and 0.992, RPDcv between 5.01 and 5.59%), the pH (R2 = 0.987, RPDcv = 7.18), and can be used for screening of deterioration indices (R2 between 0.944 and 0.969, RPDcv between 3.21 and 3.67%). The results demonstrated that the MIR-FTIR coupled with the PLS-1 algorithm could be simultaneously applied to predict the chemical parameters of chilled fillets of three fish species.
La espectroscopía infrarroja media por transformada de Fourier (MIR- FTIR) y el algoritmo PLS-1 fueron utilizados para predecir índices de deterioro, pH y composición química de filetes refrigerados de atún aleta azul, jurel y sierra. Para construir los modelos de regresión fueron analizadas 90 muestras de las 3 especies, en diferentes estaciones y diversos tiempos de almacenamiento. Se evaluó el comportamiento de los modelos con base en los coeficientes de determinación (R2), la desviación residual de predicción en la validación cruzada (RPDcv), y el porcentaje de diferencia relativa (%RD). Los modelos proporcionan una buena predicción de la composición química (R2 entre 0,969–0,992, RPDcv entre 5,01–5,59%), el pH (R2 = 0,987, RPDcv = 7,18), y se pueden utilizar para análisis de reconocimiento de índices de deterioro (R2 entre 0,944–0,969, RPDcv entre 3,21–3,67%). Los resultados demostraron que la espectroscopía MIR-FTIR y el algoritmo PLS-1 pueden aplicarse simultáneamente para predecir parámetros químicos de filetes refrigerados.
Introduction
Fish is a highly perishable food commodity, and during storage, it suffers changes in chemical composition (i.e., protein and lipid fractions) that modify its nutritional attributes and reduces its shelf life (Aubourg, Citation1999). Food and Agriculture Organization of the United Nations (FAO) has estimated that the 25% losses in the fishery sector result from discarding in the sea or by chemical or microbial spoilage (Cakli, Kilinc, Cadun, Dincer, & Tolasa, Citation2007). In whole fish, areas, such as the eyes, gills, skin, and scales, can be examined to determine its freshness. However, when the fish has been filleted, the determination of its freshness is not as simple. The chemical composition and freshness are important factors that determine the quality of fish flesh (Connell, Citation1995). Industrial fish processors have a direct interest in the chemical composition of fish because they need to know the nature of the raw material such that they can correctly chill, freeze, smoke, can it (Food and Agriculture Organization [FAO], Citation2001) or control, and optimize the processing of the fishmeal (Cozzolino, Chree, Scaife, & Murray, Citation2005). In addition, the determination and preservation of the fish quality provides the consumer with wholesome and safe fish fillets at a good price.
Therefore, demand for high levels of quality and safe fish products requires appropriate analytical tools for quality control during its storage. The chemical methods to quantify fish composition (e.g., Kjeldahl method and Soxhlet method) and methods to assess the freshness of fish are time consuming, expensive, generate toxic wastes, and require large amounts of sample.
Fourier transform mid-infrared spectroscopy (MIR-FTIR) is a technique that replaces traditional methods of analysis in the field of rapid screening. MIR-FTIR spectra provide detailed information on the chemical structure and composition of samples. MIR-FTIR can be used as a fingerprint because specific absorption bands can be assigned to specific molecular bonds. This technique is fast, requires only a small sample size with minimal or no preparation, does not require the use of solvents and is more economical than other methods. Therefore, MIR-FTIR has the potential for use in routine analysis.
While it is true that many spectroscopic techniques including near-infrared spectroscopy, Raman spectroscopy, nuclear magnetic resonance spectroscopy, and spectral imaging have been successfully developed for fish analysis, the last three are expensive, and they are not easy to use for on-line detection (Cheng et al., Citation2013). For prediction of fish parameters, there are several works developed with near-infrared spectroscopy (Cozzolino et al., Citation2005; Uddin et al., Citation2006). However, the applications of MIR-FTIR spectroscopy for analysis in the food sector have increased over the past decade (De Fuentes, Bosch, & Sánchez, Citation2008).
Fourier transform spectroscopy coupled to multivariate analysis (chemometrics) is a powerful tool that has been successfully used to simultaneously determine various properties of food products. For example, Fourier transform spectroscopy has been successfully applied to predict the chemical properties of various types of samples, such as fish (Hernández-Martínez et al., Citation2013), fats and oils (Hernández-Martínez, Gallardo-Velázquez, & Osorio-Revilla, Citation2010; Rohman & Che Man, Citation2011; Zhang et al., Citation2012), fruits and vegetables (Sinelli, Spinardi, Di Egidioa, Mignani, & Casiraghia, Citation2008; Castañeda-Pérez, Osorio-Revilla, Gallardo-Velázquez, & Proal-Nájera, Citation2013), wine (Soriano, Pérez-Juan, Vicario, González, & Pérez-Coello, Citation2007), corn dough and tortilla (Piña-Barrera, Meza-Márquez, Osorio-Revilla, & Gallardo-Velázquez, Citation2013), and honey (Rios-Corripio, Rojas-López, & Delgado-Macuil, Citation2012).
Even though mid-infrared is a region used for quantitative and qualitative analysis of several products, there are limited studies using MIR-FTIR spectroscopy combined with chemometrics to analysed fish freshness (Pink, Naczk, & Pink, Citation1998; Karoui et al., Citation2007) or the chemical composition related to fish-protein structures and salt content (Galvis-Sánchez, Tóth, Portela, Delgadillo, & Rangel, Citation2011).
In a previous work (Hernández-Martínez et al., Citation2013), our work team developed a chemometric model, based on MIR-FTIR spectroscopy for prediction of total fat and fatty acids in fish fillets since there are others factors that also determine the quality of fish flesh. The aim of this work is to use MIR-FTIR spectroscopy combined with multivariable analysis to obtain chemometric models for the prediction of chemical composition (i.e., moisture, protein, fat, and ash), pH, and deterioration indices (i.e., total volatile basic nitrogen (TVB-N), peroxide value (PV) and 2-thiobarbituric acid reactive substances (TBARS) value) of Atlantic bluefin tuna, crevalle jack, and Atlantic Spanish mackerel. As far as the authors knowledge these predictions has not been developed to these fish species.
Materials and methods
Fish samples
Atlantic bluefin tuna (Thunnus thynnus), crevalle jack (Caranx hippos), and Atlantic Spanish mackerel (Scomberomorus maculatus) were purchased at the “La Nueva Viga” market in Mexico City. These species are in high demand in Mexico due to its taste, nutritional value, and accessible price (CONAPESCA, Citation2011).
All of the fish samples were acquired with excellent physical-quality properties. One lot of each species was analysed in the summer (June to August 2011), autumn (October to December 2011) and winter (February and March 2013) to determine the chemical variability necessary to develop robust chemometric models.
Sample procedures
The fish was filleted in the market and immediately transported to the laboratory in ice containing boxes. The fillets, which weighed approximately 150 g, were stored in Ziploc® bags and were maintained under refrigeration at 0–0.5°C for 13 days. Fillets of each lot were chemically and spectrophotometrically characterised in triplicate only in 10 out of 13 days (0, 1, 2, 5, 6, 7, 8, 9, 12, and 13 storage days). Therefore, 30 samples of each species were individually analysed. In addition, the four other fillets of each species were randomly analysed as external validation samples. Each fillet was ground in a food processor equipped with stainless steel blade (Taurus, México), and the MIR-FTIR spectrum of each sample was individually recorded to determine the chemical composition and deterioration indices as explained below.
MIR-FTIR spectra acquisition
The spectra were obtained using a PerkinElmer Spectrum GX FTIR Spectrometer (Norwalk, CT, USA) equipped with an attenuated total reflectance (ATR) accessory with a zinc selenide crystal. The crystal geometry was a 45° parallelogram with mirrored angled faces with 10 nominal internal reflections. Approximately, 2 g of the ground fish sample was spread onto the ATR crystal and pressed with a press accessory to obtain an intimate contact between the sample and the crystal. The spectra were scanned in quadruplicate at room temperature over the wavenumber range of 4000–700 cm−1 and were averaged 64 scans at a resolution of 4 cm−1. Single beam spectra of the samples were obtained against a background of air and are presented in absorbance units. The spectra were processed with the PerkinElmer Spectrum® software version 5.3.1 (Beaconsfield, Bucks, UK) and quadruplicates of each sample were averaged to obtain an average spectrum. All of the average spectra were used for multivariate analysis.
Chemical composition
Chemical composition analyses of the ground fish fillet were performed in triplicate to determine the protein, moisture, total lipid, and ash contents. The crude protein was determined via the Kjeldahl procedure according to the protocol reported by Pearson (Citation1976). The determination of moisture (AOAC method 934.01) and ash (AOAC method 967.05) contents was performed using standard methods of the AOAC (Citation2002). The lipids were extracted from the ground fillet by homogenising it in chloroform–methanol solution (2:1, mL:mL) according to the Folch method (Folch, Less, & Sloane-Stanley, Citation1957).
Measurement of pH and deterioration of proteins
The pH measurement was performed by homogenising 5 g of ground fish with 10 mL of distilled water for 1 min at room temperature. The pH value was recorded using a Conductronic pH10 digital pH meter (Conductronic S.A., Puebla, Mexico) standardised at pH 4 and 7.
The deterioration of the proteins was based on the TVB-N, which is the traditional chemical analysis employed for evaluation of the degree of spoilage in seafood (Sallam, Ahmed, Elgazzar, & Eldaly, Citation2007). The TVB-N content was determined according to the method reported by Malle and Poumeyrol (Citation1989), and the TVB-N content is expressed as mg of nitrogen/100 g of fish and measured by steam distillation and titration of an aliquot of 100 g of ground fish with a 7.5% aqueous trichloroacetic acid solution. The distilled TVB-N was collected in a boric acid solution followed by titration with a hydrochloric acid solution.
Measurement of the deterioration of fats
The PV and the TBARS value are two of the commonly used chemical methods for the evaluation of oxidation. Primary lipid oxidation was determined by means of the PV according to the ferric thiocyanate method (Shantha & Decker, Citation1994). This method is based on the oxidation of ferrous to ferric ions, which are determined colourimetrically at 500 nm as ferric thiocyanate. The results are expressed as milliequivalents of peroxide/kg flesh fish. Secondary lipid oxidation was determined by means of the TBARS according to the procedure reported by Erkan and Özden (Citation2008). The assay is based on the absorbance of a pink colour complex at 532 nm, which is formed between thiobarbituric acid (TBA) and secondary oxidation products, such as malonaldehyde (MDA) or MDA-type products. The results are expressed as milligrams of MDA/kg flesh fish.
Multivariate analysis
The relationships between the chemical parameters of fish fillets and the MIR-FTIR spectra were determined using the PerkinElmer Spectrum Quant+® software version 4.51.02 (Beaconsfield, Bucks, UK), which included the partial least squares (PLS-1) algorithm. To create regression models, 90 averaged MIR-FTIR spectra from the 3 species (i.e., 30 from each one) were used for both the calibration set and the cross-validation set.
The calibration models were developed using full cross-validation. For cross-validation “leave-one-out”, each standard is removed in turn from the calibration set, and the calibration is performed using the other n−1 standards. Then, the removed standard is predicted using that calibration, and the validation errors are combined to obtain a standard error of cross-validation (SECV) (PerkinElmer, Citation2000). Cross-validation is used as a validation method due to the limited number of samples in the data set (90 samples). In addition, cross-validation is employed to determine the optimal number of factors, and it is selected when the lowest significant SECV is obtained. This procedure avoids overfitting (Shenk & Westerhaus, Citation1995; Uddin et al., Citation2006).
It has been found in a previous work (Hernández-Martínez et al., Citation2013) that some preprocessed techniques could be applied to MIR-FTIR spectra prior to calibration, in order to improve the accuracy of the models. Those pretreatments were also applied in the present work; the results from the optimal pretreatments are provided in the “Results and discussion” section.
The best calibration models were chosen based on the smallest standard error of calibration (SEC), SECV and bias values, as well as slope values closely to the value 1, the highest coefficient of determination (R2) and highest residual predictive deviation of cross-validation (RPDcv); last one is defined as the ratio between the standard deviation (SD) of the population and the SECV (Williams, Citation2001; Sinelli et al., Citation2008). The optimal number of factors was determined by the lowest number of factors that yielded a value closest to the minimum SECV for each parameter (Hernández-Martínez et al., Citation2013).
The good performance of the prediction models was also evaluated by comparing the actual and predicted values of 12 external samples (i.e., four of each fish species in the prediction set). These samples were of known concentrations with different storage times but did not belong to the calibration or validation sets. The percentage relative difference (% RD) values in the prediction of these samples were calculated using the following formula:
Statistical analysis
The analyses were performed with Minitab Statistical Software version 16.1.0 (State College, PA, USA). Significant differences between moisture, fat, protein, and ash means for species and seasons were determined by one-way ANOVA with Tukey’s method (p < 0.05). Principal component analysis (PCA) was performed via Pearson’s correlation matrix. PCA is a powerful visualisation tool that enables graphic representation of intersample and intervariable relationships for exploratory data analysis.
Results and discussion
Chemical composition and deterioration results
shows the chemical characterisation of Atlantic bluefin tuna, crevalle jack, and Atlantic Spanish mackerel fillets as a function of the seasons for the individual species. No significant differences were observed for any of the chemical parameters. However, the chemical composition variation among the samples exhibited a great variability, particularly for fat, protein, and ash content. These can be observed by the broad coefficients of variation (CV) in . also shows the pH and deterioration indices values for the Atlantic bluefin tuna, crevalle jack, and Atlantic Spanish mackerel fillets. Fish deterioration indices (TVB-N, PV, and TBARS) and pH also exhibited broad CV because the samples were stored under chilled conditions for 13 days. These analytical values were used for the calibration process, for each parameter the maximum and minimum values () represent the detection limits of the models since these are the concentration ranges which models are capable to predict.
Table 1. Chemical characterisation by season of Atlantic bluefin tuna, crevalle jack, and Atlantic Spanish mackerel fillets.
Tabla 1. Caracterización química por época del año de filetes de atún aleta azul, jurel y sierra.
The TVB-N contents exhibited a slow increase during first days of storage, and a sharp increase was observed after 5–7 days of storage, especially for Atlantic Spanish mackerel and crevalle jack (data not shown). TVB-N includes the measurement of trimethylamine, dimethylamine, ammonia, and other volatile nitrogenous compounds associated with seafood spoilage (Malle & Poumeyrol, Citation1989). TVB-N is often used as an index to assess the quality and shelf life of seafood products because the concentration of TVB-N in freshly caught fish is typically between 5 and 20 mg N/100 g, whereas levels of 30–35 mg N/100 g flesh are generally regarded as the limit of acceptability for iced stored cold water fish (Connell, Citation1995).
Table 2. Chemical characterisation, deterioration indices, and pH values for the Atlantic bluefin tuna, crevalle jack, and Atlantic Spanish mackerel fillets.
Tabla 2. Caracterización química, índices de deterioro y valores de pH de filetes de atún aleta azul, jurel y sierra.
The pH in fish flesh increased according to storage time (data not shown), and it were associated with the presence of undesirable alkaline compounds, which are primarily derived from microbial action (Erkan & Özden, Citation2008).
The PV and TBARS exhibited a gradual increase up to a certain point during storage, which was followed by either a decrease in the values or a slower rate of increase (data not shown). These results may be caused by the interaction between oxidation product and amino acids, proteins, glucose and other fish constituents (Goulas & Kontominas, Citation2007). The decrease in PV may have occurred in the last stage of storage due to decomposition of hydroperoxides into secondary radicals that undergo reactions to form secondary oxidation products.
Principal component analysis
The PCA showed (loading plot not shown) correlation between the variables fat, PV, TBARS and TVB-N. No correlation was observed between protein, ash, moisture, and fat. A negative correlation was observed between protein and pH. The PCA showed that the most significant principal components (PCs) were the first three, which explained 78.8% of the total variability of the samples. Therefore, these PCs were plotted in a 3D scatterplot (). Nine categories or clusters were observed in the figure because there are differences between the samples. The nine clusters that were formed matched the three species in the three different seasons. Most of the variability is contained in the PC1 (35.7%), which is primarily related to Ash, TVB-N, PV, and TBARS. PC2 is responsible for 25.9% of the variability and is associated with pH, protein, and moisture. The total fat contributes most strongly to PC3, which constitutes 17.2% of the total variability.
Figure 1. Principal component 3D scatterplot for Atlantic bluefin tuna (summer ![]()
Figura 1. Gráfica de dispersión 3D de las puntuaciones del análisis de componentes principales de atún aleta azul (verano ![]()
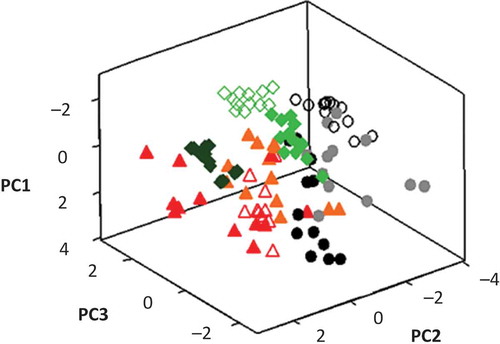
The chemical composition, pH, and deterioration indices for Atlantic bluefin tuna, crevalle jack, and Atlantic Spanish mackerel fillets stored for 13 days under chilled conditions revealed an important variability, which was reflected in the clusters shown in PCA analysis. This variability was suitable for the development of stable calibrations with the combined information from the three species.
MIR-FTIR spectra and selection of spectral regions
The MIR-FTIR spectra of Atlantic bluefin tuna, crevalle jack, and Atlantic Spanish mackerel exhibited different absorption bands corresponding to the molecular bonds that are present in the sample.
In the MIR-FTIR spectra, a broad band between 3600 and 3000 cm−1 is due to the vibration of the O–H bond in water (3360 cm−1) and the amide A of proteins (3270 cm−1). The peaks at 2958, 2925, and 2854 cm−1 are due to methyl (–CH3) asymmetric stretching, methylene (–CH2) asymmetric stretching, and methylene (–CH2) symmetric stretching, respectively. The peak observed at 1743 cm−1 corresponds to the ester carbonyl (C=O) stretching vibration of triglycerides. A major band between 1700 and 1600 cm−1 was observed and is due to the amide I band of the proteins and contribution from the O–H bond. Another band was observed at 1550 cm−1, which corresponds to the absorption of amide II (C–N stretch). Minor intensity peaks were observed at 1460 cm−1 (fat, –CH2 and –CH3 scissoring), 1396 cm−1 (symmetric stretching of COO– group), 1239 cm−1 (PO2 − asymmetric stretching of phospholipids, amide III band (C–H and N–H)), 1170 cm−1 (C–O–C asymmetric stretching of lipid esters), 1160 cm−1 (–CH2 bending, C–O stretching vibrations), 1124 cm−1 (C–O and C–C stretching vibrations), and 1080 cm−1 (PO2− symmetric stretching, and C–C and C–O of lipids and proteins). The interpretation of the bands was based on the data in the literature (Muniategui, Paseiro, & Simal, Citation1992; Guillén & Cabo, Citation1997; Socrates, 2000; Silverstein, Bassler, & Kiemle, Citation2005; Zhang et al., Citation2012).
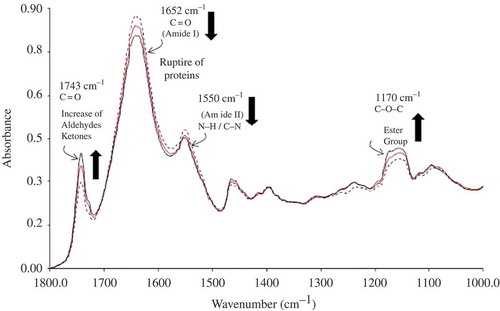
shows the 1800–1000 cm−1 region of the spectra from fresh Atlantic Spanish mackerel and after 2 and 12 days of storage. shows changes in some of the bands as a function of storage time. For example, an increase in the C=O band (1743 cm−1) was observed, which can be attributed to the appearance of lipid oxidation products, such as aldehydes and ketones. The decrease in the intensity of the amide I band (1652 cm−1) might be due to protein rupture, which is also associated with the increase in the intensity of the band at 1160 cm−1 corresponding to the stretching vibration of the C–O ester groups. In general, there is a correlation between chemical changes and spectral changes.
Figure 2. MIR-FTIR spectra in the region of 1800–1000 cm−1, for fresh Atlantic Spanish mackerel (![]()
Figura 2. Espectro MIR-FTIR en la región de 1800–1000 cm−1, para filetes de sierra frescos (![]()
However, the whole spectral range was not used to create the prediction models. The regions that demonstrate suitable correlations between changes in reference values and spectral response involved the 3232–2524 cm−1 and 1800–792 cm−1 regions for moisture, protein, pH, and TVB-N, the 3816–2524 cm−1 and 1800–828 cm−1 regions for TBARS and PV, the 3232–2524 cm−1, 1800–1656 cm−1, 1651–1649 cm−1, 1645–1638 cm−1, and 1633–796 cm−1 regions for ash, and the 3100–2524 cm−1, 1800–1661 cm−1, 1645–1638 cm−1, 1633–1565 cm−1, 1555–1543 cm−1, 1535–1509 cm−1, and 1500–828 cm−1 regions for fat. The bands considered in the models were selected according to variable leverage graph in the Spectrum Quant+® software. This graph shows variable outliers (wavenumbers) caused by regions of low or very high absorbance that should be considered for black regions. If all of the wavenumbers were used in the calibration, there would be a risk of “diluting” the useful regions of the spectrum making the major spectral peaks less visible to the PLS-1 algorithm as well as incorporating noise into the calibration model (Soriano et al., Citation2007). Therefore, the models for the parameters were developed using specific spectral regions.
Chemometric model results
Regardless of the species, all of the fish samples were used for the construction of the models and their validation. Specific models for the prediction of moisture, fat, protein, ash, TVB-N, PV, and TBARS were developed using the spectral regions mentioned in the previous section (MIR-FTIR spectra and selection of spectral regions) where different spectral regions represent different chemometric models with the same pretreatments. Among the tested pretreatments, the combination that allowed for accurate predictions with the models involved the Savitzky–Golay filter with five smoothing points, the first derivative with five smoothing points and Standard Normal Variate (SNV) with the de-trending option.
shows the statistics of the optimised chemometric models for the prediction of the chemical composition parameters (moisture, fat, protein, and ash), pH and the deterioration indices (TVB-N, PV, and TBARS). The obtained coefficient of determination (R2) ranged between 0.944 and 0.992. According to Shenk and Westerhaus (Citation1996), these are considered excellent since they are above 0.91 (). The SEC and SECV are quantitative measures of the preciseness with which the samples are fit to the regression during calibration or cross-validation, respectively. Both values have the same units in which the concentration of the parameter is measured. Therefore, low value with the same magnitude as the parameter is desirable (Hernández-Martínez et al., Citation2013). The SEC and SECV values for the parameters were low () and similar to each other. Large differences between the SEC and SECV values indicate the introduction of too many factors in the models that may include noise (Bureau et al., Citation2009). The bias values were low, and slope values from calibrations were close to unity (), indicating that the calibrations were accurate.
Table 3. Statistics of the optimised chemometric models developed with the PLS-1 algorithm for prediction of the chemical composition, pH, and the deterioration indices from Atlantic bluefin tuna, crevalle jack, and Atlantic Spanish mackerel fillets.
Tabla 3. Resultados estadísticos de los modelos quimiométricos optimizados desarrollados con el algoritmo PLS-1 para la predicción de la composición química, pH y los índices de deterioro de filetes de atún aleta azul, jurel y sierra.
The determination of the RPDcv allows for comparison of the developed calibrations for different properties that have different data ranges. A higher RPDcv value indicates that the data are fitted more accurately by the calibration (Jones, Schimleck, Daniels, Clark, & Purnell, Citation2008). According to Williams (Citation2001), RPDcv values between 3.1 and 4.9 are considered acceptable for screening, values between 5 and 6.4 are good for quality control, and values higher than 6.5 are very good for analytical purposes.
The RPDcv values for moisture, total fat, protein, ash, and pH range between 5.01 and 7.18 () indicating that the calibrations are good for quantitative predictions. For TVB-N, PV, and TBARS, the RPDcv values ranged between 3.21 and 3.67 indicating that the calibrations are acceptable for screening.
The good relationship between the actual values determined by the reference methods and the predicted values determined by the chemometric models is illustrated in and . shows the plots for chemical composition, and shows the plots for pH and deterioration indices of the 12 external fish samples (prediction set). Although the prediction set is reduced, this allows us to know how the model performs with new samples. This procedure has been applied successfully previously (Hernández-Martínez et al., Citation2013).
Figure 3. Predicted versus actual values for moisture (a), total fat (b), protein (c), and ash (d) of external samples from Atlantic bluefin tuna (![]()
Figura 3. Valores predichos versus reales para humedad (a), grasa total (b), proteína (c), y cenizas (d) de las muestras externas de atún aleta azul (![]()
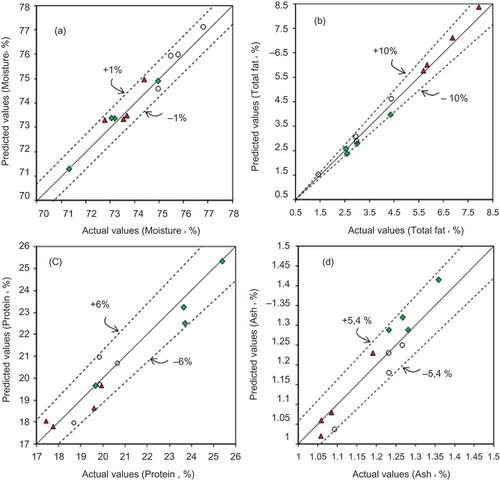
Figure 4. Predicted versus actual values for pH (a), total volatile basic nitrogen (b), peroxide value (c), and 2-thiobarbituric acid reactive substances value (d) of external samples from Atlantic bluefin tuna (![]()
Figura 4. Valores predichos versus reales para pH (a), nitrógeno volátil total (b), índice de peróxido (c), e índice de las sustancias reactivas al ácido 2-tiobarbitúrico (d) de las muestras externas de atún aleta azul (![]()
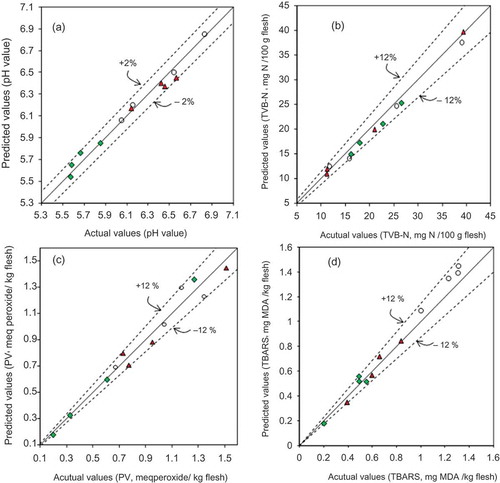
The dashed lines in the plots represent the % RD values. The plots exhibited good correlation for moisture, protein, ash, and pH because the % RD values were less than 6.0%, and for the total fat, it was less than 10%.
In our previous work (Hernández-Martínez et al., Citation2013), the total fat also was predicted for fish samples, and we obtained similar R2, SEC, and SECV values, but lower % RD and RPDcv values. In terms of RPDcv, the total fat prediction was improved with the selected spectral regions applied in the present work.
TVB-N, PV, and TBARS exhibited % RD values less than 12%, and a higher percentage of error as expected for these three parameters because the RPDcv values ranged between 3.21 and 3.67. However, the results of deterioration indices indicate that these models are suitable for screening purposes.
The results of the developed chemometric models confirm the feasibility of the prediction of the chemical composition, pH, and deterioration indices, which are important quality parameters in diverse industries where fish flesh is a raw material.
Conclusion
The chemometric analysis performed with MIR-FTIR spectroscopy in conjunction with the PLS-1 algorithm yielded satisfactory multivariate calibration and validation models that can be applied to monitor several parameters of chilled fillets from Atlantic bluefin tuna, crevalle jack, or Atlantic Spanish mackerel. Chemometric models provide good estimates for the chemical composition (R2 between 0.969 and 0.992, RPDcv between 5.01 and 5.59) and pH (R2 = 0.987, RPDcv = 7.18), and may be used as a rapid screening method to estimate the deterioration indices (R2 between 0.944 and 0.969, RPDcv between 3.21 and 3.67). The major advantages of the developed chemometric models are as follows: the models can be simultaneously applied to chilled fillets of three fish species, the predictions are performed with a small amount of ground fish fillet without generating toxic wastes, and the total time required for the preparation and analysis of the samples was less than 10 min compared to hours for previously reported chemical methods. The MIR-FTIR technique can be adapted for routine analysis in fish industries.
Acknowledgements
The financial support from the Consejo Nacional de Ciencia y Tecnología (CONACyT) and the Secretaría de Estudios de Posgrado e Investigación del Instituto Politécnico Nacional de México (SIP-IPN) is greatly appreciated.
References
- AOAC. (2002). Official methods of analysis of AOAC International (17th ed.). Maryland, MD: Association of Official Analytical Chemists.
- Aubourg, S. P. (1999). Recent advances in assessment of marine lipid oxidation by using fluorescence. Journal of the American Oil Chemists’ Society, 76, 409–419. doi:10.1007/s11746-999-0018-2
- Bureau, S., Ruiz, D., Reich, M., Gouble, B., Bertrand, D., Audergon, J.-M., & Renard, C. M. G. C. (2009). Application of ATR-FTIR for a rapid and simultaneous determination of sugars and organic acids in apricot fruit. Food Chemistry, 115, 1133–1140. doi:10.1016/j.foodchem.2008.12.100
- Cakli, S., Kilinc, B., Cadun, A., Dincer, T., & Tolasa, S. (2007). Quality differences of whole ungutted sea bream (Sparus aurata) and sea bass (Dicentrarchus labrax) while stored in ice. Food Control, 18, 391–397. doi:10.1016/j.foodcont.2005.11.005
- Castañeda-Pérez, E., Osorio-Revilla, G., Gallardo-Velázquez, T., & Proal-Nájera, J. B. (2013). Use of FTIR-HATR coupled to multivariate analysis to monitor the degradation of bioactive compounds during drying of red pepper. Revista Mexicana De Ingeniería Química, 12, 193–204.
- Cheng, J.-H., Dai, Q., Sun, D.-W., Zeng, X.-A., Liu, D., & Pu, H.-B. (2013). Applications of non-destructive spectroscopic techniques for fish quality and safety evaluation and inspection. Trends in Food Science & Technology, 34, 18–31. doi:10.1016/j.tifs.2013.08.005
- CONAPESCA, Comisión, Nacional de Acuacultura y Pesca. (2011). Anuario Estadístico De Acuacultura Y Pesca. Mexico: SAGARPA.
- Connell, J. J. (1995). Control of fish quality (4th ed.). London: Fishing News Books.
- Cozzolino, D., Chree, A., Scaife, J. R., & Murray, I. (2005). Usefulness of near-infrared reflectance (NIR) spectroscopy and chemometrics to discriminate fishmeal batches made with different fish species. Journal of Agricultural and Food Chemistry, 53, 4459–4463. doi:10.1021/jf050303i
- De Fuentes, N. M., Bosch, O. C., & Sánchez, R. F. (2008). Aplicación de la Espectroscopia del Infrarrojo Medio en Química Analítica de Procesos. Boletín De La Sociedad Química De México, 2, 93–103.
- Erkan, N., & Özden, Ö. (2008). Quality assessment of whole and gutted sardines (Sardina pilchardus) stored in ice. International Journal of Food Science and Technology, 43, 1549–1559. doi:10.1111/j.1365-2621.2007.01579.x
- Folch, J., Less, M., & Sloane-Stanley, G. H. (1957). A simple method for the isolation and purification of total lipides from animal tissues. Journal of Biological Chemistry, 226, 497–509.
- Food and Agriculture Organization, FAO. (2001). The composition of fish. Retrieved from FAO website: http://www.fao.org/wairdocs/tan/x5916e/x5916e01.htm
- Galvis-Sánchez, A. C., Tóth, I. V., Portela, A., Delgadillo, I.& Rangel, A. O. S. S. (2011). Monitoring sodium chloride during cod fish desalting process by flow injection spectrometry and infrared spectroscopy. Food Control, 22, 277–282. doi:10.1016/j.foodcont.2010.07.022
- Goulas, A. E., & Kontominas, M. G. (2007). Combined effect of light salting, modified atmosphere packaging and oregano essential oil on the shelf-life of sea bream (Sparus aurata): Biochemical and sensory attributes. Food Chemistry, 100, 287–296. doi:10.1016/j.foodchem.2005.09.045
- Guillén, M. D., & Cabo, N. (1997). Characterization of Edible Oils and Lard by Fourier Transform Infrared Spectroscopy. Relationships between Composition and Frequency of Concrete Bands in the Fingerprint Region. Journal of the American Oil Chemists’ Society, 74, 1281–1286. doi:10.1007/s11746-997-0058-4
- Hernández-Martínez, M., Gallardo-Velázquez, T., & Osorio-Revilla, G. (2010). Rapid characterization and identification of fatty acids in margarines using horizontal attenuate total reflectance Fourier transform infrared spectroscopy (HATR-FTIR). European Food Research and Technology, 231, 321–329. doi:10.1007/s00217-010-1284-9
- Hernández-Martínez, M., Gallardo-Velázquez, T., Osorio-Revilla, G., Almaraz-Abarca, N., Ponce-Mendoza, A., & Vásquez-Murrieta, M. S. (2013). Prediction of total fat, fatty acid composition and nutritional parameters in fish fillets using MID-FTIR spectroscopy and chemometrics. LWT - Food Science and Technology, 52, 12–20. doi:10.1016/j.lwt.2013.01.001
- Jones, P. D., Schimleck, L. R., Daniels, R. F., Clark, A., & Purnell, R. C. (2008). Comparison of Pinus taeda L. whole-tree wood property calibrations using diffuse reflectance near infrared spectra obtained using a variety of sampling options. Wood Science and Technology, 42, 385–400. doi:10.1007/s00226-008-0178-5
- Karoui, R., Lefur, B., Grondin, C., Thomas, E., Demeulemester, C., De Baerdemaeker, J., & Guillard, A. S. (2007). Mid-infrared spectroscopy as a new tool for the evaluation of fish freshness. International Journal of Food Science and Technology, 42, 57–64. doi:10.1111/j.1365-2621.2006.01208.x
- Malle, P., & Poumeyrol, M. (1989). A new chemical criterion for the quality control of fish: Trimethylamine/total volatile basic nitrogen (%). Journal of Food Protection, 52, 419–423.
- Muniategui, S., Paseiro, P., & Simal, J. (1992). Medida del grado de insaturación de aceites y grasas comestibles por espectroscopia infrarroja y su relación con el índice de yodo. Grasas y Aceites, 43, 1–5. doi:10.3989/gya.1992.v43.i1.1188
- Pearson, D. (1976). The chemical analysis of foods (7th ed.). London: Churchill Living stone.
- PerkinElmer. (2000). Spectrum Quant+ Tutorial Version 4.51.02. Beaconsfield, Bucks, UK: PerkinElmer.
- Piña-Barrera, A., Meza-Márquez, O. G., Osorio-Revilla, G., & Gallardo-Velázquez, T. (2014). Identification and quantification of corncob as adulterant in corn dough and tortilla by MIR–FTIR spectroscopy and multivariate analysis. CyTA- Journal of Food, 12, 65–72. doi:10.1080/19476337.2013.796572
- Pink, J., Naczk, M., & Pink, D. (1998). Evaluation of the quality of frozen minced red hake: Use of fourier transform infrared spectroscopy. Journal of Agricultural and Food Chemistry, 46, 3667–3672. doi:10.1021/jf980395u
- Rios-Corripio, M. A., Rojas-López, M., & Delgado-Macuil, R. (2012). Analysis of adulteration in honey with standard sugar solutions and syrups using attenuated total reflectance-Fourier transform infrared spectroscopy and multivariate methods. CyTA-Journal of Food, 10, 119–122. doi:10.1080/19476337.2011.596576
- Rohman, A., & Che Man, Y. B. (2011). Analysis of chicken fat as adulterant in cod liver oil using Fourier transform infrared (FTIR) spectroscopy and chemometrics Análisis de grasa de pollo como adulterante en aceite de hígado de bacalao usando espectroscopía infrarroja con transformada de Fourier (FTIR) y quimometría. CyTA- Journal of Food, 9, 187–191. doi:10.1080/19476337.2010.510211
- Sallam, K. I., Ahmed, A. M., Elgazzar, M. M., & Eldaly, E. A. (2007). Chemical quality and sensory attributes of marinated Pacific saury (Cololabis saira) during vacuum-packaged storage at 4°C. Food Chemistry, 102, 1061–1070. doi:10.1016/j.foodchem.2006.06.044
- Shantha, N., & Decker, E. (1994). Rapid, sensitive, iron-based spectrophotometric methods for determination of peroxide values of food lipids. Journal of AOAC International, 77, 421–424.
- Shenk, J. S., & Westerhaus, M. O. (1995). Analysis of agriculture and food products by near infrared reflectance spectroscopy. Meryland, MA: NIRSystems.
- Shenk, J. S., & Westerhaus, M. O. (1996). Calibration the ISI way. In A. M. C. Davies & P. C. Williams (Eds.), Near infrared spectroscopy: The future waves. Chichester: NIR.
- Silverstein, R. M., Bassler, G. C., & Kiemle, D. J. (2005). Spectrometric identification of organic compounds (7th ed.). New Jersey, NJ John Wiley and Sons.
- Sinelli, N., Spinardi, A., Di Egidioa, V., Mignani, I., & Casiraghia, E. (2008). Evaluation of quality and nutraceutical content of blueberries (Vaccinium corymbosum L.) by near and mid-infrared spectroscopy. Postharvest Biology and Technology, 50, 31–36. doi:10.1016/j.postharvbio.2008.03.013
- Socrates, G. (2001). Infrared and Raman characteristic groups frequencies, tables and charts. Chichester: John Wiley and Sons.
- Soriano, A., Pérez-Juan, P. M., Vicario, A., González, J. M., & Pérez-Coello, M. S. (2007). Determination of anthocyanins in red wine using a newly developed method based on Fourier transform infrared spectroscopy. Food Chemistry, 104, 1295–1303. doi:10.1016/j.foodchem.2006.10.011
- Uddin, M., Okazaki, E., Fukushima, H., Turza, S., Yumiko, Y., & Fukuda, Y. (2006). Nondestructive determination of water and protein in surimi by near-infrared spectroscopy. Food Chemistry, 96, 491–495. doi:10.1016/j.foodchem.2005.04.017
- Williams, P. C. (2001). Implementation of near-infrared technology. In P. C. Williams & K. H. Norris (Eds.), Near-Infrared technology in the agricultural and food industries (pp. 145–169). Minnesota, MN: American Association of Cereal Chemists.
- Zhang, Q., Liu, C., Sun, Z., Hu, X., Shen, Q., & Wu, J. (2012). Authentication of edible vegetable oils adulterated with used frying oil by fourier transform infrared spectroscopy. Food Chemistry, 132, 1607–1613. doi:10.1016/j.foodchem.2011.11.129