
Abstract
Ultraviolet–visible (UV–VIS) and near-infrared (NIR) spectroscopy coupled to artificial neural networks (ANNs) was used as a non-destructive technique to quantify ethanol, glucose, glycerol, tartaric acid, malic acid, acetic acid and lactic acid in aqueous mixtures. Spectral data were obtained for 152 samples. Differing pre-treatments were applied to the spectra and ANN models were obtained using raw and pre-treated data to evaluate several spectral wavelength groupings and ANN training conditions. Feasible calibration models were obtained for ethanol, malic acid and tartaric acid. To validate the process, 120 new samples were measured using the best ANN models. The determination coefficients for the three compounds using this validation set were above 0.9. The results showed the importance of good parameter selection when training the ANN to obtain reliable models. Coupling UV–VIS–NIR spectroscopy to ANN could provide an alternative to conventional chemical methods for determining ethanol, tartaric acid and malic acid in wines.
Se utilizó la espectroscopía ultravioleta-visible (uv–vis) e infrarroja cercana (NIR) acopladas a redes neurales artificiales (ann) como técnica no destructiva para cuantificar varias mezclas acuosas de: etanol, glucosa, glicerol, ácido tartárico, ácido málico, ácido acético y ácido láctico. Se obtuvieron datos espectrales de 152 muestras. Se aplicaron distintos tratamientos previos a los espectros resultantes, obteniéndose los modelos ann a través del uso de datos brutos y de datos tratados previamente para evaluar varios agrupamientos de bandas espectrales y varias condiciones de entrenamiento de las ann. De esta manera, se obtuvieron modelos de calibración viables para el etanol, el ácido málico y el ácido tartárico. Con el fin de validar el proceso, se midieron 120 muestras adicionales utilizando los mejores modelos de las ann. Se constató que, usando este conjunto de validación, los coeficientes de determinación de los tres compuestos superaron 0,9. Los resultados demostraron la importancia de contar con una buena selección de parámetros durante el entrenamiento de las ann con el fin de obtener modelos confiables. La vinculación de la espectroscopía uv–vis–nir a las ann podría ser una alternativa a los métodos químicos convencionales para la determinación de la presencia de etanol, ácido tartárico y ácido málico en los vinos.
1. Introduction
Food authentication is important for the food industry and regulatory agencies. Food and ingredients are easily susceptible to adulteration. Such adulterations are mainly performed to increase profit (Restaino, Fassio, & Cozzolino, Citation2011). Over the last few years, wine has been investigated to determine any adulterations or fraud as well as the origin.
Analytically, wine is a complex mixture of diverse substances such as water, ethanol, carbohydrates, organic acids and polyphenols, among others (Martelo-Vidal & Vázquez, Citation2014). Many of these compounds show biological activity and highly influence the taste and other properties of the wine (Cetó et al., Citation2012). The geographic origin is related to the wine quality, which is determined via sensorial analysis by oenologists and tasters or through expensive and time-consuming analytical methods. Furthermore, oenologists require more tools to improve the winemaking process and determine problems that can occur at all stages of winemaking (Román, Hernández, & Urtubia, Citation2011).
New, rapid analytical methods are required to provide food safety, public health and information about the winemaking process. Moreover, such methods should be inexpensive (Martelo-Vidal, Domínguez-Agis, & Vázquez, Citation2013; Martelo-Vidal & Vázquez, Citation2014). Currently, many advanced instruments are available for improving wine quality. Chemical analysis techniques combined with chemometric methods are the principal practices used to determine wine composition (Fabani, Ravera, & Wunderlin, Citation2013). High performance liquid chromatography (HPLC) is the most used technique followed by near-infrared (NIR) spectroscopy, mass chromatography, electrophoresis and an electronic tongue and nose.
The use of NIR spectral data from 780 to 2500 nm can help to determine the composition of wine or to perform classifications. This technique provides low molar absorptivity, low scattering and high analytical speeds with little to no sample preparation. NIR absorptions result from overtones and combinations of chemical bonds with the C–H, O–H and N–H bonds of interest. Pharmaceutical, chemical and food technologies have used NIR to determine different parameters for measuring food quality (Martelo-Vidal et al., Citation2013). Ultraviolet–visible (UV–VIS) spectroscopy has also been used to determine compounds in wine, such as polyphenols, or to classify wine (Astray, Castillo, Ferreiro-Lage, Gálvez, & Mejuto, Citation2010; Azcarate, Cantarelli, Pellerano, Marchevsky, & Camiña, Citation2013).
An artificial neural network (ANN) is a solving method. ANNs consist of interconnected neurons situated in input, hidden and output layers. They consist of simple processing units (neurons) joined by weighted interconnections. They process data with capabilities similar to the human brain and determine composition via analogy to biological neurons: processing units (neurons) convert input variables into an output. ANNs can predict the physical properties of food from experimental data (Dieulot & Skurtys, Citation2013), and are efficient tools for analysing different data, including non-linear data (Álvarez, Moreno, Jos, Cameán, & Gustavo González, Citation2007). The input neurons receive input data from each observation, and the output neurons predict values for the studied objects. Adjacent layers of neurons are interconnected, and the significance of each connection is expressed as a weight (Kruzlicova et al., Citation2009). The ANNs have learning capabilities, and inserting new data into the systems causes the ANN to relearn and remodel the data (Astray et al., Citation2010).
ANNs have been used in many food technology applications, such as to predict the fatty acid composition of vegetable oils (Yalcin, Toker, Ozturk, Dogan, & Kisi, Citation2012), separate butters from different feedings and production seasons (Gori, Cevoli, Fabbri, Caboni, & Losi, Citation2012), determine the quality and freshness of pork (Huang, Zhao, Zhang, & Chen, Citation2012), determine the protein content or water absorption of cereals or flour (Mutlu et al., Citation2011), predict the antioxidant activity of tea (Cimpoiu, Cristea, Hosu, Sandru, & Seserman, Citation2011) or classify and predict beverages such as wines (Kruzlicova et al., Citation2009; Román et al., Citation2011), apple beverages (Gestal et al., Citation2004) or rice wines (Wei, Wang, & Ye, Citation2011).
In wine technology, ANN has only been used to classify wine (Astray et al., Citation2010). However, ANNs coupled to spectral data can be useful for determining wine composition. Aqueous mixtures of compounds from wines can avoid interference due to the complex wine matrix, which can influence the calibration models. This work evaluates the feasibility of combining ANN with UV–VIS–NIR spectroscopic data to determine the main components of wine (ethanol, glucose, glycerol, tartaric acid, malic acid, acetic acid and lactic acid) using aqueous mixtures of these compounds.
2. Experimental
2.1. Materials
Standard solutions of wine compounds (ethanol, glucose, tartaric acid, malic acid, acetic acid and lactic acid) were prepared to elaborate the mixtures of wine compounds. All standard solutions and samples were prepared using distilled water in aseptic plastic tubes using micropipettes and HPLC-quality reagents.
Samples were prepared across the following ranges: ethanol, 67–132 g/L; glycerol, 4.12–14 g/L; glucose, 0.039–8.66 g/L; tartaric acid, 0.01–6.2 g/L; malic acid, 0.03–2.5 g/L; lactic acid, 0.08–1.2 g/L; and acetic acid, 0.08–1.2 g/L. An experimental design using 152 mixtures was performed following a central composite design (CCD). CCDs have good properties such as insensitivity to outliers and missing data, low collinearity and the use of rotatable and orthogonal blocks (Martelo-Vidal & Vázquez, Citation2014). CCDs use a minimum number of experiments to provide information on the effects of experimental variables and total experimental error. Each wine compound was studied across five levels. Following the CCD design, 152 total samples containing seven variables (wine compounds) were analysed (). To validate the selected models, 120 new samples were measured.
Table 1. CCD experimental design for mixtures of wine compounds.
Tabla 1. Diseño experimental ccd para mezclas de compuestos de vino.
2.2. Spectral measurements and data pre-treatments
Samples were measured in the UV–VIS–NIR regions (190–2500 nm) in the transmittance mode with 2 nm intervals using a quartz cell with a 1 mm path length. Samples were measured using a V-670 spectrophotometer (Jasco Inc, Tokyo, Japan). Spectral data were collected using Spectra ManagerTM II software (Jasco Inc, Tokyo, Japan). The samples were equilibrated for 10 min at 33°C before scanning (Cozzolino et al., Citation2007) and were scanned twice to obtain a total of 304 spectra.
For the spectral analysis, the spectra were exported from Spectra ManagerTM II (Jasco Inc, Tokyo, Japan) to Unscrambler (Version X 10.1, CAMO ASA, Oslo, Norway). Several pre-treatments were evaluated to minimise, reduce and remove undesirable noise. The pre-treatments used were standard normal variate (SNV), Savitzky–Golay smoothing and 2nd derived correction. The raw data were also used for comparison.
A normalisation, 2nd derived correction and baseline correction were sequentially applied to extract the regression coefficients from the partial least square models of the spectra. These coefficients were used to determine a reduced spectral group of peaks that represent the entire mixture and each compound.
Calibrations using the following spectral peak groupings were tested. Peak group A for the whole mixture was 2257, 1870, 1390, 335, 223 and 202 nm. Specific peak groups with higher absorptions for each compound were determined for glucose (2293, 2257, 2240, 1892, 1874, 1743, 1691, 1416, 1391, 1373, 1144, 250, 236 and 202 nm), ethanol (2261, 1889, 1666, 1395, 300, 228 and 202 nm), glycerol (2257, 1872, 1687, 1390, 239, 224, 210 and 202 nm), tartaric acid (2257, 1871, 1388, 856, 348, 334, 223, 209 and 202 nm), malic acid (2261, 1876, 1392, 332, 332, 252, 232 and 208 nm), lactic acid (2257, 1870, 1388, 348, 334, 236, 220, 208 and 202 nm) and acetic acid (2257, 1871, 1690, 1391, 239, 224, 210 and 202 nm). This step was performed to reduce the number of variables used to train the ANN and to obtain models for predicting the mixed compounds (Gestal et al., Citation2004).
2.3. ANN design
An ANN consists of a large number of simple, highly interconnected neurons working in parallel. Input neurons receive input data (xi) connected to a weight (wi). The weight is the connection between neurons () and it is similar to synaptic strength in biological neurons (Kruzlicova et al., Citation2009). Unsupervised methods do not require target outputs to teach the neurons; these methods use various mathematical methods to organise the data itself. For supervised methods, a target output is required to teach the neurons.
Figure 1. Example of the ANN applied to rapid determination of wine compounds. X(1-n) are the responses of the spectral wavelengths selected and Y(1-n) are the concentrations predicted for each compound (g/L).
Figura 1. Ejemplo de la red neural artificial aplicada a la rápida determinación de compuestos de vino. X(1-n) representa las respuestas de la banda espectral seleccionada y Y(1-n) representa la concentración esperada para cada compuesto (g/L).
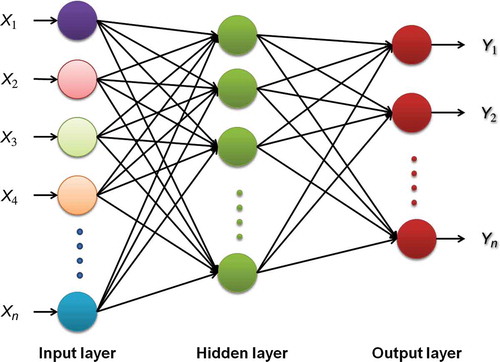
The sum of the input weights goes into a transfer function and an output is generated (expected values). These outputs can be sent to other neurons as inputs or used directly as results. The input layer works with experimental data and the output layer represents the predicted data (Pazourek et al., Citation2005). The number of neurons in the input layer is indicated by the number of variables used. Generally, these are the most important variables in the study. The number of hidden layers depends on the study complexity. The output neurons provide the ANN response. The aim of training is to determine the weight for each neuron that provides the best output for the training set (Kruzlicova et al., Citation2009; Pazourek et al., Citation2005).
NeuroXL Predictor software (Olsoft Llc., Tashkent, Uzbekistan) was used to run the ANN models (training and predicting processes). A multilayer ANN with input, hidden and output layers was chosen.
3. Results and discussion
3.1. Raw UV–VIS–NIR spectral analysis
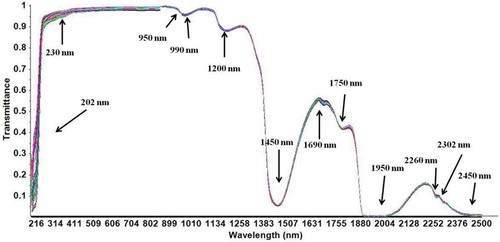
Spectra tend to be dominated by water in the samples. For this reason, the quantitative analysis of wine relies on minor spectral changes. Therefore, determining the studied compounds in aqueous solutions had to be based on small changes. shows the UV–VIS–NIR raw spectra for mixtures of the wine compounds. A visual inspection confirms that peaks at 202 nm and 230 nm in the UV region are related to the carboxyl groups of organic acids. In the NIR region, absorption bands near 1200 nm are related to sugars. Wavelengths near 950 nm and 1460 nm can be related to the third O–H overtone from water absorption. Variations near 990 nm are associated with the O–H stretch second overtones from organic acids and various sugars. The absorptions at 1450 and 1950 nm were related to the first overtone of the O–H stretch and the combined stretch and deformation of O–H groups from water, glucose and ethanol. Absorptions at 1690 nm can be related to the first overtone of the C–H3 stretch, while those at 1750 nm relate to the first overtones of the C–H2 and C–H stretches in glucose, ethanol and water. The absorption at 2260 nm is likely related to a combination of C–H and O–H stretch overtones, the latter from glucose, and absorption at 2302 nm is primarily related to C–H combination vibrations (CH3 and CH2) from ethanol, carbohydrates and organic acids (Cozzolino, Cynkar, Shah, & Smith, Citation2011; Martelo-Vidal & Vázquez, Citation2014; Shen et al., Citation2012).
Figure 2. Raw spectra of 152 samples of mixtures of wine compounds (ethanol, glucose, tartaric acid, malic acid, acetic acid and lactic acid).
Figura 2. Espectros en bruto de 152 muestras de mezclas de compuestos de vino (etanol, glucosa, ácido tartárico, ácido málico, ácido acético y ácido láctico).
3.2. Development of the ANN models
The first step was to set up neurons with different parameters, and the second step was to make a prediction using the best neural network parameters obtained during training. The data were scaled to match the data processing range, and then the output results were scaled back. shows the parameters assayed by the ANN models.
Table 2. Training parameters used in the ANN.
Tabla 2. Parámetros de entrenamiento utilizados en la red neural artificial.
Minimum synapse weights of 0.0001 and 10,000 epochs were used for the training data. An epoch is the number of complete passes through the neural network for the entire set of sample patterns. Different trainings were performed to determine the best neural network parameters. The initial synapse weight was 0.3, and learning rate and momentum were fixed at 0.3 and 0.6, respectively.
A high learning rate often leads to weighting oscillations during the training process, which yield a non-optimal solution. The momentum makes an undesirable result less likely by making the next weight change by a function of the previous weight change, which provides a smoothing effect. The momentum value determines the proportion of the last weight change that is added to the next weight change (momentum values in the range 0–1).
Four different activation functions (hyperbolic tangent, zero-based log-sigmoid, log-sigmoid and bipolar sigmoid) were assayed. Five neuron levels (containing 0, 1, 4, 8 or 15 neurons) were used in the hidden layer and three training runs were assayed (Cetó et al., Citation2012).
Models were developed for peak grouping in the spectral range because the ANN software cannot manage the entire wavelength range (190–2500 nm), which contains 2310 variables. To determine the most representative peaks, a regression was applied using the partial least square methodology across all of the spectra to determine the regression coefficients. The regression coefficient plots of the principal component analysis (PCA) model across all spectra were evaluated using the pre-treated data with normalised, 2nd derived and baseline corrections. The main peak selection criteria were that their wavelengths should have a large absolute regression coefficient value and be in specific peaks and valleys of the regression coefficient curve (Liu, He, Wang, & Sun, Citation2011). Wavelengths with large absolute regression coefficients were assumed to represent useful wavelength bands in the peaks and valleys. Wavelengths with higher absorptions were selected as peak group A for the overall composition. Representative wavelengths with higher absorptions were also obtained for each compound. These peaks were selected by comparing the regression coefficients of each compound (ethanol, glycerol, glucose, tartaric acid, malic acid, acetic acid and lactic acid).
The ANN models were calibrated for peaks from group A. Models were also obtained for the specific wavelengths representative of each compound. The best calibration results are shown in . The predictive capabilities of the model were evaluated using the determination coefficient (r2) and root mean square error of prediction (RMSE) (Chen et al., Citation2011; Martelo-Vidal & Vázquez, Citation2014).
Table 3. Best results of ANN calibration models for the wine compounds.
Tabla 3. Mejores resultados de los modelos de calibración de las ann para los compuestos de vino.
The r2 values should be as close to 1 as possible. Thus, a good model would have r2 values above 0.90. Values between 0.70 and 0.90 indicate that the models can be considered fairly precise, and values below 0.70 indicate that the model can only distinguish low-medium-high values (Liu et al., Citation2011; Urbano-Cuadrado, de Castro, Pérez-Juan, García-Olmo, & Gómez-Nieto, Citation2004).
The calibration shows good predictions for ethanol using both peak group A (r2 = 0.997) and the specific peaks for ethanol (r2 = 0.999). The best ANN model for ethanol was obtained using the following conditions: high absorption peak selection (2261, 1889, 1666, 1395, 300, 228 and 202 nm), SNV pre-treatment of spectral data, training with the hyperbolic activation function, eight neurons in the hidden layer and two consecutive trainings. Using peak group A (2257, 1870, 1390, 335, 223, 202 nm), the best ANN model for ethanol was obtained after the SNV pre-treatment of the spectral data, the bipolar activation function, zero neurons in the hidden layer and three consecutive trainings.
The correlation coefficients were also higher than 0.9 for tartaric acid and malic acid. The RMSE for these compounds was also low, which indicates a good calibration. The best ANN model for tartaric acid using peak group A (r2 = 0.992) was obtained using the smoothing spectral data pre-treatment, the hyperbolic activation function, eight neurons in the hidden layer and three consecutive trainings. A similar r2 value (0.991) was obtained for the best ANN model using the high absorption peaks specific to tartaric acid.
For malic acid, the best ANN model (r2 = 0.903, RMSE = 0.232 g/L) was obtained using the high absorption specific to this compound, the smoothing pre-treatment, the hyperbolic function, one hidden layer and two trainings. A lower r2 value (0.887 and RMSE = 0.248 g/L) was obtained for the best ANN model based on the peaks of group A.
The worst ANN predictions were obtained for glycerol, glucose, acetic acid and lactic acid. These r2 values were below 0.7 for all the conditions studied.
To validate these models, 120 new samples were measured using the best ANN models for ethanol, malic acid and tartaric acid.
shows the real and predicted ethanol values obtained by applying the developed ANN model to the set of calibration and validation samples. The validation confirmed that the ANN model is reliable, showing an r2 of 0.999. shows the real and predicted values obtained by applying the ANN model developed for malic acid to both the calibration and validation sets. This validation was also well fit, with an r2 of 0.925. shows the real and predicted values for tartaric acid, which had an r2 of 0.990. The statistical parameters for the ANN models for predicting ethanol, tartaric acid and malic acid are shown in . These parameters indicate that these models can be used to predict concentrations of these three wine compounds in aqueous solutions.
Figure 3. Reference and predicted values for ethanol using the best ANN models obtained using the specific group of peaks for ethanol.
Figura 3. Valores de referencia y valores esperados para etanol, usando los mejores modelos de las ann obtenidos mediante el uso del grupo específico de picos para etanol.
Figure 4. Reference and predicted values for malic acid using the best ANN models obtained using specific group of peaks for malic acid.
Figura 4. Valores de referencia y valores esperados para ácido málico, usando los mejores modelos de las ann obtenidos mediante el uso del grupo específico de picos para ácido málico.
Figure 5. Reference and predicted values for tartaric acid using the best ANN models obtained using group of peaks A (2257, 1870, 1390, 335, 223 and 202 nm).
Figura 5. Valores de referencia y valores esperados para ácido tartárico usando los mejores modelos de las ann obtenidos mediante el uso de picos A (2257, 1870, 1390, 335, 223 y 202 nm).
Table 4. Validation of ANN model for best prediction models (tartaric acid, malic acid and ethanol).
Tabla 4. Validación de modelos ann para los mejores modelos de predicción (ácido tartárico, ácido málico y etanol).
The obtained predictions were in the range of other studies for wine, beer and other beverages using NIR spectral data and other methodologies (without ANN). For example, ethanol (r2 0.990 and RMSE 1.04 g/L), glycerol (r2 0.988 and RMSE 0.81 g/L), malic acid (r2 0.985 and RMSE 0.56 g/L), glucose (r2 0.994 and RMSE 1.84 g/L) and acetic acid (r2 0.988 and RMSE 0.42 g/L) were correctly predicted in wines (Urtubia, Perez-Correa, Meurens, & Agosin, Citation2004). Tartaric acid (r2 0.995 and RMSE 0.246 g/L) and acetic acid (r2 0.999 and RMSE 0.603 g/L) were predicted in fruit vinegars (Liu et al., Citation2011). Glucose (r2 0.990 and RMSE 1.32 g/L), ethanol (r2 0.990 and RMSE 2.04 g/L) and glycerol (r2 0.990 and RMSE 0.49 g/L) were predicted during the fermentation of must (Di Egidio, Sinelli, Giovanelli, Moles, & Casiraghi, Citation2010). Ethanol was predicted in beer (r2 0.997 and RMSE 3.19 g/L) (Castritius, Kron, Schäfer, Rädle, & Harms, Citation2010).
These results show that the ANN provided reliable models that can rapidly determine ethanol, tartaric acid and malic acid using UV–VIS–NIR spectral data.
4. Conclusions
Reliable models for predicting ethanol, tartaric acid and malic acid using ANN coupled with UV–VIS–NIR spectra can be obtained. The results demonstrate the importance of good parameter selection during ANN training to obtain reliable models. Further studies are needed to validate the models using real wine.
References
- Álvarez, M., Moreno, I. M., Jos, Á., Cameán, A. M., & Gustavo González, A. (2007). Differentiation of ‘two Andalusian DO ‘fino’ wines according to their metal content from ICP-OES by using supervised pattern recognition methods. Microchemical Journal, 87(1), 72–76. doi:10.1016/j.microc.2007.05.007
- Astray, G., Castillo, J. X., Ferreiro-Lage, J. A., Gálvez, J. F., & Mejuto, J. C. (2010). Artificial neural networks: A promising tool to evaluate the authenticity of wine. Redes neuronales: Una herramienta prometedora para evaluar la autenticidad del vino. Cyta-Journal of Food, 8(1), 79–86. doi:10.1080/19476330903335277
- Azcarate, S. M., Cantarelli, M. Á., Pellerano, R. G., Marchevsky, E. J., & Camiña, J. M. (2013). Classification of Argentinean Sauvignon blanc wines by UV spectroscopy and chemometric methods. Journal of Food Science, 78(3), C432-C436. doi:10.1111/1750-3841.12060
- Castritius, S., Kron, A., Schäfer, T., Rädle, M., & Harms, D. (2010). Determination of alcohol and extract concentration in beer samples using a combined method of near-infrared (NIR) spectroscopy and refractometry. Journal of Agricultural and Food Chemistry, 58(24), 12634–12641. doi:10.1021/jf1030604
- Cetó, X., Gutiérrez, J., Gutiérrez, M., Céspedes, F., Capdevila, J., Mínguez, S. … del Valle, M. (2012). Determination of total polyphenol index in wines employing a voltammetric electronic tongue. Analytica Chimica Acta, 732, 172–179. doi:10.1016/j.aca.2012.02.026
- Chen, L., Xue, X., Ye, Z., Zhou, J., Chen, F., & Zhao, J. (2011). Determination of Chinese honey adulterated with high fructose corn syrup by near infrared spectroscopy. Food Chemistry, 128(4), 1110–1114. doi:10.1016/j.foodchem.2010.10.027
- Cimpoiu, C., Cristea, V., Hosu, A., Sandru, M., & Seserman, L. (2011). Antioxidant activity prediction and classification of some teas using artificial neural networks. Food Chemistry, 127(3), 1323–1328. doi:10.1016/j.foodchem.2011.01.091
- Cozzolino, D., Cynkar, W., Shah, N., & Smith, P. (2011). Quantitative analysis of minerals and electric conductivity of red grape homogenates by near infrared reflectance spectroscopy. Computers and Electronics in Agriculture, 77(1), 81–85. doi:10.1016/j.compag.2011.03.011
- Cozzolino, D., Liu, L., Cynkar, W. U., Dambergs, R. G., Janik, L., Colby, C. B., & Gishen, M. (2007). Effect of temperature variation on the visible and near infrared spectra of wine and the consequences on the partial least square calibrations developed to measure chemical composition. Analytica Chimica Acta, 588(2), 224–230. doi:10.1016/j.aca.2007.01.079
- Di Egidio, V., Sinelli, N., Giovanelli, G., Moles, A., & Casiraghi, E. (2010). NIR and MIR spectroscopy as rapid methods to monitor red wine fermentation. European Food Research and Technology, 230(6), 947–955. doi:10.1007/s00217-010-1227-5
- Dieulot, J., & Skurtys, O. (2013). Classification, modeling and prediction of the mechanical behavior of starch-based films. Journal of Food Engineering, 119(2), 188–195. doi:10.1016/j.jfoodeng.2013.05.028
- Fabani, M. P., Ravera, M. J. A., & Wunderlin, D. A. (2013). Markers of typical red wine varieties from the Valley of Tulum (San Juan-Argentina) based on VOCs profile and chemometrics. Food Chemistry, 141(2), 1055–1062. doi:10.1016/j.foodchem.2013.04.046
- Gestal, M., Gómez-Carracedo, M. P., Andrade, J. M., Dorado, J., Fernández, E., Prada, D., & Pazos, A. (2004). Classification of apple beverages using artificial neural networks with previous variable selection. Analytica Chimica Acta, 524(1–2), 225–234. doi:10.1016/j.aca.2004.02.030
- Gori, A., Cevoli, C., Fabbri, A., Caboni, M. F., & Losi, G. (2012). A rapid method to discriminate season of production and feeding regimen of butters based on infrared spectroscopy and artificial neural networks. Journal of Food Engineering, 109(3), 525–530. doi:10.1016/j.jfoodeng.2011.10.029
- Huang, L., Zhao, J., Zhang, Y., & Chen, Q. (2012). Simultaneous multi-component analysis of pork meat during bacterial spoiling process by FT-NIR evaluated with a non-linear algorithm. Analytical Methods, 4(11), 3816–3823. doi:10.1039/c2ay25623a
- Kruzlicova, D., Mocak, J., Balla, B., Petka, J., Farkova, M., & Havel, J. (2009). Classification of slovak white wines using artificial neural networks and discriminant techniques. Food Chemistry, 112(4), 1046–1052. doi:10.1016/j.foodchem.2008.06.047
- Liu, F., He, Y., Wang, L., & Sun, G. (2011). Detection of organic acids and ph of fruit vinegars using near-infrared spectroscopy and multivariate calibration. Food and Bioprocess Technology, 4(8), 1331–1340. doi:10.1007/s11947-009-0240-9
- Martelo-Vidal, M., Domínguez-Agis, F., & Vázquez, M. (2013). Ultraviolet/visible/near-infrared spectral analysis and chemometric tools for the discrimination of wines between subzones inside a controlled designation of origin: A case study of rías baixas. Australian Journal of Grape and Wine Research, 19, 62–67. doi:10.1111/ajgw.12003
- Martelo-Vidal, M. J., & Vázquez, M. (2014). Evaluation of ultraviolet, visible and near infrared spectroscopy for the analysis of wine compounds. Czech Journal of Food Sciences, 32, 37–47.
- Mutlu, A. C., Boyaci, I. H., Genis, H. E., Ozturk, R., Basaran-Akgul, N., Sanal, T., & Evlice, A. K. (2011). Prediction of wheat quality parameters using near-infrared spectroscopy and artificial neural networks. European Food Research and Technology, 233(2), 267–274. doi:10.1007/s00217-011-1515-8
- Pazourek, J., Gajdošová, D., Spanilá, M., Farková, M., Novotná, K., & Havel, J. (2005). Analysis of polyphenols in wines: Correlation between total polyphenolic content and antioxidant potential from photometric measurements - prediction of cultivars and vintage from capillary zone electrophoresis fingerprints using artificial neural network. Journal of Chromatography A, 1081(1), 48–54. doi:10.1016/j.chroma.2005.02.056
- Restaino, E., Fassio, A., & Cozzolino, D. (2011). Discrimination of meat patés according to the animal species by means of near infrared spectroscopy and chemometrics discriminación de muestras de paté de carne según tipo de especie mediante el uso de la espectroscopia en el infrarrojo cercano y la quimiometria. Cyta-Journal of Food, 9, 210–213. doi:10.1080/19476337.2010.512396
- Román, R. C., Hernández, O. G., & Urtubia, U. A. (2011). Prediction of problematic wine fermentations using artificial neural networks. Bioprocess and Biosystems Engineering, 34(9), 1057–1065. doi:10.1007/s00449-011-0557-4
- Shen, F., Yang, D. T., Ying, Y. B., Li, B. B., Zheng, Y. F., & Jiang, T. (2012). Discrimination between shaoxing wines and other chinese rice wines by near-infrared spectroscopy and chemometrics. Food and Bioprocess Technology, 5, 786–795. doi:10.1007/s11947-010-0347-z
- Urbano-Cuadrado, M., de Castro, M. D. L., Pérez-Juan, P. M., García-Olmo, J., & Gómez-Nieto, M. A. (2004). Near infrared reflectance, spectroscopy and multivariate analysis in enology - Determination or screening of fifteen parameters in different types of wines. Analytica Chimica Acta, 527(1), 81–88. doi:10.1016/j.aca.2004.07.057
- Urtubia, A., Perez-Correa, J. R., Meurens, M., & Agosin, E. (2004). Monitoring large scale wine fermentations with infrared spectroscopy. Talanta, 64(3), 778–784. doi:10.1016/j.talanta.2004.04.005
- Wei, Z., Wang, J., & Ye, L. (2011). Classification and prediction of rice wines with different marked ages by using a voltammetric electronic tongue. Biosensors & Bioelectronics, 26(12), 4767–4773. doi:10.1016/j.bios.2011.05.046
- Yalcin, H., Toker, O. S., Ozturk, I., Dogan, M., & Kisi, O. (2012). Prediction of fatty acid composition of vegetable oils based on rheological measurements using nonlinear models. European Journal of Lipid Science and Technology, 114(10), 1217–1224. doi:10.1002/ejlt.201200040