
ABSTRACT
Due to the matrix complexity for wheat-based products, a comparative study of different rapid extraction procedures was performed for the extraction of enniatins (ENA, ENA1, ENB, ENB1) and beauvericin in flour, pasta, breakfast cereals, and biscuits. Three different approaches were studied during the extraction and purification steps (shaker, Ultra-Turrax, and QuEChERS) for each matrix. Liquid chromatography coupled to tandem mass spectrometry (LC-MS/MS) with electrospray source working in a positive mode was used. For the analysis of the five mycotoxins, the three methods were tested in terms of recovery, matrix effect, and sensibility, concluding that Ultra-Turrax extraction was the most competent method. The applicability of the validated method was demonstrated by analyzing 16 commercial samples from Romania.
RESUMEN
Debido a la complejidad de los productos elaborados con trigo, se ha realizado un estudio comparativo de diferentes procesos de extracción rápida de eniatinas (ENA, ENA1, ENB, ENB1) y beauvericina en harina, pasta, cereales para el desayuno y galletas. Se estudiaron tres procedimientos (agitación, Ultra-Turrax, QuEChERS) en cada matriz con distintos pasos de extracción y purificación. Se utilizó la cromatografía líquida acoplada a espectrometría de masas en tándem (LC-MS/MS) con fuente de electroespray en modo positivo. Los tres métodos fueron estudiados para el análisis de las cinco micotoxinas, en términos de recuperación, efecto matriz y sensibilidad, concluyendo que el método de extracción con Ultra-Turrax fue el que mejores resultados proporcionó. La aplicabilidad del método validado se demostró con el análisis de 16 muestras comercializadas en Rumania.
Introduction
Some fungi can produce a wide variety of mycotoxins as a result of their secondary metabolism. Many important food commodities can be contaminated by Fusarium mycotoxins which include trichothecenes, zearalenone, and fumonisins, with their derivatives, and also the newest group of emerging mycotoxins composed mainly of enniatins (ENs), beauvericin (BEA), fusaproliferin (FUS), and moniliformin (MON) (Stanciu et al., Citation2015).
The occurrence and toxicity of emerging mycotoxins are currently under evaluation by the European Food Safety Authority (EFSA) Panel on Contaminants in Food Chain (CONTAM), and according to scientific opinion, there is insufficient information on the risk characterization of mycotoxins. In this regard, one EFSA recommendation was to develop and validate sensitive methods for the analysis of emerging mycotoxins in food, especially in products for direct human consumption (EFSA, Citation2014).
Regarding emerging mycotoxins, the class of ENs (ENA, ENA1, ENB, and ENB1) and BEA has received more interest in the past decade. These mycotoxins are bioactive substances with a cyclic hexadepsipeptide structure. ENs can act as enzyme inhibitors, having antimicrobial, anthelmintic, insecticidal, antifungal, herbicidal, phytotoxic, and cytotoxic potential activity (Escrivá, Font, & Manyes, Citation2015) or local central nervous system effects (Taevernier et al., Citation2016). BEA has shown to be a specific cholesterol acyltransferase inhibitor, with antimicrobial, antiviral, cytotoxic, apoptotic, and immunosuppressive activity (Ruiz, Franzova, Juan-Garcia, & Font, Citation2011). Furthermore, due to their similar chemical structures, it has been demonstrated by in vitro studies that ENs and BEA can present additive or synergistic cytotoxic effects in several cell lines (Juan-Garcia, Ruiz, Font, & Manyes, Citation2015).
Mycotoxin contamination in different grains and food based on grains is of major importance due to its remarkable implications for food safety (EFSA, Citation2014). Wheat is the most consumed cereal worldwide. So, studies on presence of emerging mycotoxins in wheat-based products are useful for the assessment of human exposure to mycotoxins. Several authors reported high occurrence of ENs and BEA in grains and wheat-based products like pasta, infant formulas, breakfast cereals, and biscuits, with incidences between 40% and 90% (Blesa, Marín, Lino, & Mañes, Citation2012; Jestoi, Citation2008; Juan, Mañes, Raiola, & Ritieni, Citation2013a; Juan, Ritieni, & Mañes, Citation2013b; Mahnine et al., Citation2011; Malachova et al., Citation2011; Oueslati, Meca, Mliki, Ghorbel, & Mañes, Citation2011). Regarding the simultaneous presence of ENs and BEA or co-occurrence with other mycotoxins in wheat-based products, there is a lack of information in the literature (Smith, Madec, Coton, & Hymery, Citation2016).
Nowadays, food industry needs rapid, accessible, and preferable multi-mycotoxin analysis (Bryła et al., Citation2016). Therefore, it is imperative to create sustainable extraction methods for reliable detection and quantification of ENs and BEA.
Approaches on analysis of ENs and BEA commonly use solid–liquid extraction (SLE) with appropriate solvents, through the application of conventional extractions (Garcia-Moraleja, Font, Mañes, & Ferrer, Citation2015; Juan, Covarelli, Beccari, Colasante, & Mañes, Citation2016; Serrano, Font, Mañes, & Ferrer, Citation2013b). Juan, Ritieni, and Mañes (Citation2012) tested various solvent mixtures to extract trichothecenes and zearalenone from cereal grains, flour, and bread, and the highest recoveries and the lowest matrix influence were reported for the mixture acetonitrile/water (84:16, v/v). After this, the method was applied successfully in other studies to extract ENs and BEA too from cereal and cereal products (Juan et al., Citation2013b). Serrano, Font, Mañes, and Ferrer (Citation2013a) studied acetonitrile, methanol, ethyl acetate, and a mixture of acetonitrile/methanol (50:50, v/v) as solvents to extract emerging mycotoxins from pasta using Ultra-Turrax, and the best results were obtained for acetonitrile. QuEChERS methodology (quick, easy, cheap, effective, rugged, and safe) has also been employed for multi-mycotoxin analysis (Malachova et al., Citation2011). Rodríguez-Carrasco, Berrada, Font, and Mañes (Citation2012) presented the optimum steps of QuEChERS procedure for wheat semolina: micro-scale extraction with water/acetonitrile (77:23 or 72:28, v/v), MgSO4 and NaCl, and a cleanup based on a dispersive solid-phase extraction (d-SPE) with MgSO4 and C18 used as sorbents to retain co-extracted compounds, such as sugar and fatty acids. So far, only two studies have presented the comparative assessment of different extraction procedures for determination of emerging mycotoxins in pasta and biscuits (Capriotti et al., Citation2014; Serrano et al., Citation2013a).
The aim of this study was to evaluate three different extraction procedures (Ultra-Turrax homogenizer, rotatory shaker, and QuEChERS) to select the method with the best performance for emerging mycotoxin (ENA, ENA1, ENB, ENB1, and BEA) extraction followed by LC-MS/MS analysis on flour, pasta, breakfast wheat-based cereals, and biscuits. Displaying the applicability of the validated method, it was used to analyze sixteen samples, four from each matrix included in the study.
Materials and methods
Chemicals and reagents
HPLC-grade acetonitrile and methanol were supplied by PanReac AppliChem (Castellar del Vallés, Spain), and methanol LC-MS/MS grade (≥99.9%) was supplied by VWR International Eurolab (Llinars del Vallés, Barcelona, Spain).
For mobile phases, ammonium acetate (≥97%) was supplied by Panreac Quimica S.A.U. (Barcelona, Spain), and acetate acid (100%) was obtained from Merck KGaA (Darmstadt, Germany). Deionized water (<10 MΩ cm−1 resistivity) was obtained in the laboratory using a Milli-Q SP® Reagent Water System (Millipore, Bedford, MA, USA).
Anhydrous magnesium sulfate (99.5%) powder was obtained from Alfa Aesar GmbH & Co. (Karlsruhe, Germany); sodium chloride was purchased from Merck KGaA (Darmstadt, Germany); C18 was purchased from Phenomenex (Torrance, CA, USA).
Filter papers of Whatman No. 4 type (Maidstone, England) were used to filter the extract samples. Polypropylene syringes (2 mL) and nylon filters (13 mm diameter, 0.22 μm pore size) were purchased from Análisis Vínicos S.L. (Tomelloso, Spain).
The certified standards of ENs (A, A1, B, B1) and BEA were purchased from Sigma Aldrich (Madrid, Spain). The individual stock solutions of ENs and BEA were prepared in acetonitrile at 500 μg mL−1. Also, a working mixed standard solution in methanol, at concentrations of 0.4 μg mL−1 for ENs and 0.25 μg mL−1 for BEA, was prepared by diluting the individual stock solutions. This solution was used to construct the standard calibration curves, matrix-matched calibration curves and for recovery and repeatability studies (intraday and interday). The solutions were kept in glass-stoppered bottles and in darkness under safety conditions at −20°C.
Sampling
Mycotoxin-free powdered samples were used as blank material for validation study. Also, a total of 16 samples of wheat-based products were purchased from different markets located in Cluj-Napoca (Romania), during April 2016: white wheat flour (n = 4); pasta with minimum of 73% wheat (n = 4); breakfast cereals containing wheat between 54% and 90% (n = 4); integral biscuits containing wheat between 49% and 95% (n = 4). The samples were analyzed in order to assess the applicability of the method validated.
Sampling was performed according to the EU guidelines (EC, Citation2006) for the official control of legislated mycotoxins for lots of cereals and cereal products less than 0.5 tons. Consequently, two to six packages for each sample were purchased, obtaining an aggregate sample of at least 1 kg total weight. All samples were milled to a fine powder using a laboratory mill. After homogenization, 500 g samples were packed in plastic bags and kept at 4°C in a dark and dry place until analysis. Three replicates for each sample were weighed for analysis.
Extraction procedures
Two methods using SLE (Ultra-Turrax and rotatory shaker) and the QuEChERS procedure were tested. For extraction using the rotatory shaker, the method of Juan et al. (Citation2013b) was used. Sample extraction with Ultra-Turrax and QuEChERS were performed according to the methods of Serrano et al. (Citation2013b) and Rodríguez-Carrasco et al. (Citation2012), respectively, with some modifications for each procedure. An Eppendorf Centrifuge 5810R (Eppendorf, Hamburg, Germany) for centrifugation and a multi-sample Turbovap LV Evaporator (Zymark, Hopkinton, MA, USA) for evaporation to dryness at 35°C with a gentle stream of nitrogen were used. On the day of analysis, the residue of each extraction was reconstituted to a final volume of 1 mL with methanol/water (70:30, v/v) and filtered through a syringe nylon filter. All experiments were carried out in triplicates.
SLE with rotatory shaker
Sub-samples were weighed (2 g) and placed into 50 mL polytetrafluoroethyl (PTFE) centrifugal tubes, followed by the addition of 10 mL acetonitrile/water (84:16, v/v) mixture. The tubes were stirred for 1 hour at 300 shakes min−1 using a horizontal shaking device (IKA KS260 basic Stirrer, Staufen, Germany), centrifuged for 5 min at 5°C and 4500 rpm (3644 g), and then filtered on a Whatman filter paper. Furthermore, 5 mL of supernatant was placed in 15 mL PTFE centrifugal tubes and was evaporated to dryness.
SLE with Ultra-Turrax
Sub-samples of 2 g, weighed into 50 mL PTFE centrifugal tubes, were extracted with 20 mL of acetonitrile using IKA T18 basic Ultra-Turrax homogenizer (Staufen, Germany) for 3 min. After this, samples were centrifuged for 5 min at 5°C and 3550 rpm (2268g) and filtered on a Whatman filter paper. Ten milliliter of supernatant placed in 15 mL PTFE centrifugal tubes was evaporated to dryness.
QuEChERS procedure
Sub-samples of 5 g were weighed into 50 mL PTFE centrifugal tubes and 25 mL of distilled water was added prior to sonication for 15 min. The main extraction involved the addition of 10 mL of acetonitrile, 4 g of MgSO4, and 1 g of NaCl. To induce phase separation and mycotoxin partitioning, the tubes were shaken on a vortex for 30 s and centrifuged for 5 min at 5°C and 4500 rpm. Then the upper layer was submitted to a dispersive SPE cleanup with a mixture of 900 mg of MgSO4 and 300 mg of C18. The tubes were vortexed for 30 s and centrifuged for 1 min at 5°C and 1500 rpm (405g). After purification, the supernatants were transferred into 15 mL PTFE centrifugal tubes and were evaporated to dryness.
LC-MS/MS
ENs and BEA were analyzed using a LC-MS/MS system, consisting of a LC Agilent 1200 using a binary pump and an automatic injector, and coupled to a 3200 QTRAP® AB SCIEX (Applied Biosystems, Foster City, CA, USA) equipped with a Turbo-V™ source (electrospray ionization) interface. The chromatographic separation of the compounds was conducted at 24 ± 1°C on a reverse-phase analytical column Gemini® C18 (3 μm, 150 × 2 mm ID) and a guard-column C18 (4 x 2 mm, ID; 3 μm) from Phenomenex (Madrid, Spain). Mobile phases were as follows: methanol (0.1% acetic acid and 5 mM ammonium acetate) as Phase A and water (0.1% acetic acid and 5 mM ammonium acetate) as Phase B. The following gradient was used: equilibration at 90% B for 2 min, from 80% to 20% B in 3 min, 20% B for 1 min, from 20% to 10% B in 2 min, 10% B for 6 min, from 10% to 0% B in 3 min, 100% A for 1 min, from 100% to 50% A in 3 min, return to initial conditions in 2 min, and maintain at initial conditions for 2 min. The flow rate was 0.25 mL min−1 in all steps. Total run time was 21 min. The injection volume was 20 µL.
With regard to mycotoxin analysis, the QTRAP System was used as selected reaction monitoring (SRM). The Turbo-V™ source was used in positive mode with the following settings for source/gas parameters: vacuum gauge (10e-5 Torr) 3.1, curtain gas (CUR) 20, ion spray voltage (IS) 5500, source temperature (TEM) 450°C, ion source gas 1 (GS1), and ion source gas 2 (GS2) 50. Specific parameters are shown in . The entrance potential (EP) was the same for all analytes, i.e. 10 V. Acquisition and processing data were performed using Analyst® software, version 1.5.2 (AB SCIEX, Concord, ON, Canada).
Table 1. Chemical formulas, chemical structures, retention times, precursor and product ions, and MS/MS parameters of the analyzed mycotoxins.
Tabla 1. Fórmulas y estructuras químicas, tiempo de retención, iones precursores y producto y parámetros de MS/MS para las micotoxinas analizadas.
Method validation
Validation of the method was performed for linearity, accuracy, repeatability (intraday and interday precision), and sensibility, following the EU Commission Decision 2002/657/EC (EC, Citation2002).
The criteria for confirmation of positive findings were: comparison of peak area ratios for quantification (Q) and confirmation (q) transitions with that of the reference standard; peak ratio of the confirmation transition against quantification one; agreement with the retention times.
Matrix effect (ME) was assessed for each analyte by comparing the slope of the standard calibration curve (astandard) with that of the matrix-matched calibration curve (amatrix), for the same concentration levels. Thus, the ratio (amatrix/astandard × 100) is defined as the ME. A value of 100% indicates that there is no ME, values higher than 100% reflect the enhancement of the signal, while values below 100% reflect the suppression of the signal.
For linearity evaluation and quantification in commercial samples, matrix-matched calibration curves were constructed at concentration levels between 200 and 0.5 μg kg−1.
Sensitivity was evaluated by limit of detection (LD) and limit of quantification (LQ), which were estimated for a signal-to-noise ratio (S/N) ≥3 and ≥10, respectively, from chromatograms of samples spiked at the lowest level validated.
Accuracy was evaluated through recovery studies, whichwere carried out by fortifying blank wheat at three different concentration levels: the same as the LQs, 2 times more than LQs, and 10 times more than LQs. The spiked samples were left to stand for 3 h at room temperature before the extraction to establish equilibration between mycotoxins and the matrix. Intraday precision and interday precision (repeatability) of the method were carried out by spiking wheat at the three levels previously indicated. Method precision was estimated by calculating the relative standard deviation (RSD) using the results obtained during the same day (intraday) and on three different days (interday) by the repeated analysis three times at the three spiked levels.
Results and discussion
Wheat-based products are complex matrices, containing carbohydrates and sometimes significant quantities of fat, micronutrients, or additives. However, a significant ME can be present, leading to high signal suppression and low sensitivity, depending on the extraction and purification methods. Consequently, trying to select the best procedure to apply for the study of a wide variety of wheat-based products to extract simultaneously several mycotoxins can be very difficult. Thus, in our study, different extraction methods were compared.
Extraction procedures
Three of the most used methods to analyze emerging mycotoxins have been studied in this work. Two of them are SLEs and the third one is a QuEChERS extraction procedure. The two methods using SLE differ in the method of shaking and the solvents used. For rotatory shaker, a mixture of acetonitrile/water (84:16, v/v) was used and an exterior agitation was applied, while for Ultra-Turrax the solvent was acetonitrile and the agitation was performed into the extract, including homogenization. The extraction with Ultra-Turrax was slightly modified compared to the one presented by Serrano et al. (Citation2013b). The proportionality between sample and solvent was kept, but we worked with 2g of sample; to save time and to minimize ME, the step of evaporation with Rotavapor was excluded, and the extract was evaporated to dryness directly by nitrogen. In this way, the final concentration for both extractions using SLE was the same.
For the third method, a QuEChERS procedure with purification step was applied. The method of Rodríguez-Carrasco et al. (Citation2012) was used with two modifications. Due to the high absorbability of the wheat products like flour and biscuits, a higher volume of solvent was added (10 mL of acetonitrile, instead of 7.5 mL) and to induce phase separation and mycotoxins partitioning after salts addition, the tubes were centrifuged for more time at low temperature (5 min at 5°C and 4500 rpm, instead of 3 min and 4000 rpm).
The efficiency of the three methods was tested to decide the most appropriate extraction procedure for emerging mycotoxins from flour, pasta, breakfast cereals, and biscuits, respectively. Recovery, ME, sensibility, and extraction time were evaluated for each technique separately. Spiked blanks were analyzed at concentrations of 100, 25, and 12.5 μg kg−1 for ENs and at 62.5, 16, and 8 μg kg−1 for BEA.
Rotatory shaker procedure had very good results (ME and recovery between 72% and 127%) to extract simultaneously the five emerging mycotoxins from breakfast cereals, and good results (ME and recovery between 53% and 125%) for the extraction of wheat flour, pasta, and biscuits. Analytical results reflected predominant signal suppression (ME between 73% and 98%), except for ENA in flour and pasta (125% and 104%, respectively) and for ENB in flour and breakfast cereals (125% and 106%, respectively), for which a signal enhancement was observed. Mean recoveries were: from 53% (ENA1) to 82% (BEA) in flour; from 58% (ENA1) to 93% (BEA) in pasta; from 72% (ENB) to 127% (BEA) in breakfast cereals; and from 53% (ENB) to 93% (ENA) in biscuits.
Using Ultra-Turrax procedure, which gave the best results to extract ENs and BEA from the four matrices analyzed, the ME and recovery were higher than 70%. ME showed very good values, a dominant signal enhancement being observed for all mycotoxins in all matrices (ME between 101% and 123%), except for ENB in flour, pasta, and breakfast cereals, and for BEA in biscuits, where a signal suppression was present with acceptable values (80%, 81%, 82%, and 99%, respectively). The accuracy of the method revealed mean recoveries from 70% to 111%.
QuEChERS procedure has the advantage of giving purified extracts, but, having more steps in the extraction process, recovery and ME could be negatively influenced. This method offered a wide range of values for these parameters. Signal suppression was observed for ENB in flour, pasta, and biscuits (36%, 32%, and 87%, respectively) and for ENA, ENA1, and ENB in flour (57%, 47%, and 74%, respectively) and pasta (94%, 90%, and 90%, respectively). In the other situations, a signal enhancement was present (ME between 104% and 144%). The mean recoveries were between: 81% (ENB) and 125% (BEA) in flour; 67% (BEA) and 103% (ENB) in pasta; 50% (ENB) and 95% (BEA) in breakfast cereals; and 57% (ENB) and 97% (BEA) in biscuits.
Selection of the most suitable extraction procedure
The results from the comparative study of the three methods for EN and BEA extraction from flour, pasta, breakfast cereals, and biscuits are presented in and .
Figure 1. Mean recoveries for wheat-based products presented by extraction procedures: (a) Shaker, (b) Ultra-Turrax, (c) QuEChERS.
Figura 1. Recuperaciones medias de los productos elaborados con trigo según el proceso de extracción: (a) Agitación, (b) Ultra-Turrax, (c) QuEChERS.
Figure 2. Matrix effect for wheat-based products presented by extraction procedures: (a) Shaker, (b) Ultra-Turrax, (c) QuEChERS.
Figura 2. Efecto matriz para productos elaborados con trigo según el proceso de extracción: (a) Agitación, (b) Ultra-Turrax, (c) QuEChERS.
Regarding the recovery values for flour, all procedures presented very good recoveries for BEA and ENB1 (between 74% and 125%), while for ENA, ENA1, and ENB, Ultra-Turrax and QuEChERS procedures gave the best values (between 77% and 113%). Analyzing recoveries for pasta, all procedures presented satisfactory results (from 58% to 110%). With regard to breakfast cereals and biscuits, all methods presented good recoveries for BEA, ENA, ENA1, and ENB1 (from 66% to 127%); for ENB, Shaker and Ultra-Turrax procedures gave satisfactory values for breakfast cereals (72% and 79%, respectively), while for biscuits, an optimum recovery (82%) was obtained only using Ultra-Turrax.
With respect to ME for flour and pasta, QuEChERS procedure gave unsatisfactory ME values. A high suppression for ENA1 (47%) and ENB (36%) in flour was present, while in pasta a high suppression for ENB (32%) simultaneously with a high signal enhancement for BEA (144%) was present. For breakfast cereals and biscuits, competitive results for ME (from 87% to 130%) were observed using the three procedures.
A good linearity for ENs and BEA was observed for all methods in the four matrices, correlation coefficients (r2) being at least 0.989, 0.990, and 0.963 for Shaker, Ultra-Turrax, and QuEChERS, respectively. On the other hand, the extraction with Ultra-Turrax provided the best LDs and LQs.
Analyzing all the results for recovery and ME and taking into account that the extraction procedure must serve for a simultaneous analysis of ENs and BEA, the most suitable procedure for the extraction of these mycotoxins from flour, pasta, breakfast cereals, and biscuits was the Ultra-Turrax method, giving values higher than 80% and 70% for ME and recovery, respectively. Moreover, the levels for ME and recovery were uniform for this procedure, with a reduced range of values. The use of Ultra-Turrax provided optimum recoveries and satisfactory values for ME for ENs and BEA, probably because the Ultra-Turrax promotes the contact of the matrix with the solvent (Serrano et al., Citation2013a).
It should be noted that Ultra-Turrax procedure avoids purification of the extract in order to reduce analysis time, but this is possible if a clear extract, suitable for LC-MS/MS analysis, is achieved. When purification is needed, QuEChERS procedure can be used successfully, even if this method presents some limitations concerning recovery and ME. Relating to shaker method, values closer to those obtained using Ultra-Turrax were observed, so that rotatory shaker can be an alternative, especially when a high number of samples must be extracted, because it is the fastest of the three procedures.
Validation of Ultra-Turrax method
In order to apply Ultra-Turrax method for analysis of wheat-based products, the method was validated as a quantitative confirmatory method (). The performance of the method is reflected in the LQs, ME, and recoveries rates.
Table 2. Analytical performance of Ultra-Turrax method: limit of detection (LD) and quantification (LQ), linearity expressed as correlation coefficient (r2), matrix effect, recovery, intraday (n = 3) and interday (n = 3) precision as relative standard deviation.
Tabla 2. Procedimiento analítico del método por Ultra-Turrax: limite de detección (LD) y cuantificación (LQ), linealidad expresada como coeficiente de correlación (r2), efecto matriz, recuperación, precisión intradía (n = 3) e interdía (n = 3) como desviación relativa estandar.
The linear regression coefficients of all calibration curves demonstrated a good linearity, with the corresponding correlation coefficients (r2) higher than 0.990.
Ion suppression (ME < 100%) was observed only for ENB in flour, pasta, and breakfast cereals and for BEA in biscuits, while ion enhancement (ME > 100%) was present in all the other cases. Furthermore, for the effective quantification in commercial samples, matrix-matched calibration curves were used.
The LDs and LQs of the mycotoxins analyzed were between 0.5 and 12 μg kg−1, admitting the same value for each of them in the four matrices.
The accuracy was evaluated for each compound by calculating the recoveries as described in the ‘Method Validation’ section. The range of recovery values for the three levels of concentration tested in the four matrices was between 61% (ENB) and 127% (BEA).
Regarding precision values evaluated from the RSDs of intraday precision and interday precision, these were lower than 14% and 21%, respectively.
This method is sensitive, is of low price, and is reproducible, and it presents the advantages of being simple, with no further cleanup, and also environmental friendly due to small amounts of reagents used.
Commercial samples analysis
Once validated, the method proposed was applied to evaluate the presence of ENs and BEA in 16 samples of wheat-based products. This is the first time when wheat-based samples for direct human consumption such as pasta, breakfast cereals, or biscuits commercialized in Romania are analyzed for emerging mycotoxins.
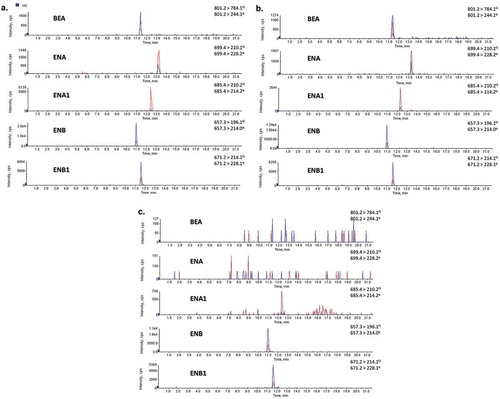
Detectable values of at least one mycotoxin were found in nine samples (56%). None of the samples was contaminated by BEA, ENA, or ENA1, while ENB was detected in seven samples (44%) and ENB1 was present in six samples (38%) (). With regard to mycotoxin co-occurrence in our study, it was found for four samples analyzed: one flour sample and three biscuit samples being contaminated with ENB and ENB1 simultaneously. Concerning the values obtained, ENB ranged from 1.4 to 16.4 μg kg−1, and ENB1 levels were between 2 and 3.7 μg kg−1. shows the chromatograms for standard mix, matched blank flour, and a wheat flour sample contaminated simultaneously with ENB and ENB1.
Table 3. Occurrence, mean, and range of mycotoxins detected in Romanian wheat products samples.
Tabla 3. Incidencia, medias y rangos de las micotoxinas detectadas en las muestras de productos elaborados con trigo procedentes de Rumania.
Figure 3. SRM chromatograms for quantitative (Q) and qualitative (q) ions of: (A) standard mix at concentrations of 12.5 μg mL−1 for ENs and 8 μg mL−1 for BEA; (B) flour blank matched at concentrations of 12.5 μg kg−1 for ENs and 8 μg kg−1 for BEA; (C) positive wheat flour sample contaminated with 9.8 μg kg−1 of ENB and 2.3 μg kg−1 of EB1.
Figura 3. Cromatogramas SRM de los iones de transición cuantitativos (Q) y cualitativos (q) para: A. Solución estándar de una mezcla de ENs a la concentración 12,5 μg mL−1 y 8 μg mL−1 de BEA; B. solución matriz de harina de trigo con una concentración de ENs de 12,5 μg kg−1 y 8 μg kg−1 de BEA; C. muestra positiva de harina de trigo que contenía 9,8 μg kg−1 de ENB y 2,3 μg kg−1 de EB1.
According to other authors, generally, BEA and ENs type A were detected in a lower number of samples in comparison with the ENs type B (Mahnine et al., Citation2011), which was also demonstrated in our study. The absence of BEA in pasta and biscuits was remarked in previous studies from other laboratories (Capriotti et al., Citation2014; Juan et al., Citation2013a). Similar frequencies for ENs have been presented by Juan et al. (Citation2013a) for Italian pasta (4% for ENA, ENA1, and ENB1 and 44% for ENB) and Stanciu, Juan, Miere, Loghin, and Mañes (Citation2017) for Romanian flour (9%, 11%, and 17% for ENA, ENA1, and ENB1, respectively, and 80% for ENB). On the other hand, a Spanish study for whole-grain, white dry, dry, and fresh pasta presented high occurrence, with percentages between 65% and 100% for all ENs (Serrano et al., Citation2013b). Regarding wheat-based breakfast cereals, Mahnine et al. (Citation2011) reported that only one sample from seven analyzed was contaminated with ENA1 and ENB1, being negative for the other emerging mycotoxins.
Concerning the contamination levels, the values from the present study were similar to the values noted by Serrano et al. (Citation2013a), which reported a maximum level of 13 μg kg−1 for ENs in pasta. On the contrary, higher concentrations for ENs were reported by other authors in pasta (max. 106 μg kg−1), baby food (max. 1100 μg kg−1) (Juan et al., Citation2013a), wheat couscous (max. 652 μg kg−1) (Zinedine, Fernández-Franzón, Mañes, & Manyes, Citation2017), and wheat-based breakfast cereals (max. 795 μg kg−1) (Mahnine et al., Citation2011).
Conclusions
After a comparative study of three different extraction methods, the SLE using Ultra-Turrax procedure coupled to LC-MS/MS method provided optimum recoveries and satisfactory values of ME for simultaneous extraction of ENs and BEA in flour, pasta, breakfast cereals, and biscuits. The main advantages of the proposed technique were the accessibility and rapidity. Moreover, good recoveries, low influence of the matrix, and good precision were observed, indicating the suitability of the method. The method was successfully applied to analyze 16 commercial samples from Romania, showing a low contamination of the samples with ENB and ENB1. The method could be used in further research, helping the monitoring process for emerging mycotoxins presence in food, as it was suggested by the EFSA.
Acknowledgement
This work was supported by the Spanish Ministry of Economy and Competitiveness [AGL2013-43194-P and AGL2014-52648-REDT].
Disclosure statement
No potential conflict of interest was reported by the authors.
Additional information
Funding
References
- Blesa, J., Marín, R., Lino, C., & Mañes, J. (2012). Evaluation of enniatins A, A1, B, B1 and beauvericin in Portuguese cereal-based foods. Food Additives & Contaminants: Part A, 29, 1727–1735. doi:10.1080/19440049.2012.702929
- Bryła, M., Waśkiewicz, A., Podolska, G., Szymczyk, K., Jędrzejczak, R., Damaziak, K., & Sułek, A. (2016). Occurrence of 26 mycotoxins in the grain of cereals cultivated in Poland. Toxins, 8, 160. doi:10.3390/toxins8060160
- Capriotti, A.L., Cavaliere, C., Foglia, P., Samperi, R., Stampachiacchiere, S., Ventura, S., & Laganà, A. (2014). Multiclass analysis of mycotoxins in biscuits by high performance liquid chromatography-tandem mass spectrometry. Comparison of different extraction procedures. Journal of Chromatography A, 1343, 69–78. doi:10.1016/j.chroma.2014.04.009
- EC. (2002). Commission decision of 12 August 2002 implementing council directive 96/23/EC concerning the performance of analytical methods and the interpretation of results. Official Journal of the European Communities, L221, 8–36.
- EC. (2006). Commission Regulation (ec) No. 401/2006 of 23 February 2006 laying down the methods of sampling and analysis for the official control of the levels of mycotoxins in foodstuffs. Official Journal of the European Union, L70, 12–34.
- EFSA. (2014). Scientific opinion on the risks to human and animal health related to the presence of beauvericin and enniatins in food and feed. EFSA Journal, 12(3), 3595. doi:10.2903/j.efsa.2014.3595
- Escrivá, L., Font, G., & Manyes, L. (2015). In vivo toxicity studies of Fusarium mycotoxins in the last decade: A review. Food and Chemical Toxicology, 78, 185–206. doi:10.1016/j.fct.2015.02.005
- Garcia-Moraleja, A., Font, G., Mañes, J., & Ferrer, E. (2015). Comparison of different cooking process for the emerging mycotoxins reduction in fresh pasta. Revista De Toxicología, 32, 131–134.
- Jestoi, M. (2008). Emerging Fusarium – mycotoxins fusaproliferin, beauvericin, enniatins, and moniliformin – A review. Critical Reviews in Food Science and Nutrition, 48, 21–49. doi:10.1080/10408390601062021
- Juan, C., Covarelli, L., Beccari, G., Colasante, V., & Mañes, J. (2016). Simultaneous analysis of twenty-six mycotoxins in durum wheat grain from Italy. Food Control, 62, 322–329. doi:10.1016/j.foodcont.2015.10.032
- Juan, C., Mañes, J., Raiola, A., & Ritieni, A. (2013a). Evaluation of beauvericin and enniatins in Italian cereal products and multicereal food by liquid chromatography coupled to triple quadrupole mass spectrometry. Food Chemistry, 140, 755–762. doi:10.1016/j.foodchem.2012.08.021
- Juan, C., Ritieni, A., & Mañes, J. (2012). Determination of trichothecenes and zearalenones in grain cereal, flour and bread by liquid chromatography tandem mass spectrometry. Food Chemistry, 134, 2389–2397. doi:10.1016/j.foodchem.2012.04.051
- Juan, C., Ritieni, A., & Mañes, J. (2013b). Occurrence of Fusarium mycotoxins in Italian cereal and cereal products from organic farming. Food Chemistry, 141, 1747–1755. doi:10.1016/j.foodchem.2013.04.061
- Juan-Garcia, A., Ruiz, M.J., Font, G., & Manyes, L. (2015). Enniatin A1, enniatin B1 and beauvericin on HepG2: Evaluation of toxic effects. Food and Chemical Toxicology, 84, 188–196. doi:10.1016/j.fct.2015.08.030
- Mahnine, N., Meca, G., Elabidi, A., Fekhaoui, M., Saoiabi, A., Font, G., … Zinedine, A. (2011). Further data on the levels of emerging Fusarium mycotoxins enniatins (A, A1, B, B1), beauvericin and fusaproliferin in breakfast and infant cereals from Morocco. Food Control, 124, 481–485.
- Malachova, A., Dzuman, Z., Veprikova, Z., Vaclavikova, M., Zachariasova, M., & Hajslova, J. (2011). Deoxynivalenol, deoxynivalenol-3-glucoside, and enniatins: The major mycotoxins found in cereal-based products on the Czech market. Journal of Agricultural and Food Chemistry, 59, 12990–12997. doi:10.1021/jf203391x
- Oueslati, S., Meca, G., Mliki, A., Ghorbel, A., & Mañes, J. (2011). Determination of Fusarium mycotoxins enniatins, beauvericin and fusaproliferin in cereals and derived products from Tunisia. Food Control, 22, 1373–1377. doi:10.1016/j.foodcont.2011.02.015
- Rodríguez-Carrasco, Y., Berrada, H., Font, G., & Mañes, J. (2012). Multi-mycotoxin analysis in wheat semolina using an acetonitrile-based extraction procedure and gas chromatography-tandem mass spectrometry. Journal of Chromatography A, 1270, 28–40. doi:10.1016/j.chroma.2012.10.061
- Ruiz, M.J., Franzova, P., Juan-Garcia, A., & Font, G. (2011). Toxicological interactions between the mycotoxins beauvericin, deoxynivalenol and T-2 toxin in CHO-K1 cells in vitro. Toxicon, 58, 315–326. doi:10.1016/j.toxicon.2011.07.015
- Serrano, A.B., Font, G., Mañes, J., & Ferrer, E. (2013a). Comparative assessment of three extraction procedures for determination of emerging Fusarium mycotoxins in pasta by LC-MS/MS. Food Control, 32, 105–114. doi:10.1016/j.foodcont.2012.11.037
- Serrano, A.B., Font, G., Mañes, J., & Ferrer, E. (2013b). Emerging Fusarium mycotoxins in organic and conventional pasta collected in Spain. Food and Chemical Toxicology, 51, 259–266. doi:10.1016/j.fct.2012.09.034
- Smith, M., Madec, S., Coton, E., & Hymery, N. (2016). Natural co-occurrence of mycotoxins in foods and feeds and their in vitro combined toxicological effects. Toxins, 8, 94. doi:10.3390/toxins8040094
- Stanciu, O., Banc, R., Cozma, A., Filip, L., Miere, D., Mañes, J., & Loghin, F. (2015). Occurrence of Fusarium mycotoxins in wheat from Europe – A review. Acta Universitatis Cibiniensis Series E: Food Technology, XIX, 35–60.
- Stanciu, O., Juan, C., Miere, D., Loghin, F., & Mañes, J. (2017). Occurrence and co-occurrence of Fusarium mycotoxins in wheat grains and wheat flour from Romania. Food Control, 73, 147–155. doi:10.1016/j.foodcont.2016.07.042
- Taevernier, L., Bracke, N., Veryser, L., Wynendaele, E., Gevaert, B., Peremans, K., & De Spiegeleer, B. (2016). Blood-brain barrier transport kinetics of the cyclic depsipeptide mycotoxins beauvericin and enniatins. Toxicology Letters, 258, 175–184. doi:10.1016/j.toxlet.2016.06.1741
- Zinedine, A., Fernández-Franzón, M., Mañes, J., & Manyes, L. (2017). Multi-mycotoxin contamination of couscous semolina commercialized in Morocco. Food Chemistry, 214, 440–446. doi:10.1016/j.foodchem.2016.07.098