
ABSTRACT
The aim of this work was to study the effect of pulsed electric field (PEF) treatment on the content of bioactive compounds (total phenols, total flavonoids, monomeric anthocyanin content), antioxidant capacity, color intensity (CI), and sensory quality of wines derived from three varieties of grapes (Muscat Ottonel, Pinot Noir, and Merlot). PEF treatment resulted in an increase in all bioactive compounds, and consequently, an increase in their antioxidant capacity, which was evaluated by different methods. Applying PEF treatment to red grapes resulted in obtaining wines with higher CI compared to the control sample. For a better interpretation of the results and a proper discrimination of the samples in terms of the variety of grapes and PEF treatment, multivariate analyses, such as the principal component analysis, multivariate analysis of variance, and hierarchical cluster analysis, were applied.
RESUMEN
El presente estudio se propuso examinar los efectos que tiene el tratamiento de campos eléctricos pulsados (CEP) en el contenido de compuestos bioactivos (fenoles totales, flavonoides totales, contenido de antocianina monomérica), la capacidad antioxidante, la intensidad de color y la calidad sensorial de vinos derivados de tres variedades de uvas (Muscat Ottonel, Pinot Noir y Merlot). El tratamiento de CEP produjo un aumento en todos los compuestos bioactivos y, como consecuencia, un incremento de su capacidad antioxidante, la cual fue evaluada mediante métodos distintos. Después de someter uvas rojas al tratamientos de CEP se produjeron vinos con una intensidad de color más elevada en comparación con la muestra de control. A efectos de lograr una interpretación más profunda de los resultados y una correcta discriminación de las muestras en términos de la variedad de uvas y el tratamiento de CEP, se realizaron análisis multivariantes, entre los que se incluyeron: análisis del componente principal, análisis multivariante de varianza y análisis cluster jerárquico.
1. Introduction
Treating grape mash at different wave forms represents one of the most effective procedures of improving liquid–solid separation. The use of pulsed electric field (PEF) has been studied in specialized literature, leading to the conclusion that it contributes to increased efficiency due to the combination of the pressure effect and electroosmosis (Delsart et al., Citation2014; Donsì, Ferrari, Fruilo, & Pataro, Citation2011; Garde-Cerdán et al., Citation2013; Puértolas, López, Condón, Álvarez, & Raso, Citation2010a). PEF technology as a pretreatment step in winemaking technology has great potential in microbial control in wines. The sensitivity of microorganisms to PEF processing depends on the characteristics of the cells, such as their structure and size (Toepfl, Heinz, & Knorr, Citation2006). The yeasts are less resistant to PEF than bacteria due to their larger cell size. In addition to that, temperature influences the efficiency of the PEF in the microbial inactivation, the synergistic effects of heat, and PEF treatment was recorded (Yang, Huang, Lyu, & Wang, Citation2016).
Although the mechanisms underlying PEF processing are not yet fully explained at molecular level, the results show important changes in the permeability of the cell membrane. This effect may contribute to the inactivation of microorganisms and the mass transfer in the process of extraction and drying. The sample is placed between two conductor drums exposed to PEF.
Electric field strength, temperature, the length of treatment, and the specific energy consumption are the main parameters affecting the degree of microbial inactivation (Alvarez, Condon, & Raso, Citation2006). In order to ensure effective microbial inactivation, electric field strength is recommended to be in the range of 20–50 kV/cm, pulse duration from 1 to 10 μs, and specific energy in the range of 50–1000 kJ/kg (Toepfl, Heinz, & Knorr, Citation2007). However, the multitude of variable parameters produced by applying PEF processing and the characteristics of food products require a systematic study of the individual influence of these parameters on the occurring reactions.
Grape phenols are secondary metabolites that show great chemical diversity, being represented either by simple (with a single aromatic ring) or complex molecules like oligomers and polymers. Phenolic compounds are classified in two groups: flavonoids that contain a basic skeleton C6–C3–C6 and non-flavonoids. Flavonoids include several sub-categories like flavones, flavonols, flavanones, flavanols, and anthocyanins. Anthocyanins are specific to red varieties of grapes, and for most of the red grape cultivars (such as Pinot Noir [PN]), they are accumulated in hypodermal cell layers of the skin. But some special grape cultivars can also accumulate anthocyanins in their pulp (e.g. Garnacha Tintorera) (He et al., Citation2010).
Anthocyanins are aglycone glucosyl derivatives; their diversity derives from the acylation of glucose with acetic acid, p-coumaric acid, and caffeic acid. To the group of non-flavonoids belong phenolic acids (hydroxybenzoic acid, protocatechuic acid, vanillic acid, gallic acid, syringic acid), hydroxycinnamic acids (p-coumaric acid, caffeic acid, ferulic acid, sinapic acid), and stilbens, represented by trans-resveratrol (Lorrain, Ky, Pechamat, & Teissedre, Citation2013). All these compounds have a very important impact on the organoleptic properties of wines, in particular on color and astringency. The presence of bioactive compounds in wine depends on the variety of grapes, as well as on the manufacturing process of wine, which consists in extracting compounds from grapes in must, followed by a series of stages that finally lead to obtaining wine. In addition, these biocompounds have many biological effects, such as cardioprotective, anti-inflammatory, anti-carcinogenic, antiviral, and antibacterial; these effects are based on the capacity of these compounds to present antioxidant and antiradical capacity (Xia, Deng, Guo, & Li, Citation2010).
Due to the numerous biological properties of bioactive compounds in grapes, it is desirable that these are found in very large quantities in the end product, juice or wine, as well as in by-products. Thus, many methods have been proposed, such as ultrasonication, microwaves, PEF, and high-voltage electrical discharge (Azmir et al., Citation2013; Ferraretto & Celotti, Citation2016). The application of PEF to different vegetal matrices is based on the electroporation mechanism that determines the breaking of the cell membranes, thus facilitating the release of intracellular content. Research has demonstrated that PEF improves mass transfer in the case of extraction of various compounds from different vegetal matrices (Eshtiaghi & Knorr, Citation2002; Fincan, De Vito, & Dejmek, Citation2004).
Although initially PEF treatment has been used as a method of liquid food preservation (Kumar, Agarwal, & Raghav, Citation2016; Puértolas, Álvarez, Raso, & Martínez De Marañón, Citation2013), because the application of this treatment inactivates pathogens in food products (milk and milk products, egg products, juices, etc.), lately PEF is applied for increasing the efficiency of extraction of compounds from different vegetal matrices (Eshtiaghi & Knorr, Citation2002; Fincan et al., Citation2004). PEF treatment is an innovative, non-thermal method, which has the advantage of keeping the sensory and nutritional qualities of the food product and of generating a microbiologically safe product.
The aim of this study was to evaluate the content of bioactive compounds (total phenols, total flavonoids [TFlavs], and monomeric anthocyanins), antioxidant capacity, and color intensity (CI) of musts and wines derived from three varieties of grapes (Muscat Ottonel [MO], PN, and Merlot [MT]) that were treated in PEF and then compared to untreated samples. Also, the multivariate analysis (principal component analysis [PCA]), multivariate analysis of variance (MANOVA), and hierarchical cluster analysis (HCA) were used in order to classify the samples.
2. Materials and methods
2.1. PEF equipment and treatments
For experimental measurements, a system of two pairs of two conductor drums that rotate in opposite directions and that train the grape mash (must, skin, and seeds) was used (). Inclined grooves are applied on the surface of the two drums, the angle of inclination being chosen so that the end of a tooth corresponds to the beginning of the next one. The edges of the drums are very sharp, the distance between the two drums is 2 mm, and they have high levels of electric field strength. To avoid degradation of the mash, the strength of the electric current between the tip of a tooth on the first drum and the bottom of the channel of the second drum must not exceed 2 A. Pulses of 150 µs of 7 kV/cm were applied with a frequency of 178 Hz. When piercing the membranes, the current increases a lot and the mash is likely to boil. To avoid this phenomenon on the two drums, we applied pulsed voltages, the power supply allowing the adjustment of the voltage from 0 to 240 Vcc, with the frequency correlated to the speed of the drums, which is very difficult to achieve because the dielectric properties of the mash change a lot. By inserting a rheostat between the source and the drums, we obtained a decreasing voltage–current characteristic. In this way, the discharge takes place in an area at a certain distance along the length of the drums, and only the mash passing through that area is treated.
Figure 1. The system of drums.
Figura 1. El sistema de tambores.
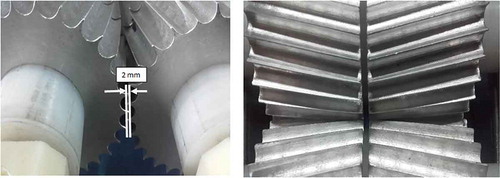
The voltage between the drums causes the piercing of the membrane of the grapes. The tooth tip produces a high concentration of the electric field strength that is favorable to the initiation of the electrical discharge.
2.2. Samples and vinification process
The varieties of grapes (MO, PN, and MT) were harvested in the Crişana-Santimreu vineyard, Romania, in 2015, during their optimal ripening stage (total acidity [g/L] between 5.72 and 6.01, and soluble solids [°Brix] between 18.93 and 20.37). Three separate samples (each of 10 kg) for every variety of grapes were transported to the laboratory; they were declustered and crushed in order to obtain the grape mash. This mash was divided into two parts. One part was treated in PEF and the other remained untreated (i.e. the control sample). Laboratory fermentations were performed in 10 L glass bottles. In this way, there were obtained three control and three PEF samples for each grape variety. The white mash samples (MO) were inoculated with yeasts (Sacharomyces cerevisiae, EC1118) in order to fermentate. In the case of red grapes (PN and MT), the PEF-treated samples were kept at room temperature (22.66 ± 2.08°C) for 4 days and the control mash was kept at room temperature (22.66 ± 2.08°C) for 7 days (maceration time) followed by the pressing process to obtain must and seeding with selected yeasts (S. cerevisiae, EC1118). From red grapes (PN and MT), for both samples, treated and untreated, we obtain red wine. The red color intensity is influenced by the type and time of treatment and maceration. The intensity of color can be observed in the points awarded in the sensorial evaluation.
The residual sugar concentration was monitored daily and fermentation was considered finalized when we obtained a concentration lower than 3 g/L. The contents of phenolic compounds, flavonoids, and monomeric anthocyanins were determined spectrophotometrically, both in the must and the resulting wine. In addition, the color parameters and sensory analysis of wines were investigated. Three samples from each must and wine variety and treatment were individually analyzed in duplicate (N = 6).
2.3. Total phenolic analysis
Total phenolic (TPh) compounds from both grape mashes and its wines were evaluated by the Folin–Ciocalteu method (Singleton, Orthofer, & Lamuela-Raventos, Citation1999) with some modifications. Briefly, the sample (100 μL) was mixed with 1750 μL distilled water, 200 μL Folin–Ciocalteu reagent (dilution 1:10, v/v), and 1000 μL of 15% Na2CO3 solution, and the mixture was incubated at room temperature, in the dark, for 2 h. The absorbance was measured at 765 nm using a spectrophotometer Shimadzu mini UV–VIS. The calibration curve was linear for the range of concentrations between 0.1 and 0.5 mg/mL gallic acid. The TPh content of samples was expressed as mg gallic acid equivalents (GAE)/L.
2.4. Analysis of TFlavs
The TFlav content of the samples was determined using the aluminum chloride colorimetric method (Pękal & Pyrzynska, Citation2014) with some changes. Briefly, 1 mL of the sample (or standard) was mixed with 4 mL water and 3 mL of NaNO2 5% solution (w/v) and after 5 min, 0.3 mL 10% AlCl3 (w/v) was added. A sample was mixed and 6 min later was neutralized with 2 mL of 1 M NaOH solution. The solution was mixed and left for 10 min at room temperature and its absorbance was recorded at 510 nm. Quercetin was used as a standard, and the results were expressed as mg quercetin equivalents (QE)/L.
2.5. Total monomeric anthocyanin pigment content
Total monomeric anthocyanin pigment content (MAP) was determined by the pH-differential method (Giusti & Wrolstad, Citation2001). Two dilutions of each sample were performed, one in phosphate buffer KCl 0.025 M (pH = 1) and another one in acetate buffer 0.4 M (pH = 4.5); the dilutions were performed so that the absorbance of the samples at λmax did not exceed 1.2. The samples were maintained 20 min for balancing, after which their absorbances at λmax and 700 nm were read. The absorbance of the diluted samples was calculated according to the formula: A = (A λmax–A700)pH 1.0 − (A λmax–A700)pH 4.5, and the MAP concentration in must and wine samples was calculated using the formula: MAP (mg/L) = (A × MW × DF × 1000)/(ε × 1), where MW is the molecular weight, DF is the dilution factor, and ε is the molar absorptivity. The results were reported compared to cyanidin-3-glucoside (MW = 449.2 and ε = 26,900).
2.6. Antioxidant capacity of samples
2.6.1. 2,2-Diphenyl-2-picryl-hydrazyl-hydrate assay
The DPPH (2,2-diphenyl-2-picryl-hydrazyl-hydrate) radical-scavenging activity was determined using the method proposed by Brand-Williams, Cuvelier, and Berset (Citation1995) with some modifications. Briefly, an aliquot of 100 µL sample was mixed with 1.4 mL of DPPH solution (80 µM) and 1 mL ethanol. The homogenate was shaken vigorously and the decrease in the absorbance of the resulting solution was monitored at 515 nm for 5 min on a spectrophotometer (Shimadzu 1240 mini UV–VIS). Trolox was used as standard, and the results were expressed as mmol Trolox equivalents (TEs)/L.
2.6.2. Ferric-reducing antioxidant power assay
The FRAP (ferric-reducing antioxidant power) assay was applied according to the method of Benzie and Strain (Citation1996) with some modifications. The FRAP assay consists in the ferric tripyridyltriazine (Fe(III)-TPTZ) complex reduction to the ferrous tripyridyltriazine (Fe(II)-TPTZ) by an antioxidant at low pH. The working FRAP solution was freshly prepared by mixing 300 mM acetate buffer, 20 mM FeCl3·6H2O solution, and 10 mM TPTZ solution (10/1/1, v/v/v). The sample (100 μL) was allowed to react with 500 μL FRAP solution and 2 mL distilled water, for 1 h, in the dark. Absorbance was measured at 595 nm using the spectrophotometer Shimadzu mini UV–VIS. The calibration curve was linear for the range of Trolox concentrations between 50 and 500 μM, and the results were expressed in mmol TE/L.
2.6.3. Trolox equivalent antioxidant capacity method
TEAC (trolox equivalent antioxidant capacity) method is based on the ability of antioxidants to decrease the cation-radical life (ABTS+), a bluegreen chromophore that absorbs at 734 nm, compared to Trolox. The radical-cation ABTS+ is produced by reacting 7 mM ABTS solution with potassium persulfate (2.45 mM) and allowing the mixture to stand at room temperature for 12–16 h before being used. The radical cation ABTS solution obtained was diluted with ethanol to obtain an absorbance of 0.70 ± 0.02 at 734 nm. After adding 100 μL sample (or standard) to 2900 μL ABTS+ diluted solution, the mixture was spectrophotometrically monitored at 734 nm, for exactly 6 min. The calibration curve was performed with Trolox standard, and the results were expressed as mmol TEs/L.
2.7. Chromatic analysis of wines
The chromatic properties of wine samples were determined by UV–VIS absorbance spectrum measurement using a Shimadzu PharmaSpec UV-1700 (Shimadzu Corporation, Kyoto 604-8511, Japan) with a 10-mm path-length quartz cuvette. The CI index was calculated by summing the absorbance at 420, 520, and 620 nm. Yellow color (%Yellow), red color (%Red), and blue color (%Blue) percentages were determined as ratio between 420, 520, and 620 nm, respectively, and CI (Puértolas, Hernández-Orte, Sladaña, Álvarez, & Raso, Citation2010c). The CIE L*a*b* and CIE L*C*h* parameters (L*, a*, b*, C*, and h*) were calculated from wine VIS spectra, first calculating the RGB and XYZ chromatic coordinates (CIE, Commission Internationale de l'Eclairage). Color difference, ΔE, from CIE L*a*b* color coordinates, was calculated between the PEF wine sample and the control one for each wine variety.
2.8. Sensory evaluations of wines
The fresh wines obtained underwent a sensory evaluation with a panel made up of 15 judges consisting of students and members from the Food Engineering Department, University of Oradea. Members of judges panel include students who graduate the “Sensory analysis of food products” course at the University of Oradea, from the Food Engineering Department. These judges were tested in case of sensory threshold. President of Judy was Senior Vice President of Authorized Testers of Association from Romania. The evaluation was done by two methods. First, the scoring method, according to the system of the International Union of Oenologists (http://www.oiv.int/), with the following score, ranges: under 50 points – wine with faults, between 51 and 60 points – wine with flaws, between 61 and 70 points – acceptable wine, between 71 and 80 points – good wine, between 81 and 90 points – very good wine, between 91 and 100 points – excellent wine. The second one was the descriptive method where each characteristic was described. Both methods took into account the visual, olfactory, taste evaluation, and the harmony of the overall characteristics.
2.9. Statistical data
All data were subjected to statistical analysis using Minitab 16 statistical software (Minitab Inc. Pennsylvania, USA). The bioactive compounds, antioxidant capacities, and separately the chromatic parameters were processed by one-way analysis of variance (ANOVA) (P = 0.05). Mean value differences were analyzed with Tukey’s test (P = 0.05).
Classification of data was done with a multivariate sequence consisting of PCA, MANOVA (P = 0.05), and HCA. The multivariate analysis was performed with PAST version 3.12 (PAleolontological Statistical software, Hammer & Harper, Citation2005).
3. Results and discussion
3.1. The effect of PEF on the content of bioactive compounds in the grape must and wine samples
Three varieties of grapes (MO, PN, and MT) were PEF treated in the pre-maceration stage. The content of bioactive compounds, such as total phenols, TFlavs, and monomeric anthocyanins, was measured in the PEF-treated and untreated grape must and wines. The results are shown in .
Table 1. The content of bioactive compounds [total phenols, TPh (mg GAE/L), total flavonoids, TFlav (mg QE/L), and monomeric anthocyanins, MAP (mg/L)] of the PEF-treated and untreated samples.
Tabla 1. Contenido de compuestos bioactivos (fenoles totales, TPh (mg GAE/L), flavonoides totales, TFlav (mg QE/L) y antocianina monomérica, MAP (mg/L)) de las muestras tratadas y no tratadas con CEP.
Of the three varieties of grapes studied, the largest amount of total phenols and TFlavs was identified in the must of the MT grapes, followed by PN and MO (). In red grapes, the largest anthocyanins content was recorded in the must of MT compared to PN (92.56 ± 1.469, 25.94 ± 0.665 mg/L, respectively). The application of PEF to crushed grapes resulted in significant increases in the content of bioactive compounds. This treatment consists in applying an external electric field that results in the electroporation of the cell membranes of the grapes, and thus the diffusion of intracellular components in cellular juice. The highest amount of bioactive compounds is found in grape skins, which represent a barrier for the release of phenols in the maceration stage of the winemaking process. The mechanism of PEF treatment consists in inducing a potential difference across the cell membranes. The permeability of the membranes increases when this potential difference reaches a critical value (Puértolas, Saldaña, Condón, Álvarez, & Raso, Citation2010b).
From the wine samples, the content of bioactive compounds and the antioxidant capacity were determined ( and ). In all cases, the TPh content, the TFlav content, and the total anthocyanins content (in the case of red wines) were higher than in the case of the untreated wines. For example, in the case of PEF-treated MO grapes, the TPh content in the wine was 1.4 times higher than in the untreated wine. In the case of red wine from PN grapes and red wine from MT grapes, the TPh content was 2.98 times and 1.72 times, respectively, higher than in the untreated wine. The TFlav content follows a similar profile to the TPh content. The highest content is recorded in PN wine, followed by MT and MO in which the grapes were PEF treated before the fermentation process. In the case of total anthocyanin content, an increase of 11.11% in the case of PN and only 5.22% in the case of MT were noticed. Recent research has shown that anthocyanins can be absorbed on the cell walls of Saccharomyces yeasts, which would lead to a decrease in their content (Morata, Gómez-Cordovés, Colomo, & Suárez, Citation2003). In contrast, Ivanova, Vojnoski, and Stefova (Citation2012) did not obtain significant changes in terms of TPh, TFlav, after macerating Vranec wines with the same amount of SO2 but fermented with different strains of yeast, probably because they used species of Saccharomyces cerevisiae. Other research has shown that the maximum content of total anthocyanic pigments is reached in the first day of fermentation, and then it decreases due to oxidation reactions, condensation of anthocyanins with other phenols, and precipitation (López, Puértolas, Condón, Álvarez, & Raso, Citation2008; Puértolas et al., Citation2010b).
Table 2. The antioxidant capacity of PEF-treated and untreated must and wine samples.
Tabla 2. Capacidad antioxidante de las muestras de mosto y vino, tratadas y no tratadas con CEP.
Comparative studies on anthocyanins, flavan-3-ols, flavonols, and phenolic acids in PEF-treated and untreated wines, aged 4 months, have shown that the profile of these bioactive compounds was similar, which led to the conclusion that PEF treatment produces no selectivity in terms of the types of phenols (Puértolas et al., Citation2010b). Another study on the quantification of anthocyanins, phenolic acids, flavanols, and flavonols from three varieties of red grapes from Spain has shown that PEF treatment led to a large intensification in their extraction, especially in the Tempranillo variety. The effect of PEF treatments depends on the initial concentration of the compounds in the grapes so that at low initial concentration, extraction efficiency is higher (López-Giral et al., Citation2015).
Addition of macerating enzymes in the wineries in order to improve wine color and phenolic content is other oenological technique. Puértolas, Saldaña, Condón, Álvarez, and Raso (Citation2009) compared the effect of macerating enzymes and PEF treatments on phenolic compounds and color of Cabernet Sauvignon red wine. Their results showed that both treatments lead the highest extraction of phenolic compounds in wine, but the PEF treatment was more effective compared with the enzymatic treatment.
3.2. The evaluation of antioxidant capacity of PEF-treated and untreated must and wine samples
The antioxidant capacity of PEF-treated and untreated must and wine samples was evaluated by three methods (DPPH, FRAP, and TEAC) and the results are shown in . The significant increases in antioxidant capacity of PEF-treated samples compared with untreated samples were recorded, being correlated with the high content in bioactive compounds.
Antioxidant capacity depended on the variety of grapes and also on the content of bioactive compounds. The highest content of bioactive compounds, such as total phenols and TFlavs, was found in wine derived from PN grapes treated by PEF (1983.39 ± 4.559 mg GAE/L, and 6815.89 ± 1038.787 mg QE/L, respectively) that also has the highest antioxidant capacity determined by the three methods (DPPH, FRAP, and TEAC) (13.70 ± 0.358, 10.31 ± 0.038, and 13.26 ± 0.502 mmol TE/L, respectively).
A very good correlation was obtained when comparing the TPh content, the TFlav content, and the total monomeric anthocyanin content with the antioxidant capacity determined by the three methods. These results are presented in . The best correlation was obtained between the TFlav content and antioxidant capacity determined by DPPH method (0.983), while the correlation between the total monomeric anthocyanin content and antioxidant capacity determined by the three methods (DPPH, FRAP, and TEAC) was the weakest. In red wines, both 3-O-monoglucosides and 3,5-O-diglucoside of anthocyanins and their corresponding acylated form can be present (He et al., Citation2012). Anthocyanidins are potent antioxidants, but their antioxidant action depends on the pattern of glycosylation and on the assay used. Using DPPH assay, the 3,5-diglucosides of cyanidin and malvidin recorded lower activities than the corresponding monoglucosides (Kähkönen & Heinonen, Citation2003). Also, Wang, Cao, and Prior (Citation1997) showed that the glycosylation of anthocyanidins influenced the antioxidant activity measured by oxygen radical absorbance capacity assay.
Table 3. Pearson correlation matrix between the analyzed parameters of three different wines.
Tabla 3. Matriz de correlación de Pearson entre los parámetros analizados en los tres vinos diferentes.
López-Giral et al. (Citation2015) have also obtained a good correlation between the total phenols index and antioxidant capacity. Non-antioxidant compounds in wine (amino acids, uronic acids) may cause interferences and influence the estimated values of antioxidant capacity. Donsì et al. (Citation2011) have evaluated the effect of PEF treatment applied to four varieties of grapes in Italy in respect to antioxidant activity (by DPPH method) and have obtained a wine with a high antioxidant capacity (+40%).
3.3. The change in chromatic parameters of wine after PEF treatment
From the VIS spectra of wine samples (MO, PN, and MT), the CI, CIE L*a*b*, CIE L*C*h* parameters, and ΔE of the PEF-treated wines and control wines were evaluated and the results are shown in .
Table 4. The chromatic properties of the PEF-treated and untreated wine samples.
Tabla 4. Propiedades cromáticas de las muestras de vino tratadas y no tratadas con CEP.
In the case of PEF-treated red wines (PN and MT), we observe that they have a high CI compared to the control wine samples. These differences are statistically significant (). In the case of PN wine, an increase in CI of 6.89 times was higher than in the control wine, while the content of anthocyanin, pigments responsible for the color of the wine, increased only 1.11 times compared to the control sample. In the case of MT, we notice the same tendency, CI increased 2.19 times, while the content of anthocyanins only 1.05 times. This proves that not only monomeric anthocyanins are responsible for the color of the wine but also other compounds that can result during the process of wine formation. Puértolas et al. (Citation2010c) considered that a high CI in the case of PEF-treated wines is due to the increase in oligomeric and polymeric pigments, because, besides anthoacyanins, after PEF treatment, the extraction of other phenolic compounds takes place. In terms of characterization of PEF-treated and untreated wines according to CIE L*a*b* parameters, we notice that PEF-treated wines present a decrease in the value of L* compared to the control sample, suggesting that the color of the treated wine is darker than that of the control wine. The values of C*, which represents the contribution of a* and b* to the color of the wine, showed significant differences between the two wines, suggesting that in PN wine, the quantity of color compounds is higher than in the case of PEF-treated MT wine. These results are emphasized by the color difference values, ΔE, calculated for each wine variety, between the control and PEF samples. For both red wines, the color differences are significant (i.e. greater the 5 units). However, the PEF treatment has 2.48 times higher impact on wine color for PN sample than the MT sample. In the case of the white wine sample, MO, this is the one that presents the highest luminance (L*), but the lowest blue chromaticity (b*).
Our results are similar to Puértolas et al. (Citation2010c) who showed that L*, b*, and h* were lower in the control (untreated) samples compared to the PEF-treated one. This indicates that treated wine is darker than the untreated one. The variations of the color parameter differences are more pronounced than the differences obtained when determining MAP. Similar results were obtained by López-Alfaro and Garde-Cerdán (Citation2015) in the case of Graciano wine from 2012, where CI increased by 103%, while the content of anthocyanins increased by 84%. Puértolas et al. (Citation2010c), Gutiérrez, Lorenzo, and Espinosa (Citation2005) consider that monomeric anthocyanins are not the only compounds that contribute to CI, and there are other compounds that result from the reactions between monomeric anthocyanins and other phenolic compounds.
3.4. Multivariate analysis
In order to classify the PEF-treated and untreated must and wine samples, we used a multivariate sequence. The sequence prescribed the proper number of clusters that can be obtained from the samples using the parameter profiles (i.e. all the parameter values). The multivariate sequence consisted of PCA, MANOVA (P = 0.05), and HCA.
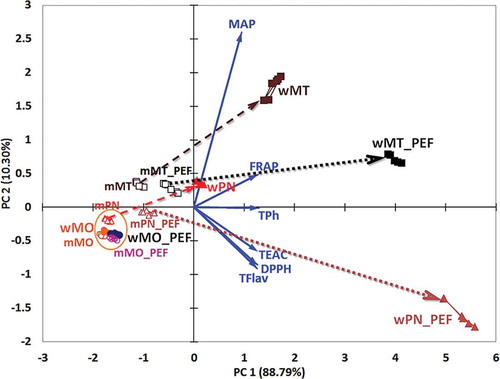
The results of the PCA are shown in as a biplot. The biplot combines both the sample scores and the parameter loadings in a single graphical representation. In this case, the first principal component PC1 explains 88.79% from the overall variance and the second one, PC2, explains 10.30%, both principal components explain 99.09% of total variance. The parameter vector end points are situated in the first and fourth quadrant, so all the parameters have positive loadings (i.e. coordinates) for the first principal component, PC1. The PCA method involved had as input the correlation matrix of the parameters. As a consequence, the geometrical relative positioning of the samples, parameter vectors, and principal axes can describe the correlation between them. According to the biplot () there are four parameter groups: MAP, FRAP, TPh, and the last one TEAC, DPPH, and TFlav. The parameter vectors of the fourth group are much closed together as these parameters are strongly correlated and display negative loadings for the PC2 axis.
Figure 2. Principal component analysis (PCA) biplot representation of bioactive compounds and antioxidant capacities for PEF-treated and untreated varieties of must and wine samples. Dotted and dashed arrows point out the pairing between the must and wine samples.
Figura 2. Análisis del componente principal (ACP): representación biespacial de los compuestos bioactivos y las capacidades antioxidantes de muestras de variedades de mosto y vino, tratadas y no tratadas con CEP. Las flechas punteadas y de raya indican las combinaciones entre las muestras de mosto y vino.
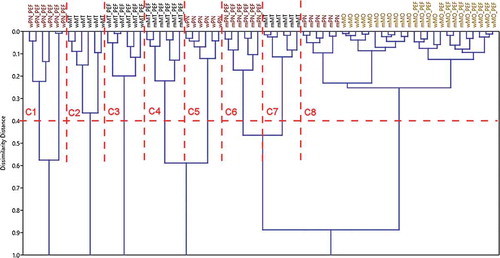
The sample scores, for PC1 and PC2, consisted in inputs for the MANOVA and HCA methods. The MANOVA results are presented in , where the sample pairs were bolded with no significant differences of the parameter profiles as the P-value was above the statistical probability level P = 0.05. These pairs consisted in criteria to extract the proper number of clusters from all the possible ones calculated with HCA method. In this case, there were 12 sample groups (or possible clusters), but only 8 clusters from HCA were validated by MANOVA (see the end row of and ). In this way, the analyzed must and wine samples were classified in clusters with 95% statistical validation. The only cluster that is not a singleton is C8. It gathers samples: mMO, mMO_PEF, mPN, wMO, and wMO_PEF. The samples are must and wine from the MO grape variety and the must of PN grape variety. These samples have no significant difference between abundances of bioactive compounds and antioxidant capacities. As a consequence, the MO variety of must and wine are not affected by PEF treatment. Also, the mPN_PEF, mMT, and mMT_PEF singleton clusters are close to C8 cluster, but these have relative high abundances/levels of MAP, FRAP, and TPh compared to C8.
Table 5. Statistical probabilities (P-values) values as the result of multivariate sample profiles MANOVA (P = 0.05) for all the varieties of PEF-treated and untreated must and wine samples.
Tabla 5. Valores de probabilidades estadísticas (valores p) como resultado de los perfiles de muestra multivariante MANOVA (P = 0,05) para todas las variedades de muestras de mosto y vino, tratadas y no tratadas con CEP.
Figure 3. Dendrogram of hierarchical cluster analysis (HCA). The horizontal dotted line designates the samples clustering threshold determined by MANOVA (P = 0.05). The vertical dotted lines are the cluster limits.
Figura 3. Dendrograma del análisis de cluster jerárquico (acj). La línea punteada horizontal indica el umbral de cluster de las muestras, determinado por el MANOVA (P = 0,05). Las líneas punteadas verticales indican los límites de los clusters.
presents the must samples to wine samples ‘evolution’ vectors. These evolutions are materialized (as trajectories) with arrows starting from must samples to wine samples. The dashed arrows are used between the PEF-treated samples and the dotted ones between the untreated samples. In this way, a qualitative parameter profile changing from must to wine and between the varieties can be assessed. PEF treatment generates significant small differences between must samples of the same variety, but significant huge differences between the wine samples of the same variety. This fact is proven by following the start and end point of each evolution vector of the three PEF-treated and untreated samples (). The MO has no evolution vectors due to the insignificant parameter profile changes. The TPh and TFlav abundance and the levels of TEAC and DPPH increase as an effect of PEF treatment on PN and MT wine samples (wPN_PEF and wMT_PEF). In the PN wine as well as in the MT wine, the MAP level increases during PEF treatment.
3.5. Sensory evaluation
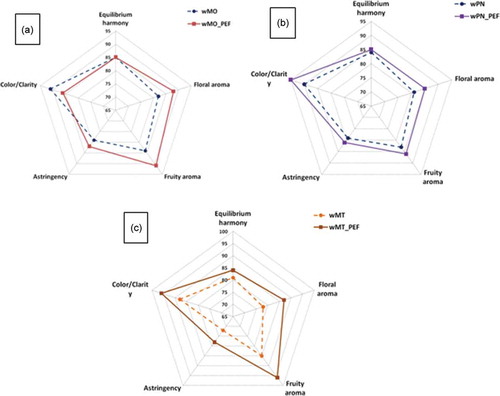
The methods of sensory evaluation of PEF-treated and control (untreated) wine samples took into account the visual attribute (color intensity and clarity), three mouth-feel attributes (astringency, floral, and fruity aroma), and the harmony of the overall characteristics. The value of the final score of the wines represents the average of all parameters studied. Results of this analysis are shown in for each wine. The PEF red wine showed a higher value score for all sensory attributes comparative with control (Figure 4(b,c)). The higher score for color, astringency and taste of PEF red wines could be explained by the higher levels of total phenols compared with control wine. Instead, in the white wine, a higher value score for color was obtained for control comparative with PEF treatment ()), the PEF white wine being slightly opalescent with a darker tint due to the oxidation of phenolic compounds.
Figure 4. Diagrams of the sensory scores of wines from PEF-treated (- - -) and control grape (—). (a) Diagram of Muscat Ottonel wines. (b) Diagram of Pinot Noir wines. (c) Diagram of Merlot wines. Attributes tested: color/clarity, astringency, floral and fruity aroma, and equilibrium harmony.
Figura 4. Diagramas de los puntajes sensoriales de vinos procedentes de uvas tratadas con CEP (- - -) y de uvas de control (—). (a). Diagrama de vinos Muscat Ottonel; (b). Diagrama de vinos Pinot Noir wines; (c). Diagrama de vinos Merlot. Atributos sometidos a prueba: color/claridad, astringencia, aromas florales y frutales, y armonía equilibrada.
4. Conclusions
In this study, we used PEF treatment as an alternative environmentally friendly method of extracting bioactive compounds from three different varieties of grapes in order to obtain wines. The results regarding the content of bioactive compounds (TPh, TFlav, and MAP) and antioxidant capacity have demonstrated that the effect of PEF depends both on the variety of grapes studied, and on the initial concentration in the must. In the case of all three varieties of grapes, we noticed that after applying PEF treatment, significant increases in bioactive compounds take place in the must compared to the control samples. The wines obtained after applying PEF to grapes before alcoholic fermentation resulted in obtaining wines with a high content of bioactive compounds, an increase in antioxidant capacity, and increased CI. In terms of sensory analysis, the wine samples from PEF-treated grapes have obtained a higher score than the control samples. These results confirm that the use of PEF treatment on grapes before alcoholic fermentation is a suitable method to obtain white and red wines with a high content of bioactive compounds.
Acknowledgements
This work was performed through the Partnerships Program in priority areas – PN II, developed with the support of MEN-UEFISCDI, project PN-II-PT-PCCA-2013-4-2225, No. 170/2014 “Electromagnetic methods to improve processes wine.”
Disclosure statement
No potential conflict of interest was reported by the authors.
Additional information
Funding
References
- Alvarez, I., Condon, S., & Raso, J. (2006). Microbial inactivation by pulsed electric fields. In J. Raso & V. Heinz (Eds.), Pulsed electric fields technology for the food industry (pp. 97–129). Springer US. doi: 10.1007/978-0-387-31122-7_4
- Azmir, J., Zaidul, I.S.M., Rahman, M.M., Sharif, K.M., Mohamed, A., Sahena, F., … Omar, A.K.M. (2013). Techniques for extraction of bioactive compounds from plant materials: A review. Journal of Food Engineering, 117, 426–436. doi:10.1016/j.jfoodeng.2013.01.014
- Benzie, I.F., & Strain, J.J. (1996). The ferric reducing ability of plasma (FRAP) as a measure of “antioxidant power”, the FRAP assay. Analytical Biochemistry, 239, 70–76. doi:10.1006/abio.1996.0292
- Brand-Williams, W., Cuvelier, M., & Berset, C. (1995). Use of a free radical method to evaluate antioxidant activity. LWT - Food Science and Technology, 28(11), 25–30. doi:10.1016/S0023-6438(95)80008-5
- Delsart, C., Cholet, C., Ghidossi, R., Grimi, N., Gontier, E., Gény, L., … Mietton-Peuchot, M. (2014). Effects of pulsed electric fields on Cabernet Sauvignon grape berries and on the characteristics of wines. Food and Bioprocess Technology, 7, 426–436. doi:10.1007/s11947-012-1039-7
- Donsì, F., Ferrari, G., Fruilo, M., & Pataro, G. (2011). Pulsed electric fields-assisted vinification. Procedia Food Science, 11th International Congress on Engineering and Food, 1, 780–785. doi:10.1016/j.profoo.2011.09.118
- Eshtiaghi, M.N., & Knorr, D. (2002). High electric field pulse pretreatment: Potential for sugar beet processing. Journal of Food Engineering, 52, 265−272. doi:10.1016/S0260-8774(01)00114-5
- Ferraretto, P., & Celotti, E. (2016). Preliminary study of the effects of ultrasound on red wine polyphenols. Cyta – Journal of Food, 14, 529–535.
- Fincan, M., De Vito, F., & Dejmek, P. (2004). Pulsed electric field treatment for solid–liquid extraction of red beetroot pigment. Journal of Food Engineering, 64, 381−388. doi:10.1016/j.jfoodeng.2003.11.006
- Garde-Cerdán, T., González-Arenzana, L., López, N., López, R., Santamaría, P., & López-Alfaro, I. (2013). Effect of different pulsed electric field treatments on the volatile composition of Graciano, Tempranillo and Grenache grape varieties. Innovative Food Science and Emerging Technologies, 20, 91–99. doi:10.1016/j.ifset.2013.08.008
- Giusti, M., & Wrolstad, R.E. (2001). Characterization and measurement of anthocyanins by UV-Visible Spectroscopy. Current Protocols in Food Analytical Chemistry, F:F1:F1.2. doi:10.1002/0471142913
- Gutiérrez, I.H., Lorenzo, E.S.-P., & Espinosa, A.V. (2005). Phenolic composition and magnitude of copigmentation in young and shortly aged red wines made from the cultivars Cabernet Sauvignon, cencibel and syrah. Food Chemistry, 92, 269–283. doi:10.1016/j.foodchem.2004.07.023
- Hammer, Ø., & Harper, D.A.T. (2005). Paleontological data analysis. Malden, MA, USA: Wiley-Blackwell Publishing. 368. ISBN: 978-1-4051-7294-3.
- He, F., Liang, -N.-N., Mu, L., Pan, Q.-H., Wang, J., Reeves, M.J., & Duan, C.-Q. (2012). Anthocyanins and their variation in red wines I. Monomeric anthocyanins and their color expression. Molecules, 17, 1571–1601. doi:10.3390/molecules17021571
- He, F., Mu, L., Yan, G.-L., Liang, -N.-N., Pan, Q.-H., Wang, J., … Duan, C.-Q. (2010). Biosynthesis of anthocyanins and their regulation in colored grapes. Molecules, 15, 9057–9091. doi:10.3390/molecules15129057
- Ivanova, V., Vojnoski, B., & Stefova, M. (2012). Effect of winemaking treatment and wine aging on phenolic content in Vranec wines. Journal of Food Science and Technology, 49, 161–172. doi:10.1007/s13197-011-0279-2
- Kähkönen, M.P., & Heinonen, M. (2003). Antioxidant activity of anthocyanins and their aglycons. Journal of Agricultural and Food Chemistry, 51, 628–633. doi:10.1021/jf025551i
- Kumar, S., Agarwal, N., & Raghav, P.K. (2016). Pulsed electric field processing of foods - a review. International Journal of Engineering Research and Modern Education, 1, 111–118.
- López, N., Puértolas, E., Condón, S., Álvarez, I., & Raso, J. (2008). Effects of pulsed electric fields on the extraction of phenolic compounds during the fermentation of must of Tempranillo grapes. Innovative Food Science and Emerging Technologies, 9, 477–482. doi:10.1016/j.ifset.2007.11.001
- López-Alfaro, I., & Garde-Cerdán, T. (2015). Pulsed electric field treatment to improve the phenolic compound extraction from graciano, tempranillo and grenache grape varieties during two vintages. Innovative Food Science and Emerging Technologies, 28, 31–39. doi:10.1016/j.ifset.2015.01.003
- López-Giral, N., González-Arenzana, L., González-Ferrero, C., López, R., Santamaría, P., López-Alfaro, I., & Garde-Cerdán, T. (2015). Pulsed electric field treatment to improve the phenolic compound extraction from graciano, tempranillo and grenache grape varieties during two vintages. Innovative Food Science and Emerging Technologies, 28, 31–39. doi:10.1016/j.ifset.2015.01.003
- Lorrain, B., Ky, I., Pechamat, L., & Teissedre, P.-L. (2013). Evolution of analysis of polyphenols from grapes, wines, and extracts. Molecules, 18, 1076–1100. doi:10.3390/molecules18011076
- Morata, A., Gómez-Cordovés, M.C., Colomo, B., & Suárez, J.A. (2003). Pyruvic acid and acetaldehyde production by different strains of saccharomyces cerevisiae: relationship with vitisin a and b formation in red wines. Journal of Agricultural and Food Chemistry, 51, 7402–7409. doi:10.1021/jf0304167
- Pękal, A., & Pyrzynska, K. (2014). Evaluation of aluminium complexation reaction for flavonoid content assay. Food Analytical Methods, 7, 1776–1782. doi:10.1007/s12161-014-9814-x
- Puértolas, E., Álvarez, I., Raso, J., & Martínez de Marañón, I. (2013). Industrial application of pulsed electric field for food pasteurization: Review of its technical and commercial viability. Cyta – Journal of Food, 11, 81–88. doi:10.1080/19476337.2012.693542
- Puértolas, E., Hernández-Orte, P., Sladaña, G., Álvarez, I., & Raso, J. (2010c). Improvement of winemaking process using pulsed electric fields at pilot-plant scale. Evolution of chromatic parameters and phenolic content of Cabernet Sauvignon red wines. Food Research International, 43, 761–766. doi:10.1016/j.foodres.2009.11.005
- Puértolas, E., López, N., Condón, S., Álvarez, I., & Raso, J. (2010a). Potential applications of pulsed electric fields on Cabernet Sauvignon grape berries and on the characteristics of wines. Food and Bioprocess Technology, 7, 426–436.
- Puértolas, E., Saldaña, G., Condón, S., Álvarez, I., & Raso, J. (2009). A comparison of the effect of macerating enzymes and pulsed electric fields technology on phenolic content and color of red wine. Journal of Food Science, 74, C647–C652. doi:10.1111/j.1750-3841.2009.01343.x
- Puértolas, E., Saldaña, G., Condón, S., Álvarez, I., & Raso, J. (2010b). Evolution of polyphenolic compounds in red wine from cabernet sauvignon grapes processed by pulsed electric fields during aging in bottle. Food Chemistry, 119, 1063–1070. doi:10.1016/j.foodchem.2009.08.018
- Singleton, V.L., Orthofer, R., & Lamuela-Raventos, R.M. (1999). Analysis of total phenols and other oxidation substrates and antioxidants by means of folin- ciocalteu reagent. Methods in Enzymology, 299, 152–178.
- Toepfl, S., Heinz, V., & Knorr, D. (2006). Applications of pulsed electric fields technology for the food industry. In J. Raso & V. Heinz (editors), Pulsed electric fields technology for the food industry (pp. 197–222). New York: Springer.
- Toepfl, S., Heinz, V., & Knorr, D. (2007). High intensity pulsed electric fields applied for food preservation. Chemical Engineering and Processing, 46, 537–546. doi:10.1016/j.cep.2006.07.011
- Wang, H., Cao, G., & Prior, R.P. (1997). Oxygen radical absorbing capacity of anthocyanins. Journal of Agricultural and Food Chemistry, 45, 304–309. doi:10.1021/jf960421t
- Xia, E.-Q., Deng, G.-F., Guo, Y.J., & Li, H.B. (2010). Biological activities of polyphenols from grapes. International Journal of Molecular Sciences, 11, 622–646. doi:10.3390/ijms11020622
- Yang, N., Huang, K., Lyu, C., & Wang, J. (2016). Pulsed electric field technology in the manufacturing processes of wine, beer, and rice wine: A review. Food Control, 61, 28–38. doi:10.1016/j.foodcont.2015.09.022