
ABSTRACT
The physicochemical characteristics of Euphorbia resinifera honey were studied. Considering the low water content, the majority of the honeys presented a proper maturity. The values of acidity revealed the absence of inappropriate fermentation, while the low values of hydroxymethylfurfural (0.4–16.48 mg/kg) were suitable for of unprocessed honeys. The average values for electrical conductivity and ashes were 451 µS/cm and 1.6 g/kg, respectively. As for the mineral content, the K was the most abundant element; Ca, Na, Mg, P, S, and Si are all present in differing quantities in the honeys. On the other hand, Principal Components Analysis (PCA) and Stepwise Discriminant Analysis (SDA) were applied to distinguish between three related Euphorbia honey types. PCA showed that the cumulative variance of the two first factors explained approximately 53%. The results of SDA showed that variables with a higher discriminant power were K, C*ab and a*, and 100% of the samples were properly classified in their corresponding class.
RESUMEN
Los parámetros fisicoquímicos de 29 de mieles monoflorales de Euphorbia resinifera fueron estudiadas. 24 parámetros, incluyendo humedad, pH, acidez (libre, lactónica y total), HMF, cenizas, conductividad eléctrica, monosacáridos (glucosa y fructosa), contenido mineral y parámetros cromáticos fueron analizados. Desde el punto de vista de su calidad las mieles fueron acordes con la legislación Europea en cuanto a contenido en agua, acidez y HMF. Los valores de cenizas y conductividad eléctrica fueron 1,6 g/kg y 451 μS/cm, respectivamente. El contenido en minerales mostró que el K es el elemento más abundante; mientras que Ca, Na, Mg, P, S y Si se presentaron en contenidos intermedios. En cuanto a los valores de los parámetros del color fueron típicos de mieles ámbar claras. Se ha realizado un análisis estadístico multivariante a los datos obtenidos para diferenciar tres especies de mieles de Euphorbia. El análisis discriminante permite diferencia las mieles por su origen botánico siendo el contenido en K, C*ab y la variable cromática a* las variables con mayor poder discriminate, siendo el 100% de las muestras clasificadas correctamente en su grupo.
Introduction
Wildflower and monofloral honeys differ in their chemical and physical properties due to various factors, such as plant source, season, packaging conditions, geographical origin, and storage period. Today’s international market demands the setup of quality control in accordance with the palynological and physicochemical guidelines. This trend becomes explicit in the European legislation (EU Council, Citation2002): honey is therein defined as monofloral when its pollen, physicochemical, and sensory characteristics originate from one completely or partially botanical origin. Consumers and the honey industry increasingly demand information for the characterization of honey; therefore, the emergent market for unifloral honey in many countries requires its characterization and differentiation from other honey varieties.
Numerous honey varieties, such as eucalyptus, honeydew, lavender, orange blossom, sunflower, thyme, and ziziphus, have been the subject of many characterization studies in north-western country of Africa (Morocco) (Chakir, Romane, Marcazzan, & Ferrazzi, Citation2016; Díez, Andrés, & Terrab, Citation2004; Terrab, Díez, & Heredia, Citation2003a; Terrab, González, Díez, & Heredia, Citation2003b). On the other hand, Morocco is one of the countries of the Mediterranean area with a large production of Euphorbia honeys. Three honey types of this genus are produced in this country: E. officinarum subsp. echinus, E. regis-jubae, and E. resinifera, whereby the first two types have been previously characterized (Bettar et al., Citation2015; Terrab, Marconi, Bettar, Msanda, & Díez, Citation2014).
E. resinifera is an endemic species of Morocco with a principal area of distribution situated in the centre of the country, in Azilal and Beni Mellal regions (Middle Atlas), with some scattered populations in the High Atlas and Anti-Atlas Mountains.
E. resinifera honey is judged to feature among the most distinguishable and valuable honeys from a consumers’ point of view in the northern African country. Owing to the high quantities of E. resinifera honey produced in Morocco, to the high acceptance of this class of honey, and because of the scientific and commercial importance of the characterization of unifloral honeys, the physicochemical classification of this unifloral honey is crucial for its distinction from other Moroccan Euphorbia honeys.
The present study aims to characterize E. resinifera honey, and also to give parameters that may facilitate to differentiate this unifloral honey from E. officinarum subsp. echinus and E. regis-jubae honey types. The present survey includes common physicochemical attributes (moisture, pH, acidity, hydroxymethylfurfural (HMF), electrical conductivity (EC), and ashes), two sugars (fructose and glucose), 14 minerals, and the CIELAB color attributes.
Materials and methods
Honey samples
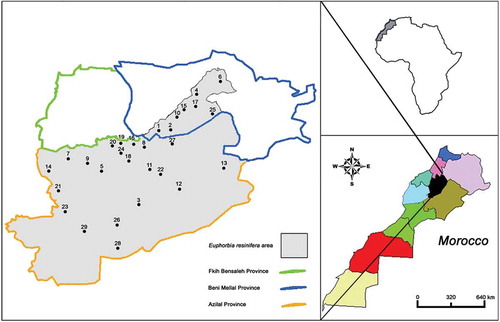
A total of 29 unifloral samples of E. resinifera honey were obtained and studied between 2013 and 2014 from the Azilal and Béni Mellal Provinces (). The samples were collected and immediately stored at 4–5°C.
Figure 1. Map of Euphorbia resinifera area showing the location of the apiaries investigated.
Figura 1. Mapa de distribución de las muestras de miel analizadas, así como el área de distribución de Euphorbia resinifera.
Common physicochemical parameters
Physicochemical parameters such water content, pH, free, lactonic and total acidity, HMF, EC, and ash were determined following the Official Methods of Analysis (Association of Official Analytical Chemists International [AOAC], Citation2005).
The moisture has been determined at 20°C with an Erma refractometer reading. The pH was measured with a pH-meter (Orion 420 A) from a solution containing 10 g of honey in 75 mL of CO2-free distilled water. And the acidity has been estimated using the titrimetric method. HMF has been analyzed by the measure of the absorbance at 284 and 336 nm. The EC has been measured in a honey solution at 20% (dry matter basis) in CO2-free deionized distilled water and measured at 20°C in a Crison Basic 30 conductometer. Ash content was determined by calcination of 5 g of honey samples. The samples were placed in combustion pots, which required preheating to darkness with a gas flame to prevent the honey from foaming. The samples were then incinerated at high temperature (550°C) in a burning muffle overnight. After cooling at room temperature, the obtained ash was weighed.
Regarding monosaccharides determination, the concentration of fructose and glucose was analyzed by high-performance liquid chromatography (HPLC) following the method of Victorita et al. (Citation2008). A Hewlett–Packard 1050 series (Palo Alto, CA, USA) chromatograph equipped with a refractive index detector was used for the detection of the sugar compounds. Chromatographic analysis was carried out using a Zorbax NH2 (250 × 4.6 mm) under the following conditions: acetonitrile–H2O mobile phase, 75:25 v/v, flow rate 1 mL/min, column Tem. 30°C. Quantitative determinations have been calculated with a standard external calibration method. Approximately 1.2 g of honey was dissolved in 100 mL of deionized H2O, filtered through a 0.45-µm filter, and 20 µL was then introduced into the HPLC column. The identification of the HPLC peaks has been assessed by the comparison of the retention times obtained from the standards. The honey samples have been analyzed in triplicate, and the sugar concentrations were given in terms of grams of sugar per kilogram of honey.
Determination of mineral elements
Mineral elements were determined by an Agilent 7500c series with an inductively coupled plasma-mass spectrometer (ICP-MS) system and an Octopole Reaction System. The analytical parameters for ICP-MS were Nebulizer, Babington; RF generator, 1500; Argon flow rate, 1.11 L min−1; Nebulizer pump, 0.1 rps; reduction gas flow, H2 at 3.5 mL/min and He at 4 mL/min. The quantification of minerals elements was carried out by the internal standard method. The elements’ standards solutions were prepared by diluting stock solution (ICP standard CertiPUR) of 1000 mg/L. The same procedure was applied to prepare a solution of Rh (1 mg/L) which was chosen as the internal standard.
Fourteen mineral elements (aluminum, calcium, copper, iron, lead, lithium, magnesium, manganese, potassium, phosphorus, silicon, sodium, sulfur, and zinc) have been quantified in each sample. Honey samples were prepared from about 0.4 g placed into polytetrafluoroethylene vessels and dissolved with 6 mL 67% HNO3 (PlasmaPURE, SCP, Courtaboeuf, France). The digestion was carried out in a microwave oven (Multiwave 3000, Anton Paar, Austria), with the parameters set for 10 min, 0–800 W at 100°C, 10 min 800 W at 180°C, and 15 min ventilation.
Blank solutions were prepared in the same way. The limits of detection were calculated as three times the standard deviation of the blank value divided by the slope of the calibration curve. The lowest limits of detection corresponded to Pb (0.19 ng/g) and the highest ones to Na (194 ng/g).
Color parameters
Color has been measured through tristimulus colorimetry on the basis of the reflectance spectra using the methods recommended by the Commission Internationale de l’Éclairage (Commission Internationale de l’Éclairage [CIE], Citation2004). The spectra have been measured on the honey against a white background, using a CAS-140B spectroradiometer (Instrument System, Munich, Germany). For more details, see Bettar et al. (Citation2015). The following CIELAB color attributes were assessed: L* (lightness), a*and b*(two color coordinates), hab (hue angle), and C*ab (chroma).
Statistical analysis
Principal Components Analysis (PCA) and Stepwise Discriminant Analysis (SDA) were applied on experiment standardized data in order to select the variables that most influence the differences between E. resinifera honey from E. officinarum subsp. echinus and E. regis-jubae honey types. For the statistical treatment of the data, the Statistica v.8.0 software (StatSoft INC., Citation2007) was used. Statgraphic has been used to represent the biplot.
Results and discussion
Common physicochemical parameters
The results from common physicochemical parameters (moisture, pH, acidity, EC, HMF, and ash) of honey are summarized in .
Table 1. Distribution data for common physicochemical parameters and sugar composition in Euphorbia resinifera honeys.
Tabla 1. Parámetros fisicoquímicos comunes y azucares en mieles monoflorales de Euphorbia resinifera.
Water content, which is affected by the season of production, human manipulation, storage conditions, processing techniques, among others (Gomes, Dias, Moreira, Rodrigues, & Estevinho, Citation2010; White, Citation1975), is significant in terms of shelf life. High values of water content can provoke fermentation by osmophilic yeast, thereby reducing the overall quality of honeys, and also can reveal an immature process of extraction (Féas, Pires, Iglesias, & Estevinho, Citation2010). Our honeys showed measurements of water content below 190 g/kg in 93% of the samples, and no samples surpassed the legal limit (EU Council, Citation2002). Generally, these values correspond to mature samples extracted from modern hives during the summer, which is in concordance with the flowering period of the species (late spring–early summer).
The pH shows major importance during the storage and extraction processes of honeys. In this study, pH values ranged between 3.93 and 4.55, with a mean value of 4.20. Generally, our results remain within the values of White (Citation1975), who stated that honey is typically acidic, with pH values ranging between 3.2 and 4.5. The mean value found in this study for E. resinifera honeys is slightly higher than those found for E. officinarum subsp. echinus honeys (mean = 4.02) and E. regis-jubae honeys (mean = 3.79) (Bettar et al., Citation2015).
The organic acids produced from nectar during the ripening by glucose oxidase, contributes toward the acidity of honey. Other factors that influence total acidity include geographical origin and harvest season (Alves, Ramos, Margarida Gonçalves, Bernardo, & Mendes, Citation2013). In our study, free acidity showed values between 14.07 and 32.29 meq/kg, and all the samples are below the legal acidity limit: no more than 50 meq/kg for the free acidity (EU Council, Citation2002). Regarding the lactonic acidity, this ranged from 14.70 to 53.92 meq/kg (mean = 24.44 meq/kg), being the average value of total acidity 47.46 meq/kg. The results obtained for total acidity are very similar to those found in E. officinarum subsp. and E. regis-jubae honeys; however, the values obtained for free and lactonic acidities are very different to those found in E. officinarum subsp. echinus (mean of free and lactonic acidities = 43.38 and 2.58 meq/kg, respectively) and E. regis-jubae honeys (mean of free and lactonic acidities = 40.38 and 8.88 meq/kg, respectively) (Bettar et al., Citation2015).
HMF is used as an indicator of heat and storage changes in honey. Fresh honey contains no, or only trace amounts of, HMF (Bogdanov, Ruoff, & Oddo, Citation2004). From the consumers’ point of view, low HMF values guarantee that the honey remains practically unaltered (Escriche, Visquert, Carot, Domenech, & Fito, Citation2008). In our study, E. resinifera honeys showed very low values of HMF ranging from 0.4 to 16.8 mg/kg, and all of the honeys remained within the European permitted limit (40 mg/kg). The results collected for HMF are typical of unprocessed honey.
EC varies greatly depending on the botanical origin, and hence this is considered to be one of the important discriminating parameters in the classification of honeys concerning their botanical origin (Krauze & Zalewski, Citation1991). Almost 90% of the samples show values between 346 and 485 µS/cm, where the average value stands at 451 µS/cm. All the EC values measured from our samples were typical of nectar honeys (<800 µS/cm) (EU Council, Citation2002). In our case, the EC could be assumed as a very good parameter to differentiate E. resinifera honeys from other nectar honey varieties (Mateo & Bosch-Reig, Citation1998), and even honeys from the same genus as E. officinarum subsp. echinus and E. regis-jubae honeys, which present mean values of EC above 550 µS/cm (Bettar et al., Citation2015).
The ash content is traditionally used to authenticate the type (nectar or honeydew) of honeys (White, Citation1978). In our study, this parameter showed typical nectar honeys values, and ranged from 0.2 to 2.7 g/kg. The mean value of ash found in this study (1.6 g/kg) was same to that found in E. officinarum subsp. echinus (1.6 g/kg) and E. regis-jubae honeys (1.5 g/kg).
Sugar profiles could help toward distinguishing between unifloral honeys. Fructose and glucose were identified and quantified in all the samples under analysis (). Quantitatively, glucose and fructose were the dominant saccharides, fructose was present in higher quantities (range: 305.9–445 g/kg) than glucose (range: 218.5–443 g/kg). Our results regarding the glucose content were comparable to those found by Chakir et al. (Citation2016) for E. resinifera and in E. echinus honeys (mean glucose = 299.8 and 283.3 g/kg, respectively), and were slightly lower for fructose than those found by the same authors (mean fructose for E. resinifera and E. echinus honeys = 408.5 and 417 g/kg, respectively).
Mineral elements
Honey usually contains a variety of mineral, potassium being the major mineral component (White, Citation1975). The difference in the content of trace elements in the honey varieties is principally due to the floral origin (Bogdanov, Haldimann, Lunginbül, & Gallmann, Citation2007).
The mean contents of each mineral found in the 29 honeys, expressed in mg/kg fresh weight, are shown in . In order to display with much clearness the results of the 14 minerals, we divided the elements in three groups according to their amount. The first group was formed by the major elements and comprises seven elements (calcium, potassium, magnesium, sodium, phosphorus, sulfur, and silicon). The K was quantitatively the most significant; and accounts for 63% of the total minerals measured, which coincides with other studies made in other countries (Egypt, Italy, Portugal, or Mexico), which consider this mineral to be the most abundant element in honey (Conti, Stripeikis, Campanella, Cucina, & Tudino, Citation2007; Mondragón-Corteza, Ulloa, Rosas-Ulloa, Rodríguez-Rodríguez, & Resendiz Vázquez, Citation2013; Rashed & Soltan, Citation2004; Silva, Videira, Monteiro, Valentao, & Andrade, Citation2009). Ca was the second most abundant mineral being the mean value 99.57 mg/kg; this value is similar to those found by Chakir, Romane, Barbagianni, Bartoli, and Ferrazzi (Citation2011) in E. resinifera honey (mean = 71.80 mg/kg), and to those found by Bettar et al. (Citation2015) in E. officinarum subsp. echinus (mean = 134 mg/kg) and E. regis-jubae honeys (mean = 101 mg/kg). P was the third most abundant element (mean = 62.36 mg/kg) representing approximately 7% of the total mineral measured. Generally, the values of Ca and P found in our honey samples agree with those of Mexican, and Israeli and Spanish avocado honey (Dag, Afik, Yeselson, Schaffer, & Shafir, Citation2006; Mondragón-Corteza et al., Citation2013; Terrab, Recamales, González-Miret, & Heredia, Citation2005).
Table 2. Distribution data for mineral content (mg/kg) in Euphorbia resinifera honeys.
Tabla 2. Contenido en minerales expresado en mg/kg en mieles de Euphorbia resinifera.
Na had 54.20 mg/kg as a mean, quantity considered largely inferior than that found in Moroccan E. officinarum subsp. echinus (mean = 127 mg/kg) and E. regis-jubae honeys (mean = 264 mg/kg), and also lower than those found in honey from other countries (western Mexico: mean = 96.94 mg/kg; south-eastern Anatolia: mean = 118 mg/kg; Egypt: range: 378–478 mg/kg) (Bettar et al., Citation2015; Mondragoón-Corteza et al., Citation2013; Rashed & Soltan, Citation2004; Yilmaz & Yavuz, Citation1999).
The three remaining mineral elements (S, Mg, and Si) of this group are present in lower quantities (mean = 35.71, 30.02, and 18.63 mg/kg, respectively). The Mg content coincides with that found in Anatolian (Yilmaz & Yavuz, Citation1999: mean = 33 mg/kg), Irish (Downey, Hussey, Jelly, Walshe, & Martin, Citation2005: mean = 31 mg/kg), and Spanish honeys (Fernández-Torres et al., Citation2004: mean = 39 mg/kg).
The second group consists of aluminum, iron, and manganese, with Al as the mainly abundant element (mean = 6.75 mg/kg), while Fe is found with a mean of 4.37 mg/kg, and Mn with values of less than 1 mg/kg. Amounts of Al found in E. officinarum subsp. echinus (mean = 17 mg/kg) were larger than those found in our honey samples. Fe values in honey samples are reported to be in the range of 0.97–1.91 mg/kg in Saudi honeys and 8.86–13.3 mg/kg in Indian honeys (Al-Khalifa & Al-Arify, Citation1999; Nanda, Sarkar, Sharma, & Bawa, Citation2003). Generally, the levels of iron in honeys from Italy, Spain, and Turkey were about the same as our samples (Conti et al., Citation2007; Latorre et al., Citation1999; Tuzen, Silici, Mendil, & Soylak, Citation2007).
The third group is made up of copper, lead, lithium, and zinc, which are almost always present in values of less than 0.1 mg/kg. Lead is a naturally occurring element but largely originating from human activities, and considered appropriate for the testing of the pollution of the atmosphere (Porrini et al., Citation2003; Przybylowski & Wilcznska, Citation2001). Due to the recommendations of European Food Safety Authority (EFSA, Citation2010) on the risks to human health related to the presence of lead in foodstuffs, the European Union established more restrictive limits for this contaminant in food from January 2016, and regarding honey, a maximum level of 0.10 mg/kg was established (European Commission, Citation2015). It should be mentioned here that the small amounts of lead in our analyzed samples, and revealing practically no pollution in the environment and soil in the region where our unifloral honey are obtained.
Regarding the total element amount, our unifloral E. resinifera honeys show an average around 863 mg/kg, a value considered high for light honeys, like orange blossom honeys, and undoubtedly low for dark honeys, like avocado, ziziphus, or oak unifloral honeys (Chakir et al., Citation2011; Terrab & Heredia, Citation2004).
Color parameters
The color of honey is one of its most variable features, mainly owing to its floral origin. The color characteristics of the honeys under study were expressed as L* for darkness/lightness (0 black, 100 white), C*ab, for chroma varies from 0° to 360°, hab for qualitative attribute of color varies from 0º to 360º, a* (from green, −a, to red +a), and b* (from blue, −b, to yellow, +b) (Anupama, Bhat, & Sapna, Citation2003).
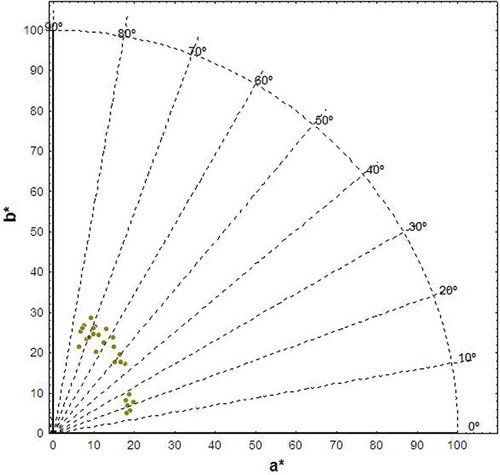
The results of the color attributes (L*, C*ab, and hab) are given in . This can be observed graphically in which shows the projection of the color points corresponding to each honey sample on the (a*, b*)-plane. The samples were located in the first quadrant, ranging the hue from reddish orange to orange yellow (hue angle between 10° and 80°), around 20–30 units of chroma, indicating a middle-low color saturation.
Table 3. Distribution of the color variables measured by diffuse reflectance method in the CIE 1976-L* a* b* (CIELAB) color space in Euphorbia resinifera honeys.
Tabla 3. Parámetros del color medidos por reflexión en el espacio CIE 1976-L* a* b* (CIELAB) de las mieles de Euphorbia resinifera.
Figure 2. Distribution of Euphorbia resinifera honey within the CIELAB color space (a*b*-diagram).
Figura 2. Distribución de las mieles de Euphorbia resinifera en el diagrama a*b* del espacio CIELAB.
Statistical analysis
Another objective of this work was to check the ability of physicochemical attributes, minerals, and color parameters to differentiate among the three botanical-related Euphorbia honey types (E. resinifera, E. officinarum subsp. Echinus, and E. regis-jubae honey). Thus, PCA and SDA were applied on experimental standardized data obtained from the present study and from Bettar et al. (Citation2015). After applying the PCA to the data set it was seen that the first five principal components (PCs) explained 78.29% of the total variance (). The first component, which explained the 30.54% of the variance, was mainly linked to pH, Na, C*ab, and b* value, whereas the second PC, which explained the 22.01% of the total variance, was related to K and a* value. Data of the three Euphorbia honey types were graphically expressed as a projection of linear PC scores along the first two eigenvector axes, each a function of all variables under study. It can be seen from , the first component led to the separation of the three Euphorbia honeys types. In order to observe the contribution of the physicochemical attributes, minerals and color parameters studied to the differentiation among Euphorbia honey types, the results are subjected to a discriminant analysis. The criterion for the selection of variables was the Wilks’ λ, which maximizes the ratio of variance between groups to that within groups (). Forward stepwise method selected K, chroma (C*ab), and a* values as the variables of highest discriminant capacity. Two classification functions were obtained, which yielded a good separation (100% correct classification) among samples (). The discriminate function 1 was mainly related to C*ab and K (with negative sign), whereas discriminate function 2 was mainly linked to a* (negative sign). As it can be seen in , discriminate function 1 mostly discriminates between the three Euphorbia honey types.
Table 4. Rotated factor loading, explained and cumulative variance.
Tabla 4. Valores de los componentes principales, porcentaje de la varianza y porcentaje acumulado.
Table 5. Stepwise discriminant analysis: Wilks’ λ, F-values, p signification levels, and standardized coefficient for canonical variable.
Tabla 5. Análisis Discriminante: lambda de Wilks, valor de F, nivel de significación (p-valor) y coeficientes estandarizados de las funciones discriminantes canónicas.
Figure 3. Scores plot of the three Euphorbia honey types using the two first principal components obtained by PCA.
Figura 3. Representación de los tres tipos de miel de Euphorbia según los dos primeros componentes principales obtenidos por el Análisis de Componentes Principales.
Figure 4. Scatterplot of the three Euphorbia honey types in the plane defined by the canonical function when botanical origin is considered for discrimination.
Figura 4. Representación de los tres tipos de miel de Euphorbia clasificados por su origen botánico usando las funciones discriminantes calculadas.
Conclusions
From the commercial standpoint, the physicochemical characterization of these valuable and unique unifloral honeys may increase substantially their commercial value. Certain parameters (moisture, acidity, and HMF), highly associated to the honey quality, agree with the legislation. The values found for EC, minerals, and ashes are all characteristic of yellow/amber color. Regarding the mineral content, the low amounts for Al and Na (mean = 6.75 and 54.2 mg/kg, respectively) should be highlighted. The color parameters showed values typical of light-amber honeys, both in terms of lightness (L*; range: 36–70 units) and chroma (C*ab; range: 18–30 units). On the other hand, this study exhibits by means of multivariate analysis as the physicochemical variables can discriminate between unifloral honeys from very related botanical origin.
Acknowledgments
We thank to beekeepers of the Province of Azilal and Beni Mellal for administrating the samples.
Disclosure statement
No potential conflict of interest was reported by the authors.
References
- Al-Khalifa, A.S., & Al-Arify, I.A. (1999). Physicochemical characteristics and pollen spectrum of some Saudi honeys. Food Chemistry, 67, 21–25. doi:10.1016/S0308-8146(99)00096-5
- Alves, A., Ramos, A., Margarida Gonçalves, M., Bernardo, M., & Mendes, B. (2013). Antioxidant activity, quality parameters and mineral content of Portuguese monofloral honeys. Journal of Food Composition and Analysis, 30, 130–138. doi:10.1016/j.jfca.2013.02.009
- Anupama, D., Bhat, K.K., & Sapna, V.K. (2003). Sensory and physicochemical properties of commercial samples of honey. Food Research International, 36, 183–191. doi:10.1016/S0963-9969(02)00135-7
- Association of Official Analytical Chemists International. (2005). AOAC Official Method 920.175 Official Methods of Analysis of AOAC International (18th ed.). Gaithersburg, MD: Author.
- Bettar, I., González-Miret, M.L., Hernanz, D., Marconi, A., Heredia, F.J., & Terrab, A. (2015). Characterisation of Moroccan Spurge (Euphorbia) honeys by their physicochemical characteristics, mineral contents and colour. Arabian Journal of Chemistry. doi:10.1016/j.arabjc.2015.01.003
- Bogdanov, S., Haldimann, M., Lunginbül, W., & Gallmann, P. (2007). Minerals in honey: Environmental, geographical and botanical aspects. Journal of Apicultural Research, 46, 269–275. doi:10.1080/00218839.2007.11101407
- Bogdanov, S., Ruoff, K., & Oddo, L.P. (2004). Physico-chemical methods for the characterisation of unifloral honeys: A review. Apidologie, 35, 4–17. doi:10.1051/apido:2004047
- Chakir, A., Romane, A., Barbagianni, N., Bartoli, D., & Ferrazzi, P. (2011). Major and trace elements in different types of Moroccan honeys. Australian Journal of Basic and Applied Sciences, 5, 223–231.
- Chakir, A., Romane, A., Marcazzan, G.M., & Ferrazzi, P. (2016). Physicochemical properties of some honeys produced from different plants in Morocco. Arabian Journal of Chemistry, 9, S946–S954. doi:10.1016/j.arabjc.2011.10.013
- Commission Internationale de l’Éclairage. (2004). Technical report CIE 015:2004 Colorimetry (3rd ed.). Vienna: Author.
- Conti, M.E., Stripeikis, J., Campanella, L., Cucina, D., & Tudino, M.B. (2007). Characterization of Italian honeys (Marche Region) on the basis of their mineral content and some typical quality parameters. Chemistry Central Journal, 1, 14. doi:10.1186/1752-153X-1-14
- EU Council (2002). Council Directive 2001/110/EC of 20 December 2001 relating to honey. Official Journal of the European Communities, L, 10, 47–52.
- Dag, A., Afik, O., Yeselson, Y., Schaffer, A., & Shafir, S. (2006). Physical, chemical and palynological characterization of avocado (Persea americana Mill.) honey in Israel. International Journal of Food Science and Technology, 41, 387–394. doi:10.1111/ifs.2006.41.issue-4
- Díez, M.J., Andrés, C., & Terrab, A. (2004). Physicochemical parameters and pollen analysis of Moroccan honeydew honeys. International Journal of Food Science and Technology, 39, 167–176. doi:10.1046/j.0950-5423.2003.00769.x
- Downey, G., Hussey, K., Jelly, J.D., Walshe, T.F., & Martin, P.G. (2005). Preliminary contribution to the characterisation of artisanal honey produced on the island of Ireland by palynological and physicochemical data. Food Chemistry, 91, 347–354. doi:10.1016/j.foodchem.2004.06.020
- Escriche, I., Visquert, M., Carot, J.M., Domenech, E., & Fito, P. (2008). Effect of honey thermal conditions on hydroxymethylfurfural content prior to pasteurization. Food Science and Technology International, 14, 29–35. doi:10.1177/1082013208094580
- European Commission. (2015). Commission Regulation (EU) No 2015/1005 of 25 June 2015 amending Regulation (EC) No 1881/2006 as regards maximum levels of lead in certain foodstuffs. Official Journal of the European Communities, L, 161, 9–13.
- European Food Safety Authority. (2010). Panel on contaminants in the food chain (CONTAM); Scientific opinion on lead in food. European Food Safety Authority Journal, 8, 1570.[151pp].
- Féas, X., Pires, J., Iglesias, A., & Estevinho, M.L. (2010). Characterization of artisanal honey produced on the Northwest of Portugal by melissopalynological and physico-chemical data. Food and Chemical Toxicology, 12, 3462–3470. doi:10.1016/j.fct.2010.09.024
- Fernández-Torres, R., Pérez-Bernal, J.L., Bello-López, M.A., Callejón Mochón, M., Jiménez-Sánchez, J.C., & Guiraúm-Pérez, A. (2004). Mineral content and botanical origin of Spanish honeys. Talanta, 65, 686–691. doi:10.1016/j.talanta.2004.07.030
- Gomes, S., Dias, L.G., Moreira, L.L., Rodrigues, P., & Estevinho, L. (2010). Physicochemical, microbiological and antimicrobial properties of commercial honeys from Portugal. Food and Chemical Toxicology, 48, 544–548. doi:10.1016/j.fct.2009.11.029
- Krauze, A., & Zalewski, R.I. (1991). Classification of honeys by principal component analysis on the basis of chemical and physical parameters. Zeitschrift Für Lebensmitteluntersuchung Und Forschung A, 192, 19–23. doi:10.1007/BF01201436
- Latorre, M.J., Peña, R., Pita, C., Botana, A., García, S., & Herrero, C. (1999). Chemometric classification of honeys according to their type. II. Metal content data. Food Chemistry, 66, 263–268. doi:10.1016/S0308-8146(98)00217-9
- Mateo, R., & Bosch-Reig, F. (1998). Classification of Spanish unifloral honeys by discriminant analysis of electrical conductivity, color, water content, sugars and pH. Journal of Agricultural and Food Chemistry, 46, 393–400. doi:10.1021/jf970574w
- Mondragoón-Corteza, P., Ulloa, J.A., Rosas-Ulloa, P., Rodríguez-Rodríguez, R., & Resendiz Vázquez, J.A. (2013). Physicochemical characterization of honey from the West region of México. CyTA - Journal of Food, 11, 7–13. doi:10.1080/19476337.2012.673175
- Nanda, V., Sarkar, B.C., Sharma, H.K., & Bawa, A.S. (2003). Physicochemical properties and estimation of mineral content in honey produced from different plants in Northern India. Journal of Food Composition and Analysis, 16, 613–619. doi:10.1016/S0889-1575(03)00062-0
- Porrini, C., Sabatini, A.G., Girotti, S., Ghini, S., Medrzycki, P., Grillenzoni, F., … Celli, G. (2003). Honey bees and bee products as monitors of the environmental contamination. Apiacta, 38, 63–70.
- Przybylowski, P., & Wilcznska, A. (2001). Honey as an environmental marker. Food Chemistry, 74, 289–291. doi:10.1016/S0308-8146(01)00153-4
- Rashed, M.N., & Soltan, M.E. (2004). Major and trace elements in different types of Egyptian mono-floral and non-floral bee honeys. Journal of Food Composition and Analysis, 17, 725–735. doi:10.1016/j.jfca.2003.10.004
- Silva, L.R., Videira, R., Monteiro, A., Valentao, P., & Andrade, P. (2009). Honey from Luso region (Portugal): Physicochemical characteristics and mineral contents. Microchemical Journal, 93, 73–77. doi:10.1016/j.microc.2009.05.005
- StatSoft Inc. (2007). STATISTICA (data analysis software system), version 8.0. Retrieved from www.statsoft.com
- Terrab, A., Díez, M.J., & Heredia, F.J. (2003a). Palynological, physico-chemical and colour characterisation of Moroccan honeys. III. Other unifloral honey types. International Journal of Food Science and Technology, 38, 395–402. doi:10.1046/j.1365-2621.2003.00713.x
- Terrab, A., González, A.G., Díez, M.J., & Heredia, F.J. (2003b). Mineral content and electrical conductivity of the honeys produced in north-west Morocco and their contribution to the characterisation of unifloral honeys. Journal of the Science of Food and Agriculture, 83, 637–643. doi:10.1002/jsfa.1341
- Terrab, A., & Heredia, F.J. (2004). Characterisation of avocado (Persea americana) honeys by their mineral content and physicochemical characteristics. Journal of Science of Food and Agriculture, 84, 1801–1805. doi:10.1002/jsfa.1888
- Terrab, A., Marconi, A., Bettar, I., Msanda, F., & Díez, M.J. (2014). Palynological characterization of Euphorbia honeys from Morocco. Palynology, 38, 138–146. doi:10.1080/01916122.2013.871797
- Terrab, A., Recamales, A.F., González-Miret, M.L., & Heredia, F.J. (2005). Contribution to the study of avocado honeys by their mineral contents using inductively coupled plasma optical emission spectrometry. Food Chemistry, 92, 305–309. doi:10.1016/j.foodchem.2004.07.033
- Tuzen, M., Silici, S., Mendil, D., & Soylak, M. (2007). Trace element levels in honeys from different regions of Turkey. Food Chemistry, 103, 325–330. doi:10.1016/j.foodchem.2006.07.053
- Victorita, B., Marghitas, L.A., Stanciu, O., Laslo, L., Dezmirean, D., & Bobis, O. (2008). High-performance liquid chromatographic analysis of sugars in transylvanian honeydew honey. Bulletin UASVM Animal Science and Biotechnologies, 65, 229–232.
- White, J.W., Jr. (1975). Honey. In R.A. Grout (Ed.), The hive and the honeybee (pp. 625–646). Hamilton, IL: Dadant and Sons.
- White, J.W., Jr. (1978). Honey. Advances in Food Research, 24, 287–373.
- Yilmaz, H., & Yavuz, Ö. (1999). Content of some trace metals in honey from south-eastern Anatolia. Food Chemistry, 65, 475–476. doi:10.1016/S0308-8146(98)00205-2