
 ?Mathematical formulae have been encoded as MathML and are displayed in this HTML version using MathJax in order to improve their display. Uncheck the box to turn MathJax off. This feature requires Javascript. Click on a formula to zoom.
ABSTRACT
To improve product quality and osmotic efficiency, the effects of osmotic dehydration (OD) at 120 min and ultrasound-assisted osmotic dehydration (UOD) at 45 min on the nutrient composition, flavor, texture, microstructure, and water state in button mushrooms were investigated. In terms of nutrient composition, the results showed that UOD produced samples with reducing sugar, ascorbic acid, and soluble protein content at significantly higher rates than OD process. Meanwhile, UOD reduced the losses in titratable acidity, free amino acids, and 5′-nucleotides compared to the OD process, and the UOD samples also showed a better texture and microstructure. In addition, low-field nuclear magnetic resonance data revealed that the relative signal intensity of vacuole protons declined during OD process; meanwhile, the UOD was more efficient than the OD treatment. Overall, UOD process not only retained nutrient composition and flavor material more effectively but also improved the texture and efficiency of mushrooms treated with osmosis.
RESUMEN
Con el fin de mejorar la calidad del producto y su eficiencia osmótica, se investigaron los efectos que la deshidratación osmótica (OD) durante 120 min y la deshidratación osmótica asistida por ultrasonido (UOD) durante 45 min provocaban en la composición de nutrientes, sabor, textura, microestructura y estado del agua encontrados en el champiñón común. En términos de la composición de nutrientes, los resultados obtenidos revelaron que la aplicación de UOD produce muestras con menor contenido de azúcares, ácido ascórbico y proteína soluble a una velocidad significativamente superior que la obtenida mediante el proceso de OD. Asimismo, en comparación con el proceso de OD, la UOD redujo las pérdidas en acidez valorable, aminoácidos libres y 5′-nucleótidos, comprobándose que las muestras obtenidas a partir de la aplicación de UOD acusaron mejor textura y microestructura. Por otra parte, los datos recabados mediante la RMN-BF establecieron que durante la aplicación del proceso de OD disminuyó la intensidad de la señal relativa de protones de vacuola, y que la UOD demostró ser más eficiente que el tratamiento con OD. En general se pudo constatar que el proceso de UOD no solo preservó la composición de nutrientes y el sabor más eficazmente; además, mejoró la textura y la eficiencia de los champiñones tratados con ósmosis.
1. Introduction
As a good source of soluble nonvolatile taste components (Tsai, Wu, Huang, & Mau, Citation2007) and nutrients (Mattila et al., Citation2001), button mushroom (Agaricus bisporus) is one of the most widely cultivated and popularly edible mushrooms in the world (Walton, Walker, & Ioannides, Citation1998). However, the button mushroom has a short shelf life of just a few days and quickly loses its edible quality due to its high respiratory, high metabolic rates, and susceptibility to microbial attacks (Fito et al., Citation2001; Jiang et al., Citation2011).
Osmotic dehydration (OD) using hypertonic solutions is widely applied to partially remove water from plant tissues. The process achieves minimally processed food with a longer shelf life while retaining higher quality (Silva, Fernandes, & Mauro, Citation2014). The difference in osmotic pressure between the cell and the hypertonic solution is the major driving force for the partial removal of water through the semi-permeable cell membrane (Rastogi, Raghavarao, Niranjan, & Knorr, Citation2002). The mass transfer during OD is achieved mainly through capillary flow and diffusion (Rahman & Perera, Citation2007). As a pretreatment method, the OD technique has been widely used in drying, freezing, and storage of vegetables and fruits. However, OD is an inefficient process because of consuming large amount of time (Deng & Zhao, Citation2008). Ultrasound is an acoustic wave with a frequency ranging from 20 kHz to 100 MHz and can propagate through a material medium such as solid, liquid, or gaseous (Nowacka, Tylewicz, Laghi, Dalla Rosa, & Witrowa-Rajchert, Citation2014). In recent years, the ultrasound has also been used to assist in the OD process to positively influence both moisture loss and solid gain. There are at least two reasons that we have proposed that ultrasound technology might assist the OD process. One, it could achieve a sponge effect through affecting a series of alternative compressions and expansions in the material which could benefit the exchange of mass during the OD process (Yun & Zhao, Citation2008). The other is the ultrasound could create many microscopic channels in the tissue (Fan, Gallão, & Rodrigues, Citation2008). Therefore, OD assisted by ultrasound could increase efficiency (Cheng, Zhang, Adhikari, & Islam, Citation2014).
Furthermore, ultrasonic-assisted osmotic dehydration (UOD) could be a novel approach for food preservation and processing. Xin, Zhang, and Adhikari (Citation2013) showed that UOD could improve the mass exchange rate and produce a higher glass transition temperature (). Nowacka et al. (Citation2014) explained that kiwifruit subject to UOD exhibited a slight redistribution of water and better cell structures. Deng and Zhao (Citation2008) demonstrated that ultrasonic-assisted osmotic treatment had a significant effect on the kinetics of water loss and sugar gain. However, to the best of our knowledge, there is no study in literature that reports on the variation of mushrooms in nutrition, texture and the state of water during ultrasonic-assisted osmotic treatment.
Accordingly, the purpose of this article was to study the changes of button mushrooms in nutrition such as reducing sugar, total sugar level, ascorbic acid level, and soluble protein content; non-volatile components such as titratable acids, free amino acids and 5′-nucleotides; texture such as hardness, chewiness and microstructure; and state of water during the OD and UOD process to determine better methods for button mushroom processing.
2. Materials and methods
2.1. Sample preparation
Fresh button mushrooms of homogeneous size were bought at a local market (Nanjing, China). The initial moisture content of button mushrooms was 92.63 ± 0.11% (w.b.). Button mushrooms were washed and stems were discarded. Then, the mushrooms were cut into 5 mm thick slices with a mushroom slicer (MSC International Co., Montreal, Canada).
2.2. Osmotic dehydration
Based on the earlier experimental data, there was no significant difference (p > 0.05) with the water contents of UOD samples at the 45 min (80.83 ± 1.28%) and OD samples at the 120 min (79.09 ± 0.4%). Thus, two different osmotic treatments were carried out in 50% (w/w) of sucrose solution at 30°C. One was the ultrasonic-assisted osmotic treatment (UOD) in which the button mushroom samples were immersed in osmotic solution for 45 min in an ultrasonic bath (Model SB25-12DTDN, Ningbo Scientz Biotechnology Co., Ltd, Ningbo, China). The ultrasound frequency was 40 kHz and the power was 200 W to avoid increases in solution temperature. The other treatment was the OD without the ultrasound treatment (OD) in which the samples were immersed in osmotic solution for 120 min in a thermostatic water bath (HH-4, Guohua Instrument Inc., Changzhou, China). The ratio of mushrooms-to-osmotic solution was about 1:10 (w/w) in order to avoid the influence of the changes in the solution concentration during osmotic treatment. After the treatments, the samples were washed with distilled water for 10 s and prepared for the following experiments.
2.3. Determination of water content and solid gain
Three different samples (fresh, OD, and UOD) were weighed before and after osmotic treatment by the digital balance [Mettler-Toledo Instruments (Shanghai) Co., Ltd, Shanghai, China]. Then, the samples were dried in an oven (Model 101, Sujin Instrument Inc., Shanghai, China) at 105°C to a constant final weight. The water content and soluble solids gain of the mushroom were calculated according to Eqs. (1) and (2), respectively.
where m0 (g) is the initial mass of fresh mushrooms before osmotic treatment, m1 (g) is the dry mass of mushrooms after osmotic treatment, and x0 is the initial moisture content of fresh mushrooms. The data are reported as average values of duplicate experiments.
2.4. Microstructure and texture
The samples were frozen at −30°C and then were freeze-dried at 40°C and at a pressure level of 100 pa in a lab-scale freeze dryer (Labconco Equipment Co., KS, USA). Then, the dried samples were cut into 5 mm × 1 mm × 1 mm cubes and examined using a Scanning Electron Microscope (TM3000, Hitachi Co, Ltd., Tokyo, Japan).
The textures of the samples (Fresh, OD, and UOD) were analyzed based on a texture profile analysis technique according to the described method (Gowen et al., Citation2008) using a Texture Analyzer (TA.XT Plus, Stable Micro System Co, England) with the test parameters set as follows: pre-test speed 2 mm/s, test speed 1 mm/s, post-test speed 5 mm/s, time lag between two compressions 2 s, strain 30% of sample height, 6 mm diameter cylindrical stainless steel probe.
2.5. Low field nuclear magnetic resonance and magnetic resonance imaging
Proton transverse relaxation time (T2) of mushrooms was examined using a low field pulsed analyzer (NMI20-analyst, Niumag Co., Ltd., Shanghai, China). One gram of mushrooms was placed in a 15-mm NMR tubes. The analysis used the Carr–Purcell–Meiboom–Gill pulse sequence at 32°C with typical pulse parameters: spectrometer frequency (SF) for protons = 19 MHz, spectral width = 200 kHz, waiting time = 4000 ms, the number of the scans (NS) = 4.90° (P1) = 13 μs, 180° (P2) = 24 μs, radiofrequency delay time = 0.500 ms, analog gain (RG1) = 20 db, and digital gain (DRG1) = 3. Two dimensional proton images of the mushrooms were examined using the imaging software (ver. 1.06, Niumag) with magnetic resonance imaging (MRI) parameters: echo time = 1.5 ms, recycle time = 200 ms, NS = 4, slice thickness: 5.00 mm.
2.6. Determination of reducing sugar, total sugar level, ascorbic acid level, and soluble protein content
The reducing sugar content in the mushrooms was measured using DNS (3,5-dinitrosalicylic acid) methods (Pei et al., Citation2014), total sugar was measured using the phenol-sulfuric acid method as d-glucose equivalents (Chen, Xie, Nie, Li, & Wang, Citation2008), ascorbic acid was determined using the ascorbic acid assay kit, and soluble protein content was determined by soluble protein assay kit (Nanjing Jiancheng Bioengineering Institute, Nanjing, China).
2.7. Determination of titratable acid, free amino acid, and 5′-nucleotide levels
The titratable acid levels of the mushrooms were determined according to the titration method (Cao et al., Citation2010). The samples were dried in a lab-scale freeze dryer (Labconco Equipment Co., KS, USA). Approximately 0.2 g of dried samples was ground down in fine powder and placed in hydrolysis tubes with 10 mL of 6 M hydrochloric acid. The hydrolysis tubes were sealed and placed in the oven at 110°C for 24 h. After hydrolysis, the samples were concentrated using a rotary evaporator (Heidolph Instruments GmbH & Co. KG, Kelheim, Germany) and the residue was dissolved in 0.02 M of hydrochloric acid to a final volume of 50 mL. The extract was filtered through a 0.22-μm filter membrane before analysis using an automatic amino acid analyzer (Hitachi Co, Ltd., Tokyo, Japan).
5′-Nucleotide levels were determined as described by Taylor, Hershey, Levine, Coy, and Olivelle (Citation1981). The samples were weighed, ground to fine powder, and blended with distilled water to make up a volume of 10 mL. The suspension was heated to boiling for 1 min, cooled down to room temperature, and then centrifuged at 4500 r/min for 15 min. The residue was extracted three times using the method described above. The supernatants were combined, concentrated in vacuo, and combined with distilled water to make up a volume of 10 mL, and filtered through a 0.22-μm filter membrane prior to analysis.
5′-Nucleotide levels were determined by an Agilent 1200 HPLC system (Agilent Technologies, Palo Alto, CA, USA) with a Zorbax Eclipse XDB C18 column (250 X4.6 mm, 5 μm, Agilent). The mobile phase consisted of distilled water/methanol/acetic acid/tetrabutylammonium hydroxide (894.5/100/5/0.5, v/v/v/v). The flow rate was 0.7 mL/min and the injection volume was 20 μL. The temperature of the column oven was set at 25°C and the DAD was set at 254 nm for UV analysis.
2.8. Statistical analysis
The data were analyzed using one-way analyses of variance with SPSS 10.0. The significance of difference was defined as p < 0.05 and least significant difference was used for multiple range tests and to compare means.
3. Results and discussion
3.1. Water content and solid gain
Water content and solid gain have been used to evaluate an osmotic treatment (Lerici, Pinnavaia, Rosa, & Bartolucci, Citation1985). The water content and sugar gain of the mushrooms (fresh, OD, and UOD) had been presented in . The water contents of UOD samples at the 45 min (80.83 ± 1.28%) and OD samples at the 120 min (79.09 ± 0.4%) were no significant difference (p > 0.05) and they were significantly lower (p < 0.05) than that in the fresh samples (92.63%). This phenomenon could be due to the formation of microscopic channels treated by ultrasound, which prompting the water diffusion from the cells to the hypertonic solution (Rodrigues & Fernandes, Citation2007; Simal, Benedito, Sánchez, & Rosselló, Citation1998). Meanwhile, the solid gain in the OD samples (0.039) was significantly higher (p < 0.05) than that in the UOD samples (0.036). This result could be attributed to the shorter treatment time for UOD. Meanwhile, microscopic channels treated by ultrasound could prompt the water transport but could not facilitate the sucrose transport, because of its high-molecular weight (Fernandes & Rodrigues, Citation2008).
Table 1. The water content, solid gain (SG), nutrition, and titratable acid of Agaricus bisporus treated by OD and UOD processes.
Tabla 1. Contenido de agua, grano sólido (SG), nutrición y acidez valorable de Agaricus bisporus tratado mediante los procesos de OD y UOD.
3.2. Texture and microstructure
Hardness and chewiness are two important indices for the texture of mushrooms. As shown in , there was a difference in the hardness and chewiness of the samples (fresh, OD, and UOD). The hardness in the fresh samples (1261.56 g) was highest among the three treatments. This might relate to the rupture of cell walls during the OD process, which could be caused by the hypertonic solution (50% sucrose). In addition, the effect of the ultrasound caused many microscopic channels in the cell walls (Fan et al., Citation2008).
Table 2. The hardness and chewiness of Agaricus bisporus treated by OD and UOD processes.
Tabla 2. Dureza y masticabilidad de Agaricus bisporus tratado mediante procesos de OD y UOD.
However, the chewiness of the fresh mushrooms (447.04) was lower than that of the UOD samples (493.67). This phenomenon could be a result of the decrease in cell turgor caused by the osmotic effect. Meanwhile, the shorter osmotic time and sponge effect caused by the ultrasound might not damage the cell wall (Zdunek & Bednarczyk, Citation2006). In addition, the hardness and chewiness of UOD samples (951.07 g and 493.67, respectively) were significantly higher (p < 0.05) than those of the OD samples (291.95 g and 158.43, respectively). This might be due to a reduction in mechanical modulus of mushroom tissue and loss of cell turgor caused by the rupturing of cell walls in the hypertonic solution during OD process (Deng & Zhao, Citation2008).
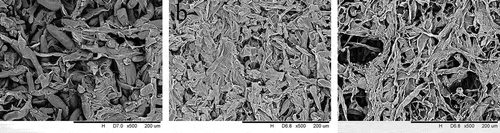
The SEM micrographs of fresh, UOD, and OD samples revealed a considerable difference in the microstructures. showed the different degrees of shrinkage in the UOD and OD samples compared to the fresh samples. This might be due to the high osmotic pressure between the cell and hypertonic solution which caused the rupture of the cell walls. However, the shrinkage of mushroom tissue in OD samples was worse than the UOD samples. This result could be attributed to the longer osmotic time in OD samples.
Figure 1. Scanning electron microscopy (SEM) micrographs of Agaricus bisporus treated by OD and UOD processes.
Figura 1. Micrográficos de Agaricus bisporus tratado mediante procesos OD y UOD obtenidos con microscopio electrónico de barrido (MEB).
(a) Fresh button mushrooms, (b) UOD (45 min): UOD button mushrooms for 45 min, (c) OD (120 min): OD button mushrooms for 120 min. All micrographs were taken on the surface of the samples.
(a) Champiñones comunes frescos, (b) UOD-45 min: champiñones comunes tratados mediante UOD durante 45 min, (c) OD-120 min: champiñones comunes tratados mediante OD durante 120 min. Todas las micrografías fueron tomadas de la superficie de las muestras.
3.3. The state of water in the mushrooms measured using low field nuclear magnetic resonance
The state of water in the mushrooms was measured using low field nuclear magnetic resonance (LF-NMR) to study the water mobility and the distribution of water molecules. Some unusual brightness appeared in the top of the pictures, and this could have been caused by the limitation of the height measurement of the low field pulsed analyzer. The spin relaxation time (T2) in LF-NMR is capable of responding to the variation of water mobility and distribution of water observed during the OD process.
In general, according to the different relaxation time values, the relaxation time could be divided into three regions, including T21, T22, T23, which meant the water was present in the cell walls, cytoplasm, and vacuole, respectively (Cornillon, Citation2000).
showed the variation between the typical T2 distribution curves during the OD process. Three proton pools in the different treatments of mushrooms were found and could be related to amount of water in the cell wall, cytoplasm, and vacuole. listed the relaxation times and relative areas of T22 and T23 in the different samples which received different treatments. It could be observed from that there was a strong relationship with the osmotic treatment leading to the shorter relaxation times of T23 in the OD and UOD samples.
Table 3. The relaxation times and relative areas of T22 and T23 populations of Agaricus bisporus treated by OD and UOD processes.
Tabla 3. Tiempos de relajación y áreas relativas de las poblaciones T22 y T23 de Agaricus bisporus tratado mediante procesos de OD y UOD.
Figure 2. Typical distribution of T2 relaxation of Agaricus bisporus treated by OD and UOD processes.
Figura 2. Distribución típica de T2 relajación de Agaricus bisporus tratado mediante procesos de OD y UOD.
(a) Typical distribution of T2 relaxation of UOD mushrooms; (b) typical distribution of T relaxation of OD mushrooms; fresh: fresh button mushrooms; OD (40 min), OD (80 min), and OD (120 min): button mushrooms with osmotic dehydration for 40, 80, and 120 min, respectively; UOD (15 min), UOD (30 min), and UOD (45 min): button mushrooms with ultrasound assistant osmotic dehydration for 15, 30, and 45 min, respectively.
(a) Distribución típica de T2 relajación de champiñones UOD; (b) Distribución típica de T relajación de champiñones OD; Frescos: champiñones comunes frescos; OD-40 min, OD-80 min y OD-120 min: champiñones comunes sometidos a UOD durante 15 min, 30 min y 45 min, respectivamente.
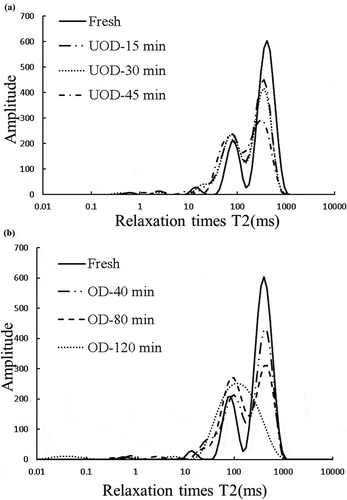
Meanwhile, the relative signal intensity of the vacuole protons declined during OD. This might be related to the diffusion of moisture from vacuole to hypertonic solution and the increase in the ratio of solutes to water. Moreover, it might result from the shrinkage in the vacuole due to water loss during OD (Cheng et al., Citation2014).
However, it could be seen from that about 98% of the main population group T22 exhibited a relaxation time of around 120.72 ms, and the relaxation times and relative areas of the mushrooms in the OD samples at the 120 min were significantly different (p < 0.05) from other treatments. This result could be attributed to the rupture of cells coupled with the loss of selective permeability leading to the increase of viscosity in cells.
Compared with the OD group, the UOD process had a much greater influence on the relaxation times and relative areas. showed that the relaxation times and the relative areas of T23 in UOD samples for 30 min (368.65 ms and 0.57) and 45 min (320.63 ms and 0.51) were significantly shorter and less (p < 0.05) than those in OD samples for 40 min (370.93 ms and 0.64), respectively. It was expected that the effect of the ultrasound treatment might create many microscopic channels in the cell wall which would make moisture diffusion from the cells easier (Cárcel, Benedito, Rosselló, & Mulet, Citation2007).
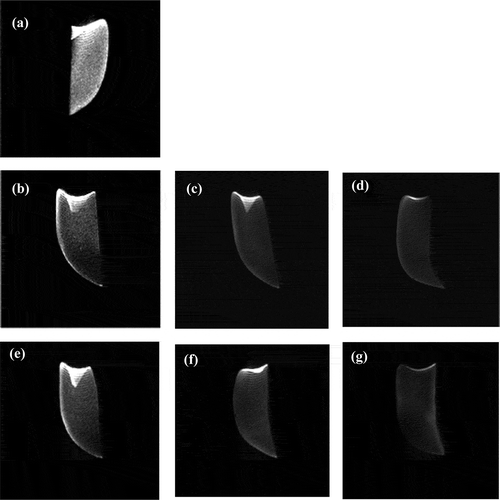
In order to further research, the state of water in the mushrooms during the OD process, MRI was used to investigate the variation of water contents at different regions. The bright image signal in MRI was related to high water content, and the dark image signal was related to more rigid structures (Gussoni et al., Citation2007). Thus, the water distribution could be quantified. showed the water distribution in different samples (fresh, UOD, and OD). It was obvious that the image of the fresh mushrooms () was much brighter than the others due to its high moisture content. The darkness of the images increased with the increase of processing time in the OD and UOD samples. However, the images of UOD samples at 45 min () and OD samples at 120 min () were different, and the state of water of the OD samples at 120 min was not homogeneous compared to the UOD samples at 45 min. This phenomenon could be the result of structural changes in cells during the ultrasound (Xin et al., Citation2013). It could be seen in that the water was removed from the center and spread outward. In addition, a bright ‘water strip’ presented in the periphery of all samples.
Figure 3. Water-selective transverse images of Agaricus bisporus treated by OD and UOD processes.
Figura 3. Imagen transversal, selectiva de humedad, de Agaricus bisporus tratado mediante procesos de OD y UOD.
(a) Fresh button mushrooms, (b) UOD (15 min): UOD button mushrooms for 15 min, (c) UOD (30 min): UOD button mushrooms for 30 min, (d) UOD (45 min): UOD button mushrooms for 45 min, (e) OD (40 min): OD button mushrooms for 40 min, (f) OD (80 min): OD button mushrooms for 80 min, (g) OD (120 min): OD button mushrooms for 120 min. All of these images are displayed at the same grayscale levels in order to facilitate the comparison.
(a) Champiñones comunes frescos, (b) UOD-15 min: champiñones comunes tratados mediante el proceso de UOD durante 15 min, (c) UOD-30 min: champiñones comunes tratados mediante el proceso de UOD durante 30 min, (d) UOD-45 min: champiñones comunes tratados mediante el proceso de UOD durante 45 min, (e) OD-40 min: champiñones comunes tratados mediante el proceso de OD durante 40 min, (f) OD-80 min: champiñones comunes tratados mediante el proceso de OD durante 80 min, (g) OD-120 min: champiñones comunes tratados mediante el proceso de OD durante 120 min. Se presentan todas estas imágenes empleando la misma escala de grises para facilitar su comparación.
3.4. Reducing sugar level, total sugar level, ascorbic acid level, and soluble protein content
The reducing sugar level, total sugar level, ascorbic acid level, and soluble protein content in samples are often investigated to estimate the change of nutritional composition during OD (Pan, Zhao, Zhang, Chen, & Mujumdar, Citation2003). The experimental data concerning these factors were shown in . It could be seen that the reducing sugar, ascorbic acid, and soluble protein in fresh samples (53.95, 53.91, and 8.66 mg/g, respectively) were significantly higher (p < 0.05) than that in the UOD and OD samples. These results indicated that OD caused the loss of reducing sugar, ascorbic acid, and soluble protein. This could be related to the semi-permeability of the cell membrane during OD which allowed the solutes to diffuse into the hypertonic solution from the cell (Ahmed, Qazi, & Jamal, Citation2016).
In addition, reducing sugar, ascorbic acid, and soluble protein levels in the UOD samples (19.54, 33.81, and 3.09 mg/g, respectively) were much higher than that in the OD samples (6.03, 17.76, and 2.04 mg/g, respectively). However, the total sugar (200.45 mg/g) in fresh samples was significantly lower (p < 0.05) than that in the UOD samples (397.70 mg/g) and the OD samples (401.39 mg/g). This phenomenon could be the result of the shorter treatment time for UOD and the creation of microscopic channels by the ultrasound which might limit the diffusion of sucrose, ascorbic acid, and soluble protein due to their high-molecular weight compared to water (Fernandes & Rodrigues, Citation2008).
3.5. Titratable acidity, free amino acids, and 5′-nucleotides
Titratable acidity can be estimated by the total content of organic acids (Stojanovic & Silva, Citation2007). The value of titratable acidity was presented in . The titratable acidity in the fresh, UOD, and OD samples was 12.82, 5.78, and 4.89 mg/g, respectively, and all osmotic treatments significantly reduced the titratable acidity of button mushrooms. This might be explained by the fact that substances with low-molecular weights (such as saccharides, organic acids, vitamins, and mineral salts) may be eluted due to mass exchange during OD, and this elution could have a remarkable influence on the final nutrition and sensory characteristics (Lenart, Citation1996). Moreover, the titratable acidity levels in the UOD samples were slightly higher than in the OD samples, but the difference was insignificant.
The levels of the free amino acids were shown in . Asp and Glu were the two free amino acids which were most represented in the fresh samples (17.05 and 38.25 mg/g), whereas Glu and Met were most prevalent in the UOD samples (7.56 and 3.30 mg/g) and OD samples (4.74 and 2.43 mg/g). The total levels of free amino acids were 152.02 mg/g in fresh samples, 32.46 mg/g in UOD samples, and 22.02 mg/g in OD samples, and the total free amino acids in fresh samples were significantly higher than in other treatments.
Table 4. The free amino acid of Agaricus bisporus treated by OD and UOD processes.
Tabla 4. El aminoácido de Agaricus bisporus tratado mediante procesos de OD y UOD.
These results were observed because free amino acids were eluted during the OD process. In addition, free amino acids could be divided into several classes according to their taste characteristics. One category comprises the MSG-like components which have mushroom-like tastes, such as Asp and Glu; other free amino acids are considered to be sweet components, including Gly and Thr; finally, the bitter components include Val, Met, Ile, Leu, Phe, His, and Arg (Yamaguchi, Citation1979). showed that the levels of MSG-like components in fresh samples (55.30 mg/g) were significantly higher than that in UOD samples (10.49 mg/g) and OD samples (6.54 mg/g). The sweet components in fresh mushrooms (14.70 mg/g) were also significantly higher than in other samples. In addition, the sweet and bitter components in UOD samples (3.16 and 10.93 mg/g, respectively) were significantly higher than those in OD samples (2.22 and 7.61 mg/g, respectively). This might relate to the creation of microscopic channels which the free amino acids could not thread easily.
5′-GMP imparts meaty flavor and is used as a flavor enhancer (Litchfield, Citation1967), and 5′-IMP is related to the taste-active component in the button mushroom (Li et al., Citation2011). showed the levels of 5′-nucleotides in button mushrooms. It was obvious that levels of 5′-nucleotides in fresh mushrooms (25.94 mg/g) were significantly higher (p < 0.05) than those in other treatments. This meant that the OD had a negative effect on levels of 5′-nucleotides.
Table 5. The 5′-nucleotide of Agaricus bisporus treated by OD and UOD processes.
Tabla 5. El 5′-nucleótido Agaricus bisporus tratado mediante procesos de OD y UOD.
However, the levels of 5′-GMP in UOD samples (1.51 mg/g) were significantly higher (p < 0.05) than those present in OD samples (1.00 mg/g). The levels of 5′-IMP and 5′-AMP in the UOD and OD samples (1.50 mg/g 5′-IMP and 1.60 mg/g 5′-AMP in the UOD sample and 1.33 mg/g 5′-IMP, 1.40 mg/g 5′-AMP in the OD sample) were not significantly different (p > 0.05). However, the level of 5′-CMP in UOD samples (2.56 mg/g) was significantly less (p < 0.05) than in OD samples (4.90 mg/g). This might be due to the effect of the ultrasound which may damage the CMP.
4. Conclusions
Based on our studies, the UOD process demonstrated better efficiency, and the osmotic time was cut by 62.5% compared to OD process. Moreover, UOD process retained more nutrient and flavor compositions such as reducing sugar, soluble protein, titratable acid, 5′-nucleotides and free amino acids because of the short osmotic time. Besides, the texture of UOD products displayed more hardness and better chewiness and the microstructure of UOD products were more similar to fresh samples compared to OD products. In addition, UOD process showed more efficiency according to the LF-NMR and MRI data. Accordingly, UOD could be recommended and used to produce higher quality and more efficient osmotic mushroom products.
Acknowledgments
The authors acknowledge financial support for the National Natural Science Foundation of China: [Grant Number 31601482], the Natural Science Foundation of Jiangsu Province: [Grant Number BK20150986], the Natural Science Foundation of Jiangsu Higher Education Institutions of China: [Grant Number 15KJB550007], and the Priority Academic Program Development of Jiangsu Higher Education Institutions (PAPD).
Disclosure statement
No potential conflict of interest was reported by the authors.
Additional information
Funding
References
- Ahmed, I., Qazi, I. M., & Jamal, S. (2016). Developments in osmotic dehydration technique for the preservation of fruits and vegetables. Innovative Food Science & Emerging Technologies, 34, 29–43. doi:10.1016/j.ifset.2016.01.003
- Cao, S., Hu, Z., Pang, B., Wang, H., Xie, H., & Wu, F. (2010). Effect of ultrasound treatment on fruit decay and quality maintenance in strawberry after harvest. Food Control, 21(4), 529–532. doi:10.1016/j.foodcont.2009.08.002
- Cárcel, J., Benedito, J., Rosselló, C., & Mulet, A. (2007). Influence of ultrasound intensity on mass transfer in apple immersed in a sucrose solution. Journal of Food Engineering, 78(2), 472–479. doi:10.1016/j.jfoodeng.2005.10.018
- Chen, Y., Xie, M.-Y., Nie, S.-P., Li, C., & Wang, Y.-X. (2008). Purification, composition analysis and antioxidant activity of a polysaccharide from the fruiting bodies of Ganoderma atrum. Food Chemistry, 107(1), 231–241. doi:10.1016/j.foodchem.2007.08.021
- Cheng, X.-F., Zhang, M., Adhikari, B., & Islam, M. N. (2014). Effect of power ultrasound and pulsed vacuum treatments on the dehydration kinetics, distribution, and status of water in osmotically dehydrated strawberry: A combined NMR and DSC study. Food and Bioprocess Technology, 7(10), 2782–2792. doi:10.1007/s11947-014-1355-1ound
- Cornillon, P. (2000). Characterization of osmotic dehydrated apple by NMR and DSC. LWT-Food Science and Technology, 33(4), 261–267. doi:10.1006/fstl.2000.0653
- Deng, Y., & Zhao, Y. (2008). Effects of pulsed-vacuum and ultrasound on the osmodehydration kinetics and microstructure of apples (Fuji). Journal of Food Engineering, 85(1), 84–93. doi:10.1016/j.jfoodeng.2007.07.016
- Fan, F., Gallão, M. I., & Rodrigues, S. (2008). Effect of osmotic dehydration and ultrasound pre-treatment on cell structure: Melon dehydration. LWT - Food Science and Technology, 41(4), 604–610. doi:10.1016/j.lwt.2007.05.007
- Fernandes, F. A., & Rodrigues, S. (2008). Application of ultrasound and ultrasound-assisted osmotic dehydration in drying of fruits. Drying Technology, 26(12), 1509–1516. doi:10.1080/07373930802412256
- Fito, P., Chiralt, A., Betoret, N., Gras, M., Cháfer, M., Martınez-Monzó, J., ... Vidal, D. (2001). Vacuum impregnation and osmotic dehydration in matrix engineering: Application in functional fresh food development. Journal of Food Engineering, 49(2), 175–183. doi:10.1016/S0260-8774(00)00220-X
- Gowen, A., O’Donnell, C., Taghizadeh, M., Gaston, E., O’gorman, A., Cullen, P., ... Downey, G. (2008). Hyperspectral imaging for the investigation of quality deterioration in sliced mushrooms (Agaricus bisporus) during storage. Sensing and Instrumentation for Food Quality and Safety, 2(3), 133–143. doi:10.1007/s11694-008-9042-4
- Gussoni, M., Greco, F., Vezzoli, A., Paleari, M. A., Moretti, V. M., Lanza, B., & Zetta, L. (2007). Osmotic and aging effects in caviar oocytes throughout water and lipid changes assessed by 1 H NMR T 1 and T 2 relaxation and MRI. Magnetic Resonance Imaging, 25(1), 117–128. doi:10.1007/1-4020-4297-3_03
- Jiang, T., Zheng, X., Li, J., Jing, G., Cai, L., & Ying, T. (2011). Integrated application of nitric oxide and modified atmosphere packaging to improve quality retention of button mushroom (Agaricus bisporus). Food Chemistry, 126(4), 1693–1699. doi:10.1016/j.foodchem.2010.12.060
- Lenart, A. (1996). Osmo-convective drying of fruits and vegetables: Technology and application. Drying Technology, 14(2), 391–413. doi:10.1080/07373939608917104
- Lerici, C., Pinnavaia, G., Rosa, M. D., & Bartolucci, L. (1985). Osmotic dehydration of fruit: Influence of osmotic agents on drying behavior and product quality. Journal of Food Science, 50(5), 1217–1219. doi:10.1111/j.1365-2621.1985.tb10445.x
- Li, Q., Zhang, -H.-H., Claver, I. P., Zhu, K.-X., Peng, W., & Zhou, H.-M. (2011). Effect of different cooking methods on the flavour constituents of mushroom (Agaricus bisporus (Lange) Sing) soup. International Journal of Food Science & Technology, 46(5), 1100–1108. doi:10.1111/j.1365-2621.2011.02592.x
- Litchfield, J. (1967). Morel mushroom mycelium as a food‐flavoring material. Biotechnology and Bioengineering, 9(3), 289–304. doi:10.1002/bit.260090303
- Mattila, P., Könkö, K., Eurola, M., Pihlava, J.-M., Astola, J., Vahteristo, L., et al. (2001). Contents of vitamins, mineral elements, and some phenolic compounds in cultivated mushrooms. Journal of Agricultural and Food Chemistry, 49(5), 2343–2348. doi:10.1021/jf001525d
- Nowacka, M., Tylewicz, U., Laghi, L., Dalla Rosa, M., & Witrowa-Rajchert, D. (2014). Effect of ultrasound treatment on the water state in kiwifruit during osmotic dehydration. Food Chemistry, 144, 18–25. doi:10.1016/j.foodchem.2013.05.129
- Pan, Y., Zhao, L., Zhang, Y., Chen, G., & Mujumdar, A. S. (2003). Osmotic dehydration pretreatment in drying of fruits and vegetables. Drying Technology, 21(6), 1101–1114. doi:10.1081/DRT-120021877
- Pei, F., Yang, W.-J., Shi, Y., Sun, Y., Mariga, A. M., Zhao, L., et al. (2014). Comparison of freeze-drying with three different combinations of drying methods and their influence on colour, texture, microstructure and nutrient retention of button mushroom (Agaricus bisporus) slices. Food and Bioprocess Technology, 7(3), 702–710. doi:10.1007/s11947-013-1058-z
- Rahman, M. S., & Perera, C. O. (2007). Drying and food preservation. Handbook of Food Preservation, 403–432. doi:10.1201/9781420017373
- Rastogi, N., Raghavarao, K., Niranjan, K., & Knorr, D. (2002). Recent developments in osmotic dehydration: Methods to enhance mass transfer. Trends in Food Science & Technology, 13(2), 48–59. doi:10.1016/S0924-2244(02)00032-8
- Rodrigues, S., & Fernandes, F. A. (2007). Use of ultrasound as pretreatment for dehydration of melons. Drying Technology, 25(10), 1791–1796. doi:10.1080/07373930701595409
- Silva, K. S., Fernandes, M. A., & Mauro, M. A. (2014). Effect of calcium on the osmotic dehydration kinetics and quality of pineapple. Journal of Food Engineering, 134, 37–44. doi:10.1016/j.jfoodeng.2014.02.020
- Simal, S., Benedito, J., Sánchez, E. S., & Rosselló, C. (1998). Use of ultrasound to increase mass transport rates during osmotic dehydration. Journal of Food Engineering, 36(3), 323–336. doi:10.1016/S0260-8774(98)00053-3
- Stojanovic, J., & Silva, J. L. (2007). Influence of osmotic concentration, continuous high frequency ultrasound and dehydration on antioxidants, colour and chemical properties of rabbiteye blueberries. Food Chemistry, 101(3), 898–906. doi:10.1016/j.foodchem.2006.02.044
- Taylor, M., Hershey, H., Levine, R., Coy, K., & Olivelle, S. (1981). Improved method of resolving nucleotides by reversed-phase high-performance liquid chromatography. Journal of Chromatography A, 219(1), 133–139. doi:10.1016/S0021-9673(00)80584-1
- Tsai, S.-Y., Wu, T.-P., Huang, S.-J., & Mau, J.-L. (2007). Nonvolatile taste components of Agaricus bisporus harvested at different stages of maturity. Food Chemistry, 103(4), 1457–1464. doi:10.1016/j.foodchem.2006.10.073
- Walton, K., Walker, R., & Ioannides, C. (1998). Effect of baking and freeze-drying on the direct and indirect mutagenicity of extracts from the edible mushroom Agaricus bisporus. Food and Chemical Toxicology, 36(4), 315–320. doi:10.1016/S0278-6915(97)00161-0
- Xin, Y., Zhang, M., & Adhikari, B. (2013). Effect of trehalose and ultrasound-assisted osmotic dehydration on the state of water and glass transition temperature of broccoli (Brassica oleracea L. var. botrytis L.). Journal of Food Engineering, 119(3), 640–647. doi:10.1016/j.jfoodeng.2013.06.035
- Yamaguchi, S. (1979). The umami taste [Flavor of foods]. Paper presented at the ACS Symposium series American Chemical Society. doi: 10.1021/bk-1979-0115.ch002
- Yun, D., & Zhao, Y. (2008). Effect of pulsed vacuum and ultrasound osmopretreatments on glass transition temperature, texture, microstructure and calcium penetration of dried apples (Fuji). LWT - Food Science and Technology, 41(9), 1575–1585. doi:10.1016/j.lwt.2007.10.018
- Zdunek, A., & Bednarczyk, J. (2006). Effect of mannitol treatment on ultrasound emission during texture profile analysis of potato and apple tissue. Journal of Texture Studies, 37(3), 339–359. doi:10.1111/j.1745-4603.2006.00055.x