
 ?Mathematical formulae have been encoded as MathML and are displayed in this HTML version using MathJax in order to improve their display. Uncheck the box to turn MathJax off. This feature requires Javascript. Click on a formula to zoom.
ABSTRACT
The aim of this work was to isolate pulp (PH) and seed hydrocolloids (SH) of the fruit of Hymenaea corbaril L. and determinate chemical, functional and rheological properties, as a proposal of a new attractive product for functional applications in food systems. Both hydrocolloids have a high content of carbohydrates, minerals and fiber. The solubility of PH was higher 94.1%. The emulsifying capacity of SH, PH and GG increases with the hydrocolloid concentration. The emulsions showing a good stabilization stability with drop sizes of 5–20 μm. The emulsions PH and SH at 1% were higher stability than guar gum (GG), due to slower down the cremation index after 3 days of storage at 35 and 40°C. The hydrocolloids exhibited a pseudoplastic behavior at concentrations of 0.5–2%. The elastic behavior suggests its application to edible films, while the viscous behavior suggests its incorporation in food systems.
RESUMEN
Los hidrocoloides son utilizados como aditivos alimentarios, obtenidos de endospermos de semillas de dicotiledóneas. Una interesante alternativa para su uso como fuente biológica del estado de Guerrero es la extracción de hidrocoloides de pulpa (PH) y semilla (SH) del fruto de Hymenaea corbaril L. El objetivo de este trabajo fue aislar hidrocoloides de pulpa y semilla y determinar sus propiedades químicas, funcionales y reológicas para proponerlos como un nuevo producto atractivo con aplicación a los sistemas alimenticios. Los resultados fisicoquímicos mostraron que ambos hidrocoloides poseen un alto contenido en carbohidratos, minerales y fibra. La solubilidad del PH es mayor con 94.1%. Se observó buena estabilización de emulsiones con tamaños de gota de 5- 20 µm. Las emulsiones de PH y SH al 1% mostraron mayor estabilidad que GG debido a que mostraron un descenso más lento en el índice de cremado durante los tres días de almacenamiento a 35 y 40°C. Ambos hidrocoloides muestran comportamientos de tipo pseudoplástico n<1 a las concentraciones del 0.5-2%. El comportamiento elástico sugiere aplicaciones en la formación de películas comestibles, mientras que el comportamiento viscoso sugiere su incorporación en sistemas alimentarios.
PALABRAS CLAVE:
Introduction
Hydrocolloids are long chain polymers with high molecular weight, which dissolve in water providing viscosity to aqueous systems. They are used in the food industry as texture modifiers, stabilizers in emulsions and suspensions (Rodríguez, Sandoval, & Ayala, Citation2003). The chemical structure makes them resistant to hydrolysis by human digestive enzymes, promoting the growth of bacteria such as Lactobacillus and Bifidobacteria, and decreasing in the glycemic response, the cholesterol, and intestinal inflammation (Noack, Timm, Hospattankar, & Slavin, Citation2013). Some of the hydrocolloids for food use, are obtained from endosperms of dicotyledonous seeds, particularly legumes (Prajapati et al., Citation2013). One under study is coapinole or jatoba (Hymenaea courbaril L.), which grows abundantly throughout the Pacific coast (Tamayo, González, & Garcés, Citation2008). The studies on this hydrocolloid have focused on the elucidation of its chemical composition, composed of monomeric units of glucose:xylose:galactose:arabinose (glu:xyl:gal:ara) in a ratio of 4:3:2:1%. The main chain consists of β-1,4-glucose linkages with substitutions in the carbons (1,6)-α-D-xylopyranose and β-D-galactopyranosyl-(1,2)-α-D-xylopyranose. The rheological behavior of coapinol seed hydrocolloid has been reported by evaluating the effect of the concentration (0.5–1%) (Arruda et al., Citation2015), the elimination of galactoses (Busato, Reicher, Domingues, & Silveira, Citation2009) and addition of tetraborate of its structure (Martin, Freitas, Obayashi, & Sierakowski, Citation2003). A study demonstrates functionality of coapinole extracts (CE) when added to corn tortillas, CE increased viscosity peaks, gelatinization, enthalpy and water absorption improving the texture and quality of the elaborated tortillas (Calderón-Peralta et al., Citation2016). There is information about the chemical composition and rheological behavior of the hydrocolloid extracted from Hymenaea seeds; however, there is little information about their functional properties.
Moreover, the studies on the pulp of the Hymenaea fruit have focused on its antioxidant activity (Brito, De, Melo, Perdigão, & Alves, Citation2016), as antibacterial (Chávez, Abela, Bravo, Peñarrieta, & Rendón, Citation2012), and as a functional ingredient in the production of soft drinks and cookies due to the high nutritional value. According to (Dias Luzia, & Jorge, Citation2013), the pulp presents a composition similar to the seed in the content of carbohydrates and fiber, suggesting that both fractions may contain hydrocolloids. In addition, the pulp of the Hymenaea fruit has not been evaluated for the extraction of hydrocolloids. The aim of this work was to isolate pulp and seed hydrocolloids, and determinate chemical, functional and rheological properties, as a proposal of a new attractive product for functional applications in food systems.
Materials and methods
Biological material
The mature fruits of coapinol (Hymenaea courbaril L.), were collected in the Ocotito; municipality of Chilpancingo, Guerrero, México, with the coordinates latitude 17°15ʹ01.7ʹ’ N, longitude 99°30ʹ27.7ʹ’ W. Once collected, they were washed and the seeds and pulp were separated manually. The Guar gum (GG) (Sigma-Aldrich® G4129) was used as control.
Extraction of pulp hydrocolloids (PH) and seed (SH)
Seeds were scarified by acid hydrolysis using a solution of H2SO4 (1:1 v/v) at 100°C for 2 h. After this process, the seed coat was separated from the endosperm and the endosperms dried at 45°C for 48 h, subsequently milled and stored (at 35°C or room temperature). The extraction was done according to (Cerqueira et al., Citation2009). The endosperm flour and the pulp were dispersed separately in water at room temperature (25 ± 2°C) and subsequently filtered. The filtrate was centrifuged at 3500 rpm for 5 min, the supernatant was treated with 96° ethanol in a ratio of 1:1 v/v, once precipitated the hydrocolloid was collected and subsequently dehydrated at 45 ± 2°C for 12 h. The fractions obtained were the pulp (PH) and seed (SH) hydrocolloids.
Chemical and functional characterization
Chemical analysis
Moisture content was determined by gravimetric heating (80 ± 2°C for 6 h) using a 2–3 g sample. Ash, protein, and fat were analyzed according to AACC methods 08–01, 46–13, and 30–25, respectively (AACC, Citation2000). The carbohydrate content was calculated by difference.
Solubility
Ten mL of distilled water were added to falcon tubes with 0.1 g of hydrocolloid, subsequently they were placed in a water bath at temperatures of 10–70°C for 30 min and then the tubes were centrifuged at 2400 rpm for 30 min. The supernatant was emptied into trays and dried at 70°C for 6 h to obtain the percentage of solubility (FAO, Citation1999).
Emulsifying capacity (EC)
For the measurement of the emulsifying capacity, 100 mL of a hydrocolloid dispersion were prepared at the concentrations of 0.5–2%, then 10 mL of canola oil was added, the mixture was emulsified with a homogenizer (Ultra-Turrax IKA- T18 basic) at 10 000 rpm for 1 min (Yasumatsu et al., Citation1972). The obtained emulsion was centrifuged at 1300 g for 5 min. The emulsifying capacity (%) was calculated according to follow equation (Eq. 1).
Preparation of emulsions O/W
For the preparation of emulsions O/W, 100 mL hydrocolloid dispersions were prepared at the concentrations of 1 and 2%, then 10 mL of canola oil was added. During the incorporation of the oil phase, the mixture was homogenized at 10 000 rpm for 5 min using ULTRA-TURRAX (basic IKA-T18), then each emulsion was sonicated for 5 min at an amplitude of 80% at 20 kHz using Ultrasonic Processor (UP200st) (Sibaja-Hernández, Román-Guerrero, Sepúlveda-Jiménez, & Rodríguez-Monroy, Citation2015).
Stability and microscopy of O/W emulsions
Once the emulsions were made, they were stored at 35 and 40 ºC to determine their stability by measuring the cremation index (CI) with respect to time according to the following equation (Eq. 2) (McClements, Citation2007).
Where, hE is the total height of the emulsion and hL is the height of the supernatant layer. The day 7 of storage a drop of the emulsified layer was taken and observed under an inverted phase contrast microscope (EVOS FL auto) at 40X
Effect of hydrocolloids on the diffusion of glucose in a glucose-hydrocolloid system and its effect on starch digestion
Glucose-hydrocolloid system
The system comprised a glucose solution of 100 or 200 mM/L and one of the following hydrocolloids at 0.8%: pulp (PH) or seed (SH) hydrocolloids and a control with guar gum (GG) or with a system with glucose-water, 25 mL each hydrocolloid was dialyzed in dialysis bags with a cutoff molecular weight of 12,000 submerged 200 mL of deionized water at pH 7.0 and 37°C. After 10 min, 250 μL of the dialysis fluid was taken until reach 300 min; the carbohydrate content was determined by the DNS method. The maximum rate of diffusion of glucose (Vmax) was calculated by plotting the inverse of and
where
corresponds to Vmax.
Starch-hydrocolloid system
Forty grams of potato starch was added to ≈ 900 mL of 0.05 M phosphate buffer (pH 6.5). The solution, after stirring at 100°C for 30 min, and taken to a final volume to a final volume of 1000 mL to give a 4% (w/v) starch solution. The starch-α-amylase-dietary fiber system comprised the above starch solution, 0.4% (w/v) α-amylase, and one of the following hydrocolloids at 0.8%: guar gum (GG), pulp (PH) and seed (SH), 25 mL of each of these solutions were dialyzed in 200 mL of deionized water at 37°C with continuous agitation. The glucose content in the dialysate was measured at 30, 60, 90, 120, 150 and 180 min (Ou, Kwok, Li, & Fu, Citation2001).
Rheological measurements
Rheological evaluations were performed using a hybrid rheometer (TA Model HR2, TA Instrument, USA) using a flat plate geometry (plate SST ST 40 mm sandblast), gap of 1000 µm at the 25°C. Samples were loaded and allowed to reach equilibrium for 5 min. The experiments were conducted by using three steps of rheological measurements: (1) deformation sweeps, (2) frequency sweeps and (3) shear sweeps. Deformation sweeps (0.1 and 100%) of the samples were evaluated at 25°C, and at constant frequency of 0.1 Hz. These experiments were performed to determine the maximum deformation attainable by all samples in the linear viscoelastic region (LVR). Frequency sweeps of the samples were evaluated at 25°C. The mechanical spectra obtained were characterized by G′, G″ as a function of frequency (f (Hz)) in the range of 0.01 to 100 Hz, at a constant deformation (0.2% strain). G′ is the elastic or storage modulus, represents the stiffness of a viscoelastic material and is proportional to the energy stored during a loading cycle. G″ is the viscous or loss modulus, is defined as being proportional to the energy dissipated during one loading cycle. Shear sweeps were evaluated with the flow curves as a function of the shear rate (0.01 to 500 s−1), shear stress and viscosity. The experimental data were adjusted to the mathematical expression of the Carreau-Yasuda rheological model (Bird, Armstrong, & Hassager, Citation1987). The determination of the model of the best fit to the flow curves was carried out with the software of the equipment (Trios 3.2.0 3877, DHR TA instruments) with R2 = 0.999 according to the following equation (Eq. 3).
Where ƞ0 is the constant viscosity at very low shear rates (close to resting), ƞ∞ is the Newtonian viscosity for high values of shear rates, and C and b are the consistency and the flow behavior index, respectively.
Statistical analysis
The results were analyzed with ANOVA and the means were compared using the Tukey test (p ≤ 0.05), with the statistical software Minitab 17.
Results and discussion
Chemical and functional characterization
The proximal chemical composition of the coapinole pulp (PH) and seed (SH) hydrocolloids are shown in . The PH has an extraction yield of 6.19%. The source of obtaining the PH and the extraction method used, could favor the extraction of pectins. Studies report extraction yields ranging from 2–20% for hydrocolloids extracted from pulp from different sources (Guo et al., Citation2017; Yapo, Robert, Etienne, Wathelet, & Paquot, Citation2007). The yield for the SH was 62.11%, they differ to those already reported where the yield is 36–72% (Calderón-Peralta et al., Citation2016), this due to the methodological differences in the time of extraction and precipitation of the hydrocolloids (Kai, Petkowicz, & de, Citation2010).
Table 1. Chemical analysis of the hydrocolloids extracted from seed and pulp of the fruit of Hymenaea courbaril L.
Tabla 1. Análisis químico de hidrocoloides extraídos de semilla y pulpa del fruto de Hymenaea courbaril L.
The chemical composition shows that carbohydrates and total dietary fiber are the major components in both hydrocolloids, with less proportion of moisture, ashes and lipids; these contents are similar to those established by the CODEX Alimentarius for hydrocolloids. The protein content of the PH was 5.94%, similar to those reported for hydrocolloids extracted from pulp (Yapo et al., Citation2007). The protein value for SH was 7.91%, a value higher than the reported for hydrocolloids extracted from seed endosperm (Martin et al., Citation2003; Omaira, de Pinto Gladys, Maritza, Omaira, & Lilian, Citation2007); however, Kai and Olivera reported that this content of proteins may be due to the extraction time, which favors the extraction of structural proteins from the seeds.
Solubility
The results showed that the solubility is directly proportional to the increase in temperature for SH and GG. The maximum solubility reached for SH was 79.96% and 74.23% for GH without differences (), which can be attributed to its origin. The factors that can influence the high solubility are the low molecular weight, high content of galactoses and the high degree of branching that affects the solubility at low temperatures (Wüstenberg, Citation2015). The solubility observed for SH and GG suggests high molecular weight polysaccharides of ≈ 220 kDa for GG and 500 kDa for SH (Tamayo et al., Citation2008) with similar proportion of galactoses of 2:1% (man:gal) for GG and 4:3:2:1% (glu:xyl:gal:ara) for SH. So to reach the maximum solubility the temperature has to increase, this behavior is due to the fact that at high temperatures some molecules (with high molecular weight or low galactose content) are better solubilized than at room temperature (Gaisford, Harding, Mitchell, & Bradley, Citation1986).
Figure 1. Effect of temperature on the solubility of the pulp hydrocolloid (■), seed (▲) and guar gum (∆) at the concentration of 1%. The results represent the mean ± standard deviation of three determinations followed by the same letters do not differ by the Tukey test (p > 0.05).
Figura 1. Efecto de la temperatura sobre la solubilidad del hidrocoloide de pulpa (■), semilla (▲) y goma guar (∆) a la concentración de 1%. Los resultados representan la media ± desviación estándar de tres determinaciones. Valores con la misma letra no son diferentes estadísticamente de acuerdo a la prueba de Tukey (p > 0.05).
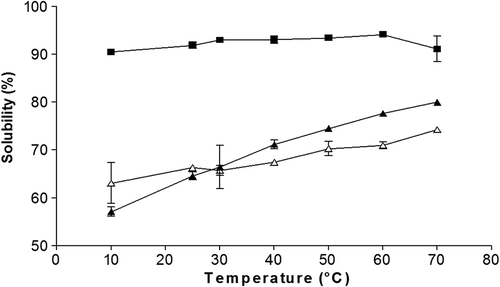
The PH showed the highest values of solubility with 94.1%; without significant effect of temperature (), which suggests a possible highly branched structure with a low molecular weight, this allows solubilization at low temperatures (Sébastien et al., Citation2014), offering high stability of the PH in unit operations (p.e pumping, mixing) and together with its low viscosity leading to possible applications in juices and food beverages.
Emulsifying capacity (EC) and stability
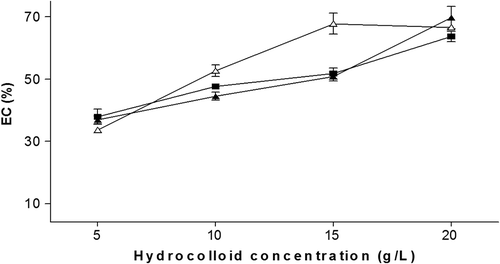
The results showed that the emulsifying capacity of SH, PH and GG increases with the hydrocolloid concentration (). Although these polymers are highly soluble, they have the ability to form highly hydrated entities of colloidal dimensions and thereby form tight networks or microscopic gels where the oil is adsorbed, besides being covalently linked in a lesser proportion to hydrophobic molecules those results in significant contribution to the emulsifying capacity (Sibaja-Hernández et al., Citation2015).
Figure 2. Emulsifying capacity (EC %) of the pulp hydrocolloid (■), seed (▲) and Guar gum (∆) used as control. The results represent the mean ± standard deviation of three determinations.
Figura 2. Capacidad emulsificante (EC %) del hidrocoloide de pulpa (■), semilla (▲) y goma guar (∆) usada como control. Los resultados representan la media ± desviación estándar de tres determinaciones.
Stability and microscopy of the O/W
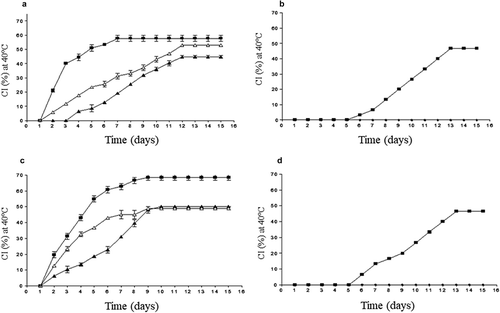
The results of emulsions stability showed that the SH at 1% slow down the cremation index after 3 days of storage at 35°C reaching an IC of 43.7%, these stored at 40°C with an IC of 50%. Emulsions with 1% GG showed IC of 49% at 35°C and 52.9% at 40°C. The least stable emulsions were those made with 1% PH (,c). Of the emulsions made at 2% hydrocolloid, only those stabilized with PH presented phase separation with an IC of 46.6%. Due to the null separation of emulsions stabilized with SH and 2% GG, the CI (0%) cannot be observed (). The stability observed in the emulsions O/W studied corresponds mainly to the effect of concentration, and temperature. The surface tension is not affected because in the structure of the xyloglucans of coapinole (SH) and Guar gum (GG) the presence of hydrophobic groups is almost null (Dickinson, Citation2009; Garti & Leser, Citation2001) and although the protein content in SH and PH is high these have little impact on stabilization (Dickinson, Citation2003; Garti & Reichman, Citation1993). Studies reported that only covalently bound proteins have an effect on the emulsifying properties of hydrocolloids such as arabica gum (Garti & Reichman, Citation1994).
Figure 3. Volume of the creamed layer for 1 (a and c) and 2% (b and d) emulsions O/W stabilized by pulp hydrocolloid (■), seed hydrocolloid (▲) and guar gum (∆) stored at 35 and 40°C for 15 days. The results represent the mean ± standard deviation of three determinations.
Figura 3. Volumen de la capa de cremado de las emulsiones O/W estabilizadas con hidrocoloide de pulpa (■), semilla (▲) y goma guar (∆) a concentraciones de 1% (a y c) y 2% (b y d) almacenados a 35 y 40°C durante 15 días. Los resultados representan la media ± desviación estándar de tres determinaciones.
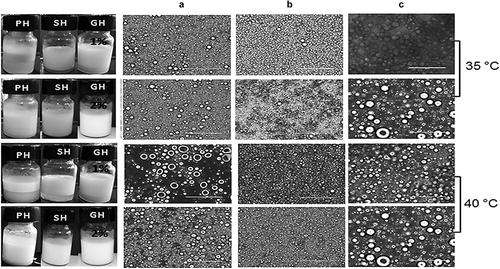
shows the micrographs of the emulsions made with hydrocolloid 1 and 2%, taken on day 7 of storage where the CI remained constant. The micrographs showed polydispersed profiles in all cases, with drop sizes characteristic of emulsions of ≈ 5 μm stabilized with SH, size of ≈ 10 μm with PH and finally of ≈ 20 μm with GG. The main mechanism of instability of the emulsions was flocculation.
Figure 4. Optical micrographs at 40X of emulsions O/W stabilized with hydrocolloid pulp (a), seed (b) and guar gum (c) at 1–2%, stored at 35 and 40°C for 15 days. The scale of the bar corresponds to 100 µm.
Figura 4. Micrografías ópticas de emulsiones O/W a 40X estabilizadas con hidrocoloides de pulpa (a), semillas (b) y goma guar (c) a 1–2%, almacenadas a 35 y 40°C durante 15 días. La escala de la barra corresponde 100 µm.
Effect of hydrocolloids on the diffusion of glucose in a glucose-hydrocolloid system and its effect on starch digestion
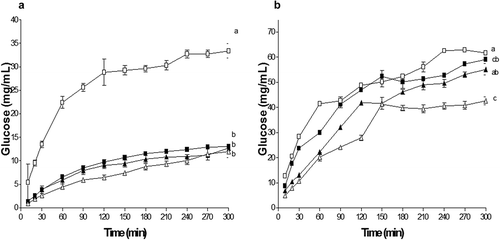
Because PH and SH showed high content of dietary fiber, subsequently the glucose diffusion in an in vitro system was studied. The results showed that the diffusion rates of glucose at 100 mM were affected by the addition of 0.8% hydrocolloid (). The glucose diffused in the systems increased in 11.96 mg/mL for the GG, 12.65 mg/mL for the SH, 13.05 mg/mL for the PH and 33.34 mg/mL for the Glucose system. The rate of diffusion (Vmax) of glucose tends to decrease in the following order: Glucose System> GG> PH> SH with the corresponding Vmax: 37.32 > 22.93 > 21.27 > 16.31 mg/min (), showing the significant effect on the delay of the diffusion of glucose. Additionally, when dialysis reaches equilibrium, the difference in glucose in the dialyzed control (glucose only) and the treatments (PH and SH) can be considered as the amount of glucose adsorbed by the hydrocolloid (Ou et al., Citation2001), so that hydrocolloids adsorbed 21.65, 20.69 and 20.29 mg/mL for GG, SH and PH respectively. However, in systems at 200 mM, the effect of hydrocolloids on glucose diffusion is negatively affected, because at this concentration the adsorption capacity of glucose is almost nil ().
Table 2. Maximum velocity of glucose diffusion in glucose-hidrocolloid system.
Tabla 2. Máxima velocidad de difusión de glucosa en un sistema glucosa-hidrocoloide.
Figure 5. Effect of pulp hydrocolloid (■), seed (▲), guar gum (∆) and glucose (□) on the diffusion of glucose in a 100 mM (a) and 200 mM (b) system. The guar hydrocolloid and glucose used as controls. The results represent the mean ± standard deviation of three determinations followed by the same letters do not differ by the Tukey test (p > 0.05).
Figura 5. Efecto del hidrocoloide de pulpa (■), semilla (▲), goma guar (∆) y glucosa (□) sobre la difusión de glucosa en un sistema a 100 mM (a) y 200 mM (b). Lo goma guar y la glucosa fueron utilizados como controles. Los resultados representan la media ± desviación estándar de tres determinaciones. Valores con la misma letra no son diferentes estadísticamente de acuerdo a la prueba de Tukey (p > 0.05).
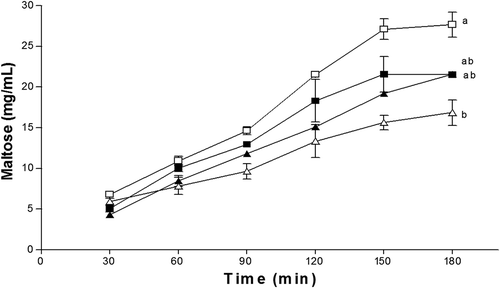
Furthermore, the addition of hydrocolloid to the starch solution affected the hydrolysis (). The results show a hydrolysis of the starch of 27.65 mg/mL, followed by the PH and SH with a hydrolysis of ≈ 21.50 mg/mL and finally the GG with 16.85 mg/mL. These differences can be attributed to the viscosity (GG> SH> PH), in addition to the proximal chemical composition, since it has been reported that proteins and fatty acids contribute to the inhibitory effect of α-amylase (Dartois, Singh, Kaur, & Singh, Citation2010). During the first 60 min of hydrolysis seemed to be no difference in the digestion, after this time the delay in hydrolysis can be observed, which can be attributed to the time at which the hydrocolloid reached the maximum hydration, delaying the action of the α-amylase through the encapsulation of starch (Eastwood & Morris, Citation1992), enhancing the beneficial effect on the decrease in the glycemic response (Gidley, Citation2013; Ou et al., Citation2001).
Figure 6. Effect of pulp hydrocolloids (■), seed (▲) and guar gum (∆) on the hydrolysis of starch (□) using α-amylases. The results represent the mean ± standard deviation of three determinations followed by the same letters do not differ by the Tukey test (p > 0.05).
Figura 6. Efecto de los hidrocoloides de pulpa (■), semilla (▲) y goma guar (∆) sobre la hidrolisis del almidón (□) usando α-amilasas. Los resultados representan la media ± desviación estándar de tres determinaciones. Valores con la misma letra no son diferentes estadísticamente de acuerdo a la prueba de Tukey (p > 0.05).
Rheological measurements
Flow curves
exhibit the curves where the viscosity (η Pa.s) was measured as a function of the shear rate (γ, s−1), for different concentrations of hydrocolloid. Shear thinning (pseudoplastic) was observed in all conditions studied. The pseudoplastic behavior is highly marked and at low shear rates the viscosity values (η = 0.568–9.179 Pa.s) were much higher in relation to the concentration, probably, due to the presence of a maximum of intra and intermolecular electrostatic repulsive interactions that could raise the viscosity, improving the consistency of the solutions when the shear was not large enough to break the conformation of the food matrix. This behavior has been reported for other hydrocolloids (Hosseini-Parvar, Matia-Merino, Goh, Razavi, & Mortazavi, Citation2010; Sébastien et al., Citation2014).
Figure 7. Rotational steady flow measurements of viscosity η as a function of shear rate γ (s1) of hydrocolloid pulp and of hydrocolloid seed at concentrations of 0.5 (●), 1.0 (о), 1.5 (▼) and 2 (Δ) % (w/v). As controls used guar gum 1% (■).
Figura 7. Mediciones de viscosidad η en estado estacionario en función de la velocidad de cizalla, γ (s1) de hidrocoloide de pulpa y semilla a concentraciones de 0.5 (●), 1.0 (о), 1.5 (▼) y 2 (Δ) % (w/v). Goma guar a 1% fue utilizada como control (■).
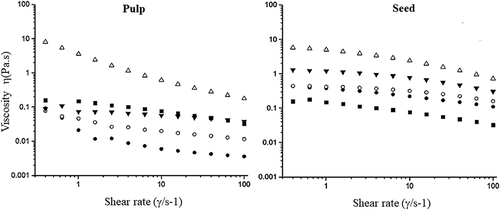
In the PH at the concentration of 0.5–1.5% the Newtonian behavior disappears until the concentration reached 2%, probably attributed to the low viscosity (η = 0.01–5.179 Pa.s), molecular weight at the lowest carbohydrate concentration, and protein content (). Which can take part of the ionic and intermolecular interactions providing less ions that would improve the viscosity values, showing greater flexibility and a fast macromolecular conformation at low shear rates with small viscosity changes (at 0.5–1.5%) (Sibaja-Hernández et al., Citation2015).
Viscoelastic behavior
The viscoelastic behavior of the hydrocolloids at 0.5–2% was studied, where the storage modulus (G’ Pa) and loss (G’’ Pa) were measured as a function of angular frequency (ω rad s−1) (). The system is maintained in the linear viscoelastic regime, where the structure is deformed but not destroyed, offering the possibility to probe the behavior of the structure of the hydrocolloids under study. Results show that G’ and G’’ increase as a function of frequency, this behavior has already been reported for (Arruda et al., Citation2015; De Freitas et al., Citation2015) and for other hydrocolloids such as: locust bean gum (Dakia, Blecker, Robert, Wathelet, & Paquot, Citation2008; Sébastien et al., Citation2014), the gums of Cassia gradis (Albuquerque et al., Citation2014) and those obtained from tree exudates (Sibaja-Hernández et al., Citation2015).
Figure 8. Oscillatory measurements G’ (●) and G’’ (о) as a function of the frequency ω (rad s−1) of the hydrocolloid seed (SH) at concentrations of 0.5% (a), 1% (b), 1.5% (c) and 2% (d). As controls used guar gum 1% (b) (▼).
Figura 8. Mediciones oscilatorias de G’ (●) y G’’ (ο) en función de la frecuencia ω (rad s−1) de hidrocoloide de semilla (SH) a concentraciones de 0.5% (a), 1% (b), 1.5% (c) y 2% (d). Goma guar a 1% (b) (▼) fue utilizada como control.
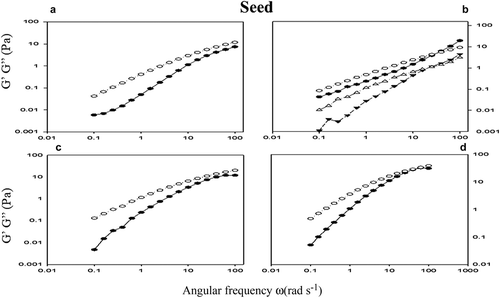
and show the behavior of the storage modulus (G’) and the loss modulus (G’’) as a function of frequency in SH, PH and GG dispersions at 0.5, 1.0, 1.5 y 2%. In the viscous behavior was greater than the elastic behavior (G’’> G’) for all the dispersions studied in the frequency intervals (0.01 to 100 Hz). This characteristic behavior indicates that dilute solutions. In this scenario, the polymer chains have adequate time to disentangle and slip by each other by the process of ‘reptation’. A ‘rubbery plateau’ region was observed at higher frequencies and concentration where G’ is similar that G”. These time scales allow polymer chains to come out of the entanglements that cause tension in the chain segments between the coupling points, and hence, the viscoelastic behavior dominates. The length of the rubbery plateau region relates to the MW of the polymer and its concentration (Arruda et al., Citation2015; Albuquerque et al., Citation2014; González-Cuello, Ramos-Ramírez, Cruz- Orea & Salazar-Montoya, Citation2012).
Figure 9. Oscillatory measurements G’ (●) and G’’ (о) as a function of the frequency ω (rad s−1) of the hydrocolloid pulp (PH) at concentrations of 0.5% (a), 1% (b), 1.5% (c) and 2% (d). As controls used guar gum 1% (b) (▼).
Figura 9. Mediciones oscilatorias de G’ (●) y G’’ (ο) en función de la frecuencia ω (rad s−1) de hidrocoloide de pulpa (PH) a concentraciones de 0.5% (a), 1% (b), 1.5% (c) y 2% (d). Goma guar a 1% (b) (▼) fue utilizada como control.
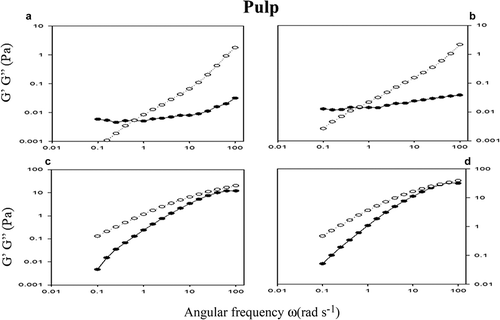
In at low concentrations and frequencies the predominant behavior is the viscoelastic solid (G’> G’’) and as the frequency increases the elastic behavior prevailed (G’’> G’). The PH dispersions at 1.5 and 2% show the same behavior that SH dispersions. The elastic behavior suggests its application to edible films, while the viscous behavior suggests its incorporation in food systems juices, drinks and emulsions, improving the physical characteristics (Arruda et al., Citation2015; Albuquerque et al., Citation2014).
Conclusions
This study provides relevant information on hydrocolloids extracted from pulp and seed of the Hymenaea courbaril fruit, harvested in Mexico. The chemical characteristics of both hydrocolloids show a high content of carbohydrates and fiber that contribute significantly to the delay of the hydrolysis of starch and the diffusion of glucose. The functional characteristics of SH are similar to guar gum, so it could be proposed as an interesting alternative for its application as a stabilizing agent. Additionally, the low viscosity and high solubility of the PH together with its rheological behavior suggest its incorporation in food systems such as juices, drinks and emulsions and SH in the formulation of edible films.
Acknowledgments
The authors would like to thank the scholarship awarded (745978) at Hernández-Morales, M. A. to study for a master´s degree by Consejo Nacional de Ciencia y Tecnología (CONACyT) and FOMIX project number 249611 by the financial support for realizing research stay.
Disclosure statement
No potential conflict of interest was reported by the authors.
Additional information
Funding
References
- AACC. (2000). Approved methods of the American Association of Cereal Chemists (10th Edn ed.). St. Paul, MN: U.S.A.
- Albuquerque, P. B. S., Barros, W., Santos, G. R. C., Correia, M. T. S., Mourão, P. A. S., Teixeira, J. A., & Carneiro-Da-Cunha, M. G. (2014). Characterization and rheological study of the galactomannan extracted from seeds of Cassia grandis Carbohydrate Polymers, 104(1), 127–134.
- Arruda, I. R. S., Albuquerque, P. B. S., Santos, G. R. C., Silva, A. G., Mourão, P. A. S., Correia, M. T. S., & Carneiro-da-Cunha, M. G. (2015). Structure and rheological properties of a xyloglucan extracted from Hymenaea courbaril var. courbaril seeds. International Journal of Biological Macromolecules, 73, 31–38.
- Bird, R. B., Armstrong, R. C., & Hassager, O. (1987). Dynamics of Polymeric Liquids. In Volume 1 (pp. 672). New York: Wiley‐Interscience, Fluid Mechanics, 2nd Wiley.
- Brito, M. S., De, Melo, M. B., Perdigão, J., & Alves, D. A. (2016). Partial purification of trypsin/papain inhibitors from Hymenaea courbaril L. Seeds and Antibacterial Effect of Protein Fractions, 43(1), 11–18.
- Busato, A. P., Reicher, F., Domingues, R., & Silveira, J. L. M. (2009). Rheological properties of thermally xyloglucan gel from the seeds of Hymenaea courbaril Materials Science and Engineering C, 29(2), 410–414.
- Calderón-Peralta, C. V., Jiménez-Hernández, J., Maldonado-Astudillo, Y. I., Flores-Casamayor, V., Arámbula-Villa, G., & Salazar, R. (2016). Influence of Hymenaea courbaril gum as a new additive on nixtamalized flour properties and quality of tortilla. Journal of Food Process Engineering. doi:10.1111/jfpe.12525
- Cerqueira, M. A., Pinheiro, A. C., Souza, B. W. S., Lima, A. M. P., Ribeiro, C., Miranda, C., Vicente, A. A. (2009). Extraction, purification and characterization of galactomannans from non-traditional sources. Carbohydrate Polymers, 75(3), 408–414.
- Chávez, G., Abela, C., Bravo, J., Peñarrieta, M., & Rendón, J. (2012). Estudio Del Fruto Comestible De La Especie Vegetal Garcinia Madruno. Revista Boliviana De Química, 29(1), 87–93.
- Dakia, P. A., Blecker, C., Robert, C., Wathelet, B., & Paquot, M. (2008). Composition and physicochemical properties of locust bean gum extracted from whole seeds by acid or water dehulling pre-treatment. Food Hydrocolloids, 22(5), 807–818.
- Dartois, A., Singh, J., Kaur, L., & Singh, H. (2010). Influence of guar gum on the in vitro starch digestibility-rheological and Microstructural characteristics. Food Biophysics, 5(3), 149–160.
- De Freitas, R. A., Spier, V. C., Sierakowski, M. R., Nicolai, T., Benyahia, L., & Chassenieux, C. (2015). Transient and quasi-permanent networks in xyloglucan solutions. Carbohydrate Polymers, 129, 216–223.
- Días, L., Luzia, D., & Jorge, N. (2013). Physicochemical and bioactive properties of Hymenaea courbaril L. pulp and seed lipid fraction. Industrial Crops and Products, 49, 610–618.
- Dickinson, E. (2003). Hydrocolloids at interfaces and the influence on the properties of dispersed systems. Food Hydrocolloids, 17(1), 25–39.
- Dickinson, E. (2009). Hydrocolloids as emulsifiers and emulsion stabilizers. Food Hydrocolloids, 23(6), 1473–1482.
- Eastwood, M. A., & Morris, E. R. (1992). Physical properties of dietary fiber that influence physiological function: A model for polymers along the gastrointestinal tract. The American Journal of Clinical Nutrition, 55, 436–442.
- FAO. (1999). Análisis físicoquimico del almidón. Guía técnica para la producción y análisis de almidon de Yuca, 140, 61–134.
- Gaisford, S. E., Harding, S. E., Mitchell, J. R., & Bradley, T. D. (1986). A comparison between the hot and cold water soluble fractions of two locust bean gum samples. Carbohydrate Polymers, 6(6), 423–442.
- Garti, N., & Leser, M. E. (2001). Emulsification properties of hydrocolloids. Polymers for Advanced Technologies, 12(1–2), 123–135. 10.1002/1099-1581(200101/02)12:1/2<123:: AID-PAT105>3.0.CO;2-0.
- Garti, N., & Reichman, D. (1993). Food structure hydrocolloids as food emulsifiers and stabilizers. Food Structure, 12(4), 411–426. Retrieved from http://digitalcommons.usu.edu/foodmicrostructure
- Garti, N., & Reichman, D. (1994). Surface properties and emulsification activity of galactomannans. Topics in Catalysis, 8(2), 155–173.
- Gidley, M. J. (2013). Hydrocolloids in the digestive tract and related health implications. Current Opinion in Colloid and Interface Science, 18(4), 371–378.
- González-Cuello, R.E, Ramos-Ramírez, E.G, Cruz-Orea, A, & Salazar-Montoya, A. (2012). Rheological characterization and activation energy values of binary mixtures of gellan. European Food Research and Technology, 234(2), 305-313. doi: 10.1007/s00217-011-1626-2
- Guo, X., Wang, Z., Pi, F., Pan, R., Zhao, Z., & Yu, S. (2017). Sequential extraction and physicochemical characterization of polysaccharides from chicory (Cichorium intybus) root pulp. Food Hydrocolloids. doi:10.1016/j.foodhyd.2017.10.004
- Hosseini-Parvar, S. H., Matia-Merino, L., Goh, K. K. T., Razavi, S. M. A., & Mortazavi, S. A. (2010). Steady shear flow behavior of gum extracted from Ocimum basilicum L. seed: Effect of concentration and temperature. Journal of Food Engineering, 101(3), 236–243.
- Kai, K. C., Petkowicz, C. L., & de, O. (2010). Influence of extraction conditions on properties of seed xyloglucan. International Journal of Biological Macromolecules, 46(2), 223–228.
- Martin, S., Freitas, R. A., Obayashi, E., & Sierakowski, M. R. (2003). Physico-chemical aspects of galactoxyloglucan from the seeds of Hymenaea courbaril and its tetraborate complex. Carbohydrate Polymers, 54(3), 287–295.
- McClements, D. J. (2007). Critical review of techniques and methodologies for characterization of emulsion stability. Critical Reviews in Food Science and Nutrition, 47(7), 611–649.
- Noack, J., Timm, D., Hospattankar, A., & Slavin, J. (2013). Fermentation profiles of wheat dextrin, Inulin and partially hydrolyzed guar gum using an in Vitro digestion pretreatment and in Vitro batch fermentation system model. Nutrients, 5(5), 1500–1510.
- Omaira, A., de Pinto Gladys, L., Maritza, M., Omaira, G., & Lilian, S. (2007). Structural features of a xylogalactan isolated from Hymenaea courbaril gum. Food Hydrocolloids, 21(8), 1302–1309.
- Ou, S., Kwok, K., Li, Y., & Fu, L. (2001). In vitro study of possible role of dietary fiber in lowering postprandial serum glucose. Journal of Agricultural and Food Chemistry, 49(2), 1026–1029.
- Prajapati, V. D., Jani, G. K., Moradiya, N. G., Randeria, N. P., Nagar, B. J., Naikwadi, N. N., & Variya, B. C. (2013). Galactomannan: A versatile biodegradable seed polysaccharide. International Journal of Biological Macromolecules, 60, 83–92.
- Rodríguez, E., Sandoval, A., & Ayala, A. (2003). Hidrocoloides naturales de origen vegetal. Tecnura, 13(13), 4–13.
- Sébastien, G., Christophe, B., Mario, A., Pascal, L., Michel, P., & Aurore, R. (2014). Impact of purification and fractionation process on the chemical structure and physical properties of locust bean gum. Carbohydrate Polymers, 108(1), 159–168.
- Sibaja-Hernández, R., Román-Guerrero, A., Sepúlveda-Jiménez, G., & Rodríguez-Monroy, M. (2015). Physicochemical, shear flow behaviour and emulsifying properties of Acacia cochliacantha and Acacia farnesiana gums. Industrial Crops Products, 67, 161–168.
- Tamayo, L. M. A., González, D. M. A., & Garcés, Y. J. (2008). Propiedades farmacológicas del Algarrobo (Hymenaea courbaril Linneaus) de interés para la industria de alimentos. Revista Lasallista de Investigación, 5(2), 100–111. Retrieved from http://148.215.2.11/articulo.oa?id=69550213
- Wüstenberg, T. (2015). General overview of food hydrocolloids. In Cellulose and cellulose derivatives in the food industry fundamentals and applications (pp. 1–68). Zibilske: Wiley-VCH. doi:10.1002/9783527682935.ch01
- Yapo, B. M., Robert, C., Etienne, I., Wathelet, B., & Paquot, M. (2007). Effect of extraction conditions on the yield, purity and surface properties of sugar beet pulp pectin extracts. Food Chemistry, 100(4), 1356–1364.
- Yapo, B. M., Wathelet, B., & Paquot, M. (2007). Comparison of alcohol precipitation and membrane filtration effects on sugar beet pulp pectin chemical features and surface properties. Food Hydrocolloids, 21(2), 245–255.
- Yasumatsu, K., Sawada, K., Moritaka, S., Misaki, M., Toda, J., Wada, T., & Ishii, K. (1972). Whipping and emulsifying properties of soybean products. Agricultural and Biological Chemistry, 36(5), 719–727.