
 ?Mathematical formulae have been encoded as MathML and are displayed in this HTML version using MathJax in order to improve their display. Uncheck the box to turn MathJax off. This feature requires Javascript. Click on a formula to zoom.
ABSTRACT
Different rice cultivars contain various metabolites which are closely related with their nutritional and functional effects. In the current study, NMR and chemometrics methods – decision tree analysis (DTA) were applied to explore the chemical characteristics in different rice cultivars. The pigmented rice were completely discriminated from each other, and the key metabolites that mostly contributed to the rice discrimination were explored, including sugars compounds (sucrose, fructose and glucose) and non-sugar compounds (γ-amino butyric acid (GABA), asparagine, citric acid and malic acid) with DTA approach and 1HNMR metabolite fingerprints. The purple rice has the highest concentrations of sucrose, citric acid and asparagine (p < 0.05), but lowest fructose (p < 0.05); red rice has the lowest GABA concentration comparing with the other three groups (p < 0.05). This study implies that DTA method is a powerful tool to discriminate different pigmented rice varieties. Furthermore, it also reveals the crucial nutrients based on 1H-NMR metabolic profiling.
RESUMEN
Diferentes cultivares de arroz contienen varios metabolitos estrechamente relacionados con sus efectos nutricionales y funcionales. El presente estudio utilizó la NMR, métodos quimiométricos y análisis del árbol de decisiones (DTA) para examinar las características químicas de distintos cultivares de arroz. Empleando el enfoque del DTA y las huellas de metabolitos 1HNMR, los distintos tipos de arroz pigmentados fueron totalmente discriminados unos de otros, y se analizaron los principales metabolitos que más contribuyen a dicha discriminación, entre ellos los compuestos del azúcar (sucrosa, fructosa y glucosa), y los compuestos no azúcares (ácido γ-aminobutírico (GABA), asparagina, ácido cítrico y ácido málico). Al respecto se determinó que el arroz morado contiene las concentraciones más elevadas de sacarosa, ácido cítrico y asparagina (p<0.05) y el nivel más bajo de fructosa (p<0.05); por otra parte, en comparación con los otros tres grupos de arroz, el arroz colorado tiene la concentración de GABA más baja (p<0.05). Los resultados de este estudio dan cuenta de que el método DTA constituye una herramienta poderosa para discriminar las distintas variedades de arroz pigmentado, al tiempo que, con base en el perfil metabólico 1H-NMR, da a conocer sus nutrientes cruciales.
1. Introduction
Rice serves as a staple food for more than half the world’s population, especially for people living in Asia. Rice is not only an important source of energy and protein but also provides vitamins, minerals, fibers and a large number of bioactive compounds for millions of people (Muthayya, Sugimoto, Montgomery, & Maberly, Citation2014). Globally, white rice is the most commonly consumed rice followed by brown rice and pigmented rice mainly including black, red and purple rice which have been commonly consumed as a diet hobby in some Asian countries for its unique color and flavor (Deng et al., Citation2013; Frank, Reichardt, Shu, & Engel, Citation2012). Pigmented rice is naturally bred rice varieties planted during earlier times in the history, but it has not been planted in many countries for a long time because of the low yields. Recently, pigmented rice has attracted consumer’s interest, because it has various potential health benefits, such as nutritional benefits (calories) (Vichapong, Sookserm, Srijesdaruk, Swatsitang, & Srijaranai, Citation2010), antioxidant activity (Tian, Nakamura, & Kayahara, Citation2004; Zhou, Robards, Helliwell, & Blanchard, Citation2004). The demand of pigmented rice is growing around the world, especially in many European countries and USA.
The benefits and values of consuming functional or nutraceutical foods on human health are prominent areas of research in the food science field. As one kind of nutraceutical food, pigmented rice is mainly black, red, and purple rice. There are some advantages of the pigmented rice reported by many researchers. For example, the pigmented rice contains more nutritive substances than common white rice such as total lipids, protein contents (Lee, Kim, Koh, & Ryu, Citation2006; Yoshida, Tomiyama, & Mizushina, Citation2010), free fatty acids, organic acids amino acids and so on (Frank et al., Citation2012). Furthermore, a variety of bioactive compounds like flavones, tannin, phenolics, sterols, tocols, γ-oryzanols, and essential oils were rich in pigmented rice (Deng et al., Citation2013). The major functional components of pigmented rice are anthocyanins and proanthocyanidins which belong to flavonoids performing many important functions in the human body such as anti-oxidative, anti-inflammatory and anticancer effects (Shipp & Abdelaal, Citation2010). Furthermore, the price of pigmented rice is much higher than the common rice due to its special therapeutic effects and low production yields. Thus, the compositional differences among pigmented rice have become a more and more important issue for the understanding of rice quality and composition.
Metabolomics is regarded as a powerful approach in many areas of food science and nutrition research because of high-throughput characterization of small molecule metabolites in biological matrices (Davids, Citation2008). Metabolomics profiling can be used to gain insight into food compositional differences or food material characteristics (Kang et al., Citation2010; Molina-Calle, De Medina, Priego-Capote, & De Castro, Citation2017). With the development of modern instruments more and more techniques have been used in the metabolomics study including chromatography, mass spectrometry, nuclear magnetic resonance (NMR) (Cevallos-Cevallos, Reyes-De-Corcuera, Etxeberria, Danyluk, & Rodrick, Citation2009). Among these methods, NMR-based metabolomics has proved a promising tool for food compositional analysis and food material characterization due to its capability to determine a great number of metabolites rapidly and simultaneously (Hill, Dias, & Roessner, Citation2016; Soininen et al., Citation2014). Currently, many multivariate data analyses approaches used in combination with 1H-NMR metabolomics have been indicated as versatile analytical tools that can provide comprehensive information on the metabolic profiles in both vegetal and animal matrices, such as principal component analysis (PCA) (Francini et al., Citation2017), partial least-squares discriminant analysis (PLS-DA) (Pereira et al., Citation2005), Linear Discriminant Analysis (LDA) (Huo et al., Citation2017), k-Nearest Neighbor (KNN) (Xu, Song, Li, & Wan, Citation2012), Support vector machine (SVM) (Masoum et al., Citation2007), Least square support vector machine (LS-SVM) (Jin et al., Citation2015). However, most of these methods cannot be applied to select the major patterns of several (>2) groups simultaneously.
NMR-metabolomics coupled with chemometrics methods have been applied to identify transgenic and non-transgenic rice (Keymanesh, Darvishi, & Sardari, Citation2009), different kinds of rice types (Monakhova et al., Citation2014) and geographical origins (Huo et al., Citation2017). However, metabolic profiling of colored rice monitored by NMR and the identification of compositional difference existing in the pigmented rice based on combination of NMR-metabolomics and DTA have not yet been reported. The aim of the present work was to provide new information about the overall composition of both sugars and non-sugar metabolites among four pigmented rice species using NMR metabolites profiling. Furthermore, a classical chemometric method, decision tree analysis combined with 1H-NMR spectroscopy (Wang et al., Citation2018) was firstly used to construct classification models to identify the critical chemicals for determining compositional differences of pigmented rice.
2. Materials and methods
2.1. Samples and chemicals
In this study, a total of 60 rice paddy samples were prepared including four rice cultivars; Gang-te-you 37 (red), Li-ren-zi (purple), Hei-you 1 (black) and Hua-you 1762 (colorless). All the samples were collected from farmer households in Hubei province of China during September 2016. Fifteen samples were collected for each cultivar. Samples (~2.5 kg per rice type) were transported to the laboratory in a plastic bag and stored at 4°C in the refrigerator until analyzed.
D2O and sodium formate (internal standard for NMR analysis) were purchased from Sigma-Aldrich (St. Louis, Mo, USA).
2.2. Sample preparation
The different colored sampled paddy rice with an average of 12% moisture (w/w) were de-hulled by a bench-top de-husker to obtain the rice grains. The rice grains were finely ground and passed through a 60 mesh sieve dried to constant weight under vacuum at 45°C. Rice flour (~1.0 g, n = 15 for each category) for each sample was weighed and extracted with 5.0 ml distilled water at 25°C for 1 h under oscillation. The mixtures were centrifuged at 3, 200 g for 15 min at room temperature. The supernatants were collected into a new tube, freeze-dried and dissolved in 0.6 ml buffer solution (Na2HPO4 and NaH2PO4, pH = 7.0) with sodium formate solution (0.5 mM) and 10% D2O. The dissolved solution was centrifuged again at 12, 000 g for 30 min at 4°C and transferred to a 5 mm NMR tube. Sodium formate was used as the chemical shift referencing (δ = 8.46 ppm, ppm: part per million) and as internal standard for the quantitative analysis.
2.3. NMR spectroscopy
The 1H-NMR spectra of the prepared rice samples were recorded with pulsed-field gradient WATERGATE W5 pulse sequence (for water signal suppression) on a 600 MHz spectrometer (Bruker Avance III) equipped with a 5 mm CPQCI probe. Every spectrum was acquired with a spectral width of 9014 Hz, 64 scans and 32 K complex points.
To facilitate the assignment of signals of the metabolites, several 2D-NMR experiments were conducted such as 1H-1H COSY, 1H-13C HSQC and 1H-13C HMBC. Similar with our former study, the sugar region was seriously overlapped and was too complicated to be assigned with traditional 2D-NMR method. Thus, the standard sugar agents (arabinose, galactose, fructose, glucose, melitriose, sucrose) were used for the assignment. Furthermore, the signals observed in 1D and 2D NMR spectra were also compared with the data given in several online databases for metabolomics such as HMDB (http://www.hmdb.ca/metabolites), BMRB (http://www.bmrb.wisc.edu/bmrb/), and MMCD (http://mmcd.nmrfam.wisc.edu/). The assigned chemicals were also double checked with former publications (Fan, Citation1996; Son et al., Citation2009; Song et al., Citation2016; Xiao, Dai, Liu, Wang, & Tang, Citation2008; Zotti et al., Citation2016). All the spectra were apodized (Line broadening factor, 1.0 Hz) prior to the Fourier Transform, and were manually phased and baseline corrected in Topspin (Bruker, Germany).
All the NMR spectra were automatically imported into a home-made software NMRSpec (Liu et al., Citation2017). Due to the tiny difference of the chemical shift among different spectra, the spectral alignment was completed in NMRSpec previously described for NMR spectral data analysis (Kamal et al., Citation2016).
2.4. Data analysis
2.4.1. Whole variables analysis
The whole 1H-NMR spectra were normalized with the peak intensity of sodium formate (Inner standards, δ = 8.46 ppm). At first, the nutritional compounds were identified, and verified by the comparing with the already published research, chemical shifts and 2D NMR spectra. In order to avoid to generate the over-fitted models or missing important metabolic information, the whole 1H-NMR data was divided into two subsets containing sugar (δ = 3.1 ppm – 4.4 ppm) and non-sugar compounds (δ = 0.8 ppm – 3.1 ppm, Containing major amino acids and without polyphenols which are in the range of 5.6–9.0 ppm), respectively. With the help of NMRSpec, the intensities of all peaks among these two regions were integrated and extracted (n = 82 for sugar set; n = 65 for non-sugar set) for further analysis.
In order to get a preliminary overview of the data, it is better to do a bird’s eye view of the whole variables, which was completed by running a script in MATLAB (Version 2014a). The normalization method was the same as our former research (Huo et al., Citation2017).
2.4.2. Principle component analysis
With the help of principle component analysis (PCA), the patterns of the metabolites of these two different data sets for the pigmented rice were calculated. PCA analysis was completed in SIMCA-14 (Umetrics, Umea, Sweden). PCA is an unsupervised pattern recognition analysis method and is normally applied to reveal intrinsic variation in the data set and to diagnose any existing outliers. The PCA score scatter plots were completed with the help of the first two major principle components and also validated by CV ANOVA test at p < 0.05 which was available within SIMCA. This method of getting the intrinsic variability in data is robust and has a general applicability to all such kinds of metabolomics data sets.
2.4.3. Decision tree algorithm
Traditional metabolomics methods have been widely used for researches with two different categories of discrimination; however, it is rarely used for multi-category investigations due to its limitations. Here, four different kinds of pigmented rice were studied and it was better to pursue another efficient method for the classification.
Decision tree (DT) is one of the most popular classification algorithms in the current use in data mining and machine learning. Briefly, decision tree can be defined as a recursive procedure, through splitting the original data into more homogenous subgroups using generated rules or decisions which are called as nodes (Park, Kim, Lee, Im, & Park, Citation2016; Sharma, Ghosh, & Joshi, Citation2013). The decision tree algorithm includes three different nodes (the root node, internal node, end node or target), it breaks an end node to construct a tree with certain splitting criteria (Shi, Citation2014; Tayefi et al., Citation2017). The objective of the split is to reduce the impurity of a node by creating child nodes that have a greater proportion of members from one of the nodes than the root node. The algorithm ends when it achieves the aim of maximizing a homogeneity or purity measure of the response variable in each of the obtained nodes. This procedure creates the child nodes repeatedly up to the formation of homogenous subsets with respect to the target variable. Therefore, the tree is constructed from root-node to end nodes.
In the current study, the whole data sets (n = 60, and for different kinds of pigmented rice) were randomly divided into two independent subset, the training set (n = 48) and the test set (n = 12). The training set was used to construct the DT model for the classification analysis and the test set was used as the blind samples to validate the constructed models.
2.4.4. Relative concentrations of the selected metabolites
With the help of the DT models, the major metabolic patterns of the pigmented rice were selected. In order to compare it clearly, the relative concentrations of these metabolites were calculated. The relative concentrations were calculated with the following equation:
where n is the number of the selected spectrum, Normn is the normalized signal intensity for the nth spectrum, Sign is the absolute area of selected peak in the nth spectrum, and Sig1-48 is the absolute area of the selected peaks for all the spectra.
2.5. Statistical analysis
One-way analyses of variance (ANOVA) were employed to determine the significance of differences for the selected metabolites (Liu et al., Citation2017), followed by Bonferroni post-hoc tests to examine differences among groups. The criterion for statistical significance was a probability value of 0.05. All results were presented by means ± SEM.
3. Results and discussion
3.1. Identification of the metabolites in the pigmented rice
With the help of the standard samples, on-line database searching, and 2D NMR identification, the related metabolites in the pigmented rice were identified at first. Here, steps of identification of GABA (NO: 11 in ) by 2D-NMR spectra are illustrated in . All the identified chemicals are labeled in ,). It was very easily observable that the NMR data of the rice showed the complexity due to the intensively overlapped signals and to the much higher concentration of sugar components compared to other metabolites. Thus, it was better to analyze the data separately to avoid the over-fitted models or missing important information, and the whole 1H-NMR data sets were divided into sugar region and non-sugar region.
Figure 1. A series of 2D-NMR spectra for identification of metabolite GABA. (a): COSY; (b): HSQC; (c): HMBC.
Figura 1. Serie de espectros NMR-2D para identificar los metabolitos GABA. (a): COSY; (b): HSQC; (c): HMBC.
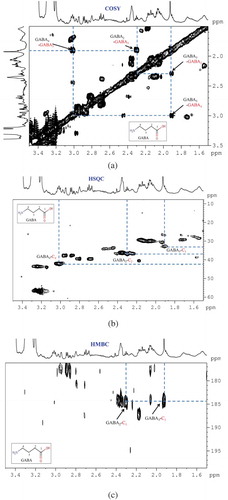
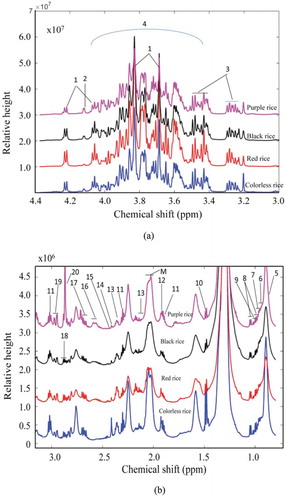
Figure 2. Assigned 1H NMR spectrum of a representative rice sample. (a): Part of assigned 1H NMR spectrum from 3.1 to 4.37 ppm representing mainly the sugar compounds. (b): Part of spectrum from 0.8 to 3.1 ppm representing mainly the non-sugar compounds. Peaks: 1: sucrose; 2: fructose; 3: glucose; 4: CHs and CH2 from carbohydrates and fatty acids; 5: lipids; 6: isoleucine; 7: leucine; 8: valine; 9: isoleucine; 10: alanine; 11: GABA; 12: acetate; 13: glutamate; 14: succinate; 15: glutamine; 16: citric acid; 17: Malic acid; 18: aspartate; 19: asparagine; 20: unknown; M: macromolecule.
Figura 2. Espectro 1H NMR asignado de una muestra de arroz representativa. (a) Parte del espectro 1H NMR asignado de 3.1–4.37 ppm, representando principalmente los compuestos de azúcar. (b): Parte del espectro de 0.8–3.1 ppm, representando principalmente los compuestos no azúcares. Picos: 1: sucrosa; 2: fructosa; 3: glucosa; 4: CHs y CH2 de carbohidratos y ácidos grasos; 5: lípidos; 6: isoleucina; 7: leucina; 8: valina; 9: isoleucina; 10: alanina; 11: GABA; 12: acetato; 13: glutamato; 14: succinato; 15: glutamina; 16: ácido cítrico; 17: ácido málico; 18: aspartato; 19: asparagina; 20: no conocido; M: macromolécula.
3.2. Whole variables analysis
In order to understand the internal differences in metabolites in rice based on different colors, a total of 48 colored rice samples (the training set) were collected and analyzed with the 1H NMR spectroscopic method. After the spectral alignment was achieved, the average spectra of metabolites varying significantly among different pigmented rice were calculated from the whole NMR data with point by point calculation method. Four different spectra from every subset were collected in the same figure (,)). For a clear visualization, all the NMR data from the data sets of sugar and non-sugar regions were also summarized in the form of heat map to estimate the variation of the metabolite level among rice samples from different kind of pigmented rice ().
Figure 3. Heat map from the whole variables analysis for the rice samples. Note: CR: Colorless rice; RR: Red rice; BR: Black rice; PR: Purple rice.
Figura 3. Mapa de calor del análisis completo de variables correspondientes a las muestras de arroz. Nota: CR: arroz incoloro; RR: arroz colorado; BR: arroz negro; PR: arroz morado.
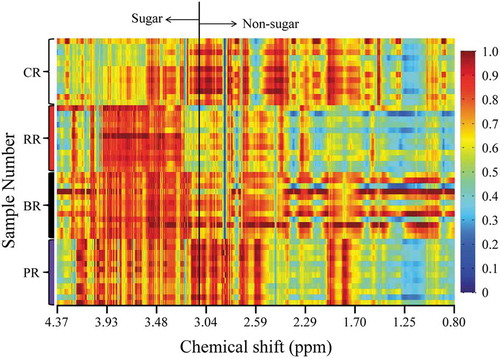
This method could not identify the significant differences for pigmented rice; however, it could be used to estimate the tendency of the concentrations of metabolites among different kinds of samples. There were apparent differences in the spectral profiles of the differently colored rice samples. For example, the colorless rice contains the lowest sugar concentration compared with the other three kinds of rice. The sugar contents of the other three pigmented rice also showed variation with each other. Furthermore, the black rice contains the highest concentrations of most of the small molecules such as amino acids. It is very hard to judge the significant difference of the metabolites among different groups, as there is no standard deviation information in these two figures. However, the readers could roughly estimate the tendency of the metabolites. In order to screen the metabolic patterns for different kinds of pigmented rice, other statistical methods were further applied in the following sections.
3.3. Principle component analysis
As an unsupervised method, the PCA does not require the group information about the data and is usually utilized to screen out the whole data set and reduce the dimensionality of a large multivariate data set.
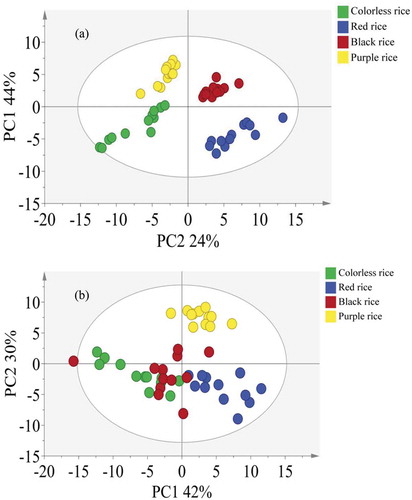
The normalized peak intensities for both sugar and non-sugar sets were imported into SIMICA for PCA analysis. The results of the PCA are scatter plotted in ) (sugar set) and 4B (non-sugar set). For the sugar data set, the first two major components accounted for 44% and 24% of the total variance and all the samples in four different kinds of rice were clustered in four different groups. Similar with the sugar data set, the results of the non-sugar data set also shown that the first two components (44% and 24%) could successfully separate the red rice from the purple rice. However, the colorless and black rice did not show clear separation from each other. These two rice groups needed to be further investigated by another supervised discriminant analysis such as decision tree. Then, these two subsets were further analyzed by a supervised method for the significant pattern selection.
Figure 4. PCA score scatter plot showing discrimination among different types of colored rice based on differences in concentrations of metabolites. (a): sugar compounds; (b): non-sugar compounds.
Figura 4. Diagrama de dispersión de puntuación PCA, que indica la discriminación entre los distintos tipos de arroz pigmentado basados en las diferencias en la concentración de metabolitos. (a): compuestos de azúcar; (b): compuestos no azúcar.
3.4. Decision tree analysis
From the overview of the global profiles of total metabolites in spectral segments representing sugar and non-sugar compounds ( and ) respectively, it was found that the profiles of the sugar and non-sugar components displayed characteristic spectral signals among the NMR spectroscopic data of different pigmented rice. The results of the PCA analysis also ascertained this observation. However, it is more meaningful to screen out the major metabolites patterns with a proper statistical method.
With the help of the DT model and the data subsets of sugar and non-sugar, two different DT classification models were successfully obtained with the training set. For the sugar data set, the pigmented rice samples were completely separated using the parameters of fructose and sucrose and the classification model was illustrated ()). Using this model, the predicted accuracies of the training set and the test set were 97.9% and 100%, which means that the selected metabolites could represent the tendency of the samples in the training set and the classification model is validated. Another data subset comprising non-sugar compounds was also analyzed separately using the similar DT analysis. The classification model is illustrated in ). Using the constructed model, the predicted accuracies of the training set and the test set were 97.9% and 100%, which means that the selected metabolites could represent the tendency of the samples in the training set and the classification model is also validated.
Figure 5. Decision Tree Analysis (DTA) showing the selected metabolites responsible for separation among different types of colored rice. (a): Sugar components; (b): Non-sugar components.
Figura 5. Análisis del árbol de decisiones (DTA), que indica los metabolitos seleccionados responsables de la separación entre los distintos tipos de arroz pigmentado. (a): Componentes de azúcar; (b): Componentes no azúcar.
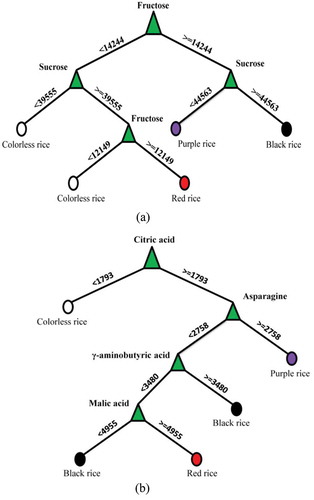
For the sugar data set, the major differences of fructose concentration could separate the colored rice into two sub-groups, purple rice and black rice were clustered together and red rice and colorless rice were clustered together. The results are also verified in ), and the collected black and purple rice contained higher concentration of fructose as compared to the rest of the pigmented rice. Furthermore, the concentration of sucrose in the black rice was higher than that in the purple rice () and )). However, the classification of the colorless rice and red rice was not so simple. They could be completely separated with the help of both sucrose and fructose (Left branch in )). Among these two sugar components, fructose was the major discriminating metabolite among colorless and red rice where it showed an increased amount in red rice as compared with the colorless rice. For the non-sugar data set, the classification model showed that citric acid, malic acid, asparagines and γ-aminobutyric acid (GABA) were the major discriminating metabolites among different pigmented rice. At first, the metabolite citric acid was found in the lowest concentration in the group of colorless rice comparing with the other three groups. Secondly, the purple rice contained the highest concentration of asparagine comparing with the rest of the samples. The rest of the groups such as black rice and red rice were clustered together. However, the separation based on these two metabolites was a little bit difficult. Most of the samples have higher malic acid concentration compared with the black samples.
Figure 6. Relative concentrations of metabolites in different pigmented rice given in standard error bar graphs (Ave. ± Std). (a): Sugar components; (b) Non-sugar components.
Figura 6. Concentraciones relativas de metabolitos en los distintos arroces pigmentados, presentadas en gráficos de barras del error estándar (Ave. ± Std). (a): Componentes de azúcar; (b) Componentes de no azúcar.
3.5. Relative concentration of the selected metabolites
With the help of the DT classification models, the major metabolic patterns of the sugar and non-sugar components were obtained for different kinds of the pigmented rice in the current study. Two different kinds of sugars (sucrose and fructose) and four non-sugars (citric acid, asparagine, GABA and malic acid) were selected. In order to compare them in detail, the relative concentrations of these six metabolites were calculated and the results are illustrated in ,). Then, the one-way ANOVA (p < 0.05) was further applied to investigate the differences among these different kinds of rice.
For the sugar components, there was a significant difference for sucrose in all kinds of pigmented rice ()). The purple rice has the highest concentrations compared with the other three rice types. Furthermore, the concentrations of fructose in red and black rice were the highest. Whereas the purple rice contained the lowest concentration of fructose compared with other three colored rice. For the non-sugar data set metabolites with significant variance were also selected. As the signals were highly overlapped, thus only the major components were considered mainly responsible for the major patterns. Among these metabolites, the purple rice contained the highest selected metabolites (citric acid and asparagine) compared with the other three kinds of rice. Furthermore, citric acid was present in lowest concentration in colorless rice and its concentration varied among different kinds of colored rice. Red rice exhibited the lowest GABA concentration compared with the other three kinds of rice.
Among these selected metabolites, sucrose being the major sugar in rice, accounts for approximately 90% of the total sugar contents. In previous reports, its content in black rice was found to be slightly higher compared to red rice, even increased levels were found in the different non-colored indica and japonica subspecies representing a marked natural variability for this sugar in rice. No differences in total carbohydrates have been reported between red and black rice (Frank et al., Citation2012; Sompong, Siebenhandl-Ehn, Linsberger-Martin, & Berghofer, Citation2011).
Frank et al. found that black rice contained predominantly higher contents of acids (malic acid and citric acid), biogenic amines GABA as compared to red rice however their contents varied considerably (Frank et al., Citation2012). GABA is a four carbon non-protein amino acid which exists widely in both plants and animals. It is produced primarily by the decarboxylation of L-glutamic acid, catalyzed by the enzyme glutamate decarboxylase, and is a major inhibitory neurotransmitter in the cerebrospinal fluid of mammals. Some health benefits of GABA have been reported. Rice grains rich in gamma-aminobutyric acid (GABA) are gaining popularity, especially in the health food market (Karladeea & Suriyonga, Citation2012). The application of the germination condition will be promising for the development of GABA-rich products and the promotion of the consumption of traditional rice (Ding et al., Citation2016).
Asparagine along with glutamine is the major form of nitrogen in phloem sap of rice plants. It is possibly synthesized by the reaction of glutamine-dependent and/or ammonium-dependent asparagine synthetase in plants. Compared to the recent progress on glutamine metabolism, much less is known on asparagine metabolism in rice plants (Nakano, Suzuki, Hayakawa, & Yamaya, Citation2000).
4. Conclusion
Briefly, a combination of 1H NMR-based fingerprinting and traditional decision tree analysis (DTA) proved an excellent analytical tool for the profiling and differentiation of different pigmented rice grains. Different colored rice grains can be differentiated easily by simple, robust and rapid methods using 1H-NMR spectroscopy and DTA method by extracting important metabolites responsible for the discrimination. Six important metabolites covering sugar like sucrose, fructose as well as other nutritional compounds like γ-amino butyrate, asparagines, malic acid and citric acid was found to be the most important chemical indicators responsible for discrimination of the differently colored rice samples. Thus, the present metabolic profiling should serve as a valuable tool for quality assessment of colored rice providing a nontargeted analysis. This study provides a suitable approach to screen or assess the nutrition and quality characteristics of foods varieties, and it is meaningful for the consumers’ health. This methodology could also be extended to the nutraceutical analysis and herbs quality control or other aspects. Furthermore, the results should support the commercial exploitation and the integration of pigmented rice in the human diet as a healthy and valuable cereals.
Disclosure statement
No potential conflict of interest was reported by the authors.
Additional information
Funding
References
- Cevallos-Cevallos, J. M., Reyes-De-Corcuera, J. I., Etxeberria, E., Danyluk, M. D., & Rodrick, G. E. (2009). Metabolomic analysis in food science: A review. Trends in Food Science & Technology, 20(11), 557–566.
- Davids, W. (2008). Metabolomics: Applications to food science and nutrition research. Trends in Food Science & Technology, 19(9), 482–493.
- Deng, G. F., Xu, X. R., Zhang, Y., Li, D., Gan, R. Y., & Li, H. B. (2013). Phenolic compounds and bioactivities of pigmented rice. Critical Reviews in Food Science & Nutrition, 53(3), 296–306.
- Ding, J., Yang, T., Feng, H., Dong, M., Slavin, M., Xiong, S., & Zhao, S. (2016). Enhancing contents of γ-Aminobutyric acid (GABA) and other micronutrients in dehulled rice during germination under normoxic and hypoxic conditions. Journal of Agricultural & Food Chemistry, 64(5), 1094.
- Fan, W. M. T. (1996). Metabolite profiling by one- and two-dimensional NMR analysis of complex mixtures. Progress in Nuclear Magnetic Resonance Spectroscopy, 28, 161–219.
- Francini, A., Romeo, S., Cifelli, M., Gori, D., Domenici, V., & Sebastiani, L. (2017). 1H NMR and PCA-based analysis revealed variety dependent changes in phenolic contents of apple fruit after drying. Food Chemistry, 221, 1206–1213.
- Frank, T., Reichardt, B., Shu, Q., & Engel, K. H. (2012). Metabolite profiling of colored rice (Oryza sativa L.) grains. Journal of Cereal Science, 55(2), 112–119.
- Hill, C. B., Dias, D. A., & Roessner, U. (2016). Current and emerging applications of metabolomics in the field of agricultural biotechnology. Chichester: John Wiley & Sons Ltd.
- Huo, Y., Kamal, G. M., Wang, J., Liu, H., Zhang, G., Hu, Z., … Du, H. (2017). 1H NMR-based metabolomics for discrimination of rice from different geographical origins of China. Journal of Cereal Science, 76, 243–252.
- Jin, X.-M., Jun, S., Mao, H.-P., Jiang, S.-Y., Qing-Lin, L., & Chen, -X.-X. (2015). Discrimination of rice varieties using LS-SVM classification algorithms and hyperspectral data. Advance Journal of Food Science and Technology, 7(9), 691–696.
- Kamal, G. M., Yuan, B., Hussain, A. I., Wang, J., Jiang, B., Zhang, X., & Liu, M. L. (2016). C-13-NMR-based metabolomic profiling of typical Asian soy sauces. Molecules, 21(9). doi:10.3390/molecules21091168
- Kang, M. K., Choi, J. N., Kim, J., Kim, J. K., Lang, G. Y., Sang, J. L., … Lee, C. H. (2010). Metabolomics analysis reveals the compositional differences of shade grown tea (Camellia sinensis L.). Journal of Agricultural and Food Chemistry, 58(1), 418–426.
- Karladeea, D., & Suriyonga, S. (2012). γ-Aminobutyric acid (GABA) content in different varieties of brown rice during germination. ScienceAsia, 38(13):13–17.
- Keymanesh, K., Darvishi, M. H., & Sardari, S. (2009). Metabolome comparison of transgenic and non-transgenic rice by statistical analysis of FTIR and NMR spectra. Rice Science, 16(2), 119–123.
- Lee, H. H., Kim, H. Y., Koh, H. J., & Ryu, S. N. (2006). Varietal difference of chemical composition in pigmented rice varieties. Korean Journal of Crop Science, 51, 113–118.
- Liu, T. T., He, Z. G., Tian, X. B., Kamal, G. M., Li, Z. X., Liu, Z. Y., … Xiang, H. B. (2017). Specific patterns of spinal metabolites underlying alpha-Me-5-HT-evoked pruritus compared with histamine and capsaicin assessed by proton nuclear magnetic resonance spectroscopy. Biochimica Et Biophysica Acta-Molecular Basis of Disease, 1863(6), 1222–1230.
- Liu, Y., Cheng, J., Liu, H. L., Deng, Y. H., Wang, J., & Xu, F. Q. (2017). NMRSpec: An integrated software package for processing and analyzing one dimensional nuclear magnetic resonance spectra. Chemometrics and Intelligent Laboratory Systems, 162, 142–148.
- Masoum, S., Malabat, C., Jalali-Heravi, M., Guillou, C., Rezzi, S., & Rutledge, D. N. (2007). Application of support vector machines to H-1 NMR data of fish oils: Methodology for the confirmation of wild and farmed salmon and their origins. Analytical and Bioanalytical Chemistry, 387(4), 1499–1510.
- Molina-Calle, M., De Medina, V. S., Priego-Capote, F., & De Castro, M. D. L. (2017). Establishing compositional differences between fresh and black garlic by a metabolomics approach based on LC–QTOF MS/MS analysis. Journal of Food Composition and Analysis, 62, 155–163.
- Monakhova, Y. B., Rutledge, D. N., Roßmann, A., Waiblinger, H. U., Mahler, M., Ilse, M., … Lachenmeier, D. W. (2014). Determination of rice type by 1H NMR spectroscopy in combination with different chemometric tools. Journal of Chemometrics, 28(2), 83–92.
- Muthayya, S., Sugimoto, J. D., Montgomery, S., & Maberly, G. F. (2014). An overview of global rice production, supply, trade, and consumption. Annals of the New York Academy of Sciences, 1324(1), 7.
- Nakano, K., Suzuki, T., Hayakawa, T., & Yamaya, T. (2000). Organ and cellular localization of asparagine synthetase in rice plants. Plant & Cell Physiology, 41(7), 874–880.
- Park, M. S., Kim, M., Lee, M. I., Im, J., & Park, S. (2016). Detection of tropical cyclone genesis via quantitative satellite ocean surface wind pattern and intensity analyses using decision trees. Remote Sensing of Environment, 183, 205–214.
- Pereira, G. E., Gaudillere, J. P., Van Leeuwen, C., Hilbert, G., Lavialle, O., Maucourt, M., … Rolin, D. (2005). H-1 NMR and chemometrics to characterize mature grape berries in four wine-growing areas in Bordeaux, France. Journal of Agricultural and Food Chemistry, 53(16), 6382–6389.
- Sharma, R., Ghosh, A., & Joshi, P. K. (2013). Decision tree approach for classification of remotely sensed satellite data using open source support. Journal of Earth System Science, 122(5), 1237–1247.
- Shi, G. (2014). Chapter 5 - decision trees. In G. R. Shi (Ed.), Data mining and knowledge discovery for geoscientists (pp. 111–138). Oxford, UK: Elsevier.
- Shipp, J., & Abdelaal, E. M. (2010). Food applications and physiological effects of anthocyanins as functional food ingredients. Open Food Science Journal, 4(1), 7–22. (16).
- Soininen, T. H., Jukarainen, N., Auriola, S. O. K., Julkunen-Tiitto, R., Karjalainen, R., & Vepsäläinen, J. J. (2014). Quantitative metabolite profiling of edible onion species by NMR and HPLC–MS. Food Chemistry, 165(20), 499–505.
- Sompong, R., Siebenhandl-Ehn, S., Linsberger-Martin, G., & Berghofer, E.,. (2011). Physiochemical and antioxidative properties of red and black rice varieties from Thailand, China and Sri Lanka. Food Chemistry, 124, 132–140.
- Son, H. S., Hwang, G. S., Kim, K. M., Ahn, H. J., Park, W. M., Van Den Berg, F., … Lee, C. H. (2009). Metabolomic studies on geographical grapes and their wines using H-1 NMR analysis coupled with multivariate statistics. Journal of Agricultural and Food Chemistry, 57(4), 1481–1490.
- Song, E. H., Kim, H. J., Jeong, J., Chung, H. J., Kim, H. Y., Bang, E., & Hong, Y. S. (2016). A H-1 HR-MAS NMR-based metabolomic study for metabolic characterization of rice grain from various Oryza sativa L. cultivars. Journal of Agricultural and Food Chemistry, 64(15), 3009–3016.
- Tayefi, M., Esmaeili, H., Saberi Karimian, M., Amirabadi Zadeh, A., Ebrahimi, M., Safarian, M., … Ghayour-Mobarhan, M. (2017). The application of a decision tree to establish the parameters associated with hypertension. Computer Methods and Programs in Biomedicine, 139, 83–91.
- Tian, S., Nakamura, K., & Kayahara, H. (2004). Analysis of phenolic compounds in white rice, brown rice, and germinated brown rice. Journal of Agricultural and Food Chemistry, 52(15), 4808–4813.
- Vichapong, J., Sookserm, M., Srijesdaruk, V., Swatsitang, P., & Srijaranai, S. (2010). High performance liquid chromatographic analysis of phenolic compounds and their antioxidant activities in rice varieties. LWT - Food Science and Technology, 43(9), 1325–1330.
- Wang, J., Zeng, H.-L., Du, H., Liu, Z., Cheng, J., Liu, T., … Xu, F. (2018). Evaluation of metabolites extraction strategies for identifying different brain regions and their relationship with alcohol preference and gender difference using NMR metabolomics. Talanta, 179, 369–376.
- Xiao, C. N., Dai, H., Liu, H. B., Wang, Y. L., & Tang, H. R. (2008). Revealing the metabonomic variation of rosemary extracts using H-1 NMR spectroscopy and multivariate data analysis. Journal of Agricultural and Food Chemistry, 56(21), 10142–10153.
- Xu, W. P., Song, Q. S., Li, D. X., & Wan, X. C. (2012). Discrimination of the production season of Chinese green tea by chemical analysis in combination with supervised pattern recognition. Journal of Agricultural and Food Chemistry, 60(28), 7064–7070.
- Yoshida, H., Tomiyama, Y., & Mizushina, Y. (2010). Lipid components, fatty acids and triacylglycerol molecular species of black and red rices. Food Chemistry, 123(2), 210–215.
- Zhou, Z. K., Robards, K., Helliwell, S., & Blanchard, C. (2004). The distribution of phenolic acids in rice. Food Chemistry, 87(3), 401–406.
- Zotti, M., De Pascali, S. A., Del Coco, L., Migoni, D., Carrozzo, L., Mancinelli, G., & Fanizzi, F. P. (2016). H-1 NMR metabolomic profiling of the blue crab (Callinectes sapidus) from the Adriatic Sea (SE Italy): A comparison with warty crab (Eriphia verrucosa), and edible crab (Cancer pagurus). Food Chemistry, 196, 601–609.