
 ?Mathematical formulae have been encoded as MathML and are displayed in this HTML version using MathJax in order to improve their display. Uncheck the box to turn MathJax off. This feature requires Javascript. Click on a formula to zoom.
ABSTRACT
Tangerine (Citrus reticulata. CRP) and grapefruit (Citrus paradisi. CPP) pectins obtained by ultrasound-assisted extraction (UAE) and conventional extraction (CE) using citric acid were characterized to establish their potential uses as an alternative source of commercial pectin. The pectins obtained by UAE and CE presented a pseudoplastic fluid characteristic with shear thinning behavior, a high esterification degree (CRP 82.30–71.81% and CPP 84.25–72.15%) and were of commercial quality based on galacturonic acid content (CRP 76.03% and CPP 76.03–71.01%). CPP presented greater viscosimetric molecular weight than CRP. Meanwhile, CRP presented greater polyphenol and protein content with respect CPP. The functional properties were influenced by citrus source and extraction method. UAE favored greater yields in a shorter time (CPP: 26.05%, 30 min; CRP: 13.46%, 15 min) compared to CE. UAE combined with the use of citric acid offers an effective alternative for obtaining high-quality pectins with lower polluting effluent, time and energy requirements.
RESUMEN
Pectinas de mandarina (Citrus reticulata, PCR) y pomelo (Citrus paradisi, PCP) obtenidas vía extracción asistida por ultrasonido (EAU) y convencional (EC) con ácido cítrico fueron caracterizadas para establecer su potencial uso como una fuente alternativa de pectina comercial. Las pectinas obtenidas por EAU y EC presentaron características de fluido pseudoplástico con un comportamiento de adelgazamiento por cizalladura, alto grado de esterificación (CRP 82.30-71.81% and CPP 84.25-72.15%), y calidad comercial por el contenido de ácido galacturónico (CRP 76.03% and CPP 76.03-71.01%). PCP presentaron mayor peso molecular viscosimétrico comparado a PCR. Mientras PCR presentaron mayor contenido de polifenoles, y proteínas con respecto a PCP. Las propiedades funcionales fueron influenciadas por la fuente cítrica y el método de extracción. La EAU favoreció los mayores rendimientos a menor tiempo: PCP (26.05±0.49%, 30 min) y PCR (13.46±1.79%, 15 min) comparada con EC. La EAU representa una alternativa eficaz para la obtención de pectinas de alta calidad, con menores efluentes contaminantes, tiempo y energía.
1. Introduction
Globally, citrus agribusiness is responsible for 33% of fresh and 11% of processed grapefruit (Citrus paradisi) and tangerine (Citrus reticulata) production. In Mexico, 42 Mt of tangerine and 86 Mt of grapefruit production are industrialized (FAO, Citation2017) and the pomace from processing comprises a source of polluting waste (approximately 64 Mt), but one which has the potential for technological exploitation for obtaining added-value biomolecules such as secondary metabolites and pectins that has not been commercially used.
Pectin is a soluble and indigestible heteropolysaccharide with a high molecular weight. It is anionic, biocompatible, non-toxic, and biodegradable (Chen et al., Citation2015). It is present in the primary cell wall and middle lamella of fruits and vegetables, comprising 35–40% (d.b.) (Adetunji, Adekunle, Orsat, & Raghavan, Citation2017). It is very attractive, given its bioactive and techno-functional potential (Naqash, Masoodi, Rather, Wani, & Gani, Citation2017). It is used as a gelling agent, stabilizer, and thickener due to its ability to form aqueous gels and modify texture in different food systems such as jams and jellies, confectionery, concentrated fruit drinks and fermented dairy products (Naqash et al., Citation2017; Thakur, Singh, Handa, & Rao, Citation1997). The technological functionality of pectin is directly associated with its physicochemical parameters, most importantly the degree of methyl esterification, which denotes the percentage of methylated atoms at C-6 of the galacturonic acid (GalA) residues of its main chain (Einhorn-Stoll, Kastner, & Drusch, Citation2014; Wang et al., Citation2015). This parameter is associated with water solubility, gelling power, and sorption properties (Bochek, Zabivalova, & Petropavlovskii, Citation2001). Another parameter is GalA content, indicative of pectin purity and commercial quality (Pereira et al., Citation2016). Meanwhile, viscosity is related to the hydrodynamic volume of pectin and is dependent on size and molecular weight (Cuevas-Bernardino, Lobato-Calleros, Román-Guerrero, Alvarez-Ramirez, & Vernon-Carter, Citation2016; Migliori, Gabriele, Checchetti, & Battipede, Citation2010). In turn, molecular weight is dependent on the complex structure formed between orderly regions of linear blocks of GalA (homogalacturonans) and ramified regions with different neutral sugars (rhamnogalacturonans I and II) (J. Chen et al., Citation2015). These parameters and others related to physicochemical, structural, functional, and rheological properties vary based on the source and the methods of extracting and drying the heteropolysaccharide.
Conventional extraction of pectin (CE) is based on the use of dilute mineral acids (pH 0.5–3.0), high temperatures (60–100°C), prolonged times (30–240 min) (Jafari, Khodaiyan, Kiani, & Hosseini, Citation2017; Koubala et al., Citation2008; Yapo, Robert, Etienne, Wathelet, & Paquot, Citation2007) and generates a considerable amount of corrosive effluents. All of these factors impact the properties of the extracted material, the efficiency of the process and the environment (Tiwari, Citation2015). As a result, emerging green chemistry technologies have been proposed as alternatives for recovering valuable biomolecules from plant tissues, such as ultrasound-assisted extraction (UAE), microwave-assisted extraction (MAE), accelerated solvent extraction (ASE), and supercritical fluid extraction (SFE) (Adetunji et al., Citation2017; González-Centeno et al., Citation2014), among others. Likewise, the use of organic acids has been considered for extraction to replace mineral acids in order to prevent degradation effects on biomolecule structure (Kermani et al., Citation2014) and to reduce the environmental impact.
UAE is characterized by the use of acoustic energy (cavitation) for cellular disruption and mass transfer from the solid plant matrix to the liquid medium (solvent) (Wang et al., Citation2015). A number of studies highlight the importance of applying this innovative technology, with multiple benefits associated with reduced extraction time, the use of a smaller volume of organic solvent, greater yields, and improved quality characteristics of the extracted material (Medina-Torres et al., Citation2017; Naqash et al., Citation2017). Pectin extraction using ultrasound technology has been reported for pea pods (Safaryan, Ganjloo, Bimakr, & Zarringhalami, Citation2016), passion fruit peel (Freitas de Oliveira et al., Citation2016), nopal cladodes (Bayar et al., Citation2017), and tomato wastes (Grassino et al., Citation2016). In all cases, it represents a promising alternative to the conventional process due to its high efficiency.
The use of underused sources for obtaining pectin, as well as the application of green technologies (UAE with lower outpower intensity of ultrasound using citric acid as the extracting agent), that simply efficiently the process in an eco-friendly way, will favor the potential exploitation of citrus waste. The aim of this study was asses how pectin components vary in relation to the citrus species and considers the influence of extraction method on the main physical and chemical parameters of pectins obtained from C. reticulata and C. paradisi agribusiness waste. To do so, conventional extractions were carried out in parallel in order to compare yields and structural, functional and rheological properties.
2. Materials and methods
Grapefruit (Citrus paradisi var. Star ruby) and Tangerine (Citrus reticulata var. Tangerine) agribusiness wastes were collected from the Akil juice factory in the municipality of Oxkutzcab, Yucatan, Mexico. Reagents for the chemical assays and standards were supplied by Sigma-Aldrich (Sigma Chemical Co., St. MO, USA), Merck (Darmstadt, Germany), and Baker (Phillipsburg, NJ, USA). All other chemicals were reagent grade.
3. Obtaining citrus flours
The citrus agribusiness waste was collected, dried for 24 h at 60°C, pulverized in a high impact mill (Pulvex 200 model, Mexico State, Mexico), and screened (˂297 µm) according to reference for particle size distribution range of milled tomato waste (Grassino et al., Citation2016). The flours were proximately characterized (AOAC, Citation1997) and stored until subsequent use in hermetically sealed containers at −5°C.
4. Pectin extraction by UAE and CE
Native pectins were extracted separately for each citrus source. UAE (W. Wang et al., Citation2015) with modifications and CE (Ayora-Talavera et al., Citation2017) were the techniques used. UAE was performed on dispersions of citrus flour in water acidified to pH 2.5 with C6H8O7 at a ratio of 1:30 (w/v). Extraction was conducted under specific conditions: 130 W, 20 kHz, 80°C, and 90% amplitude (GEX130PB ultrasonic-processor; CV188 ultrasonic probe, New Jersey, USA). Ultrasonic pulses with a duration of 5 min on/2 min off were used to keep the temperature constant. The sonication time was 30 min for C. paradisi and 15 min for C. reticulata in accordance with preliminary assays based on yield. At the end of sonication, the dispersion was cooled to 25°C, the pectin was precipitated with ethanol (96%) at a 2:1 ratio (v/v) and centrifuged at 4,500 rpm for 20 min at 4°C. The pellet was washed with ethanol (70%) repeatedly, dried at 40°C for 12 h in a convection oven to constant weight (7–10% humidity), and finally pulverized, screened (˂ 0.297 µm) and stored in vacuum desiccators.
CE was performed on dispersions of flour in citric acid solution at a ratio of 1:30 (w/v). The dispersion was stirred mechanically at 80°C for 90 min. Finally, the pectin was recovered, washed, dried and stored under the same conditions used for UAE.
The pectin samples were identified with codes: pectin of C. paradisi extracted by ultrasound (PPU), pectin of C. paradisi extracted conventionally (PPC), pectin of C. reticulata extracted by ultrasound (PRU), pectin of C. reticulata extracted conventionally (PRC), and commercial pectin (CP).
5. Physicochemical characterization of citrus pectins
The pectins were characterized in terms of their crude protein, inorganic residues, and moisture in accordance with AOAC official methods (AOAC, Citation1997). pH was determined directly by means of a calibrated potentiometer (HI-3222, Hanna Instruments, USA) and water activity using a Lab-Swift-aw (Novasina AG, Switzerland). Free acidity was determined by potentiometric titration expressing the result as milliequivalents (mEq) of free carboxyl (Ayora-Talavera et al., Citation2017). Total polyphenol content was determined by spectrophotometry at 750 nm using the Folin & Ciocalteau (Citation1927) method, and the results were expressed as gallic acid equivalents (GAE) (Vasco, Ruales, & Kamal-Eldin, Citation2008).
Color attributes (L *, a *, and b *) were measured with a spectrophotometer (Mini Scan EZ Hunterlab, 4500 L, Virginia, USA) (Montoya-López, Giraldo-Giraldo, & Lucas-Aguirre, Citation2012). Chroma (C*) and hue angle (h°) were calculated according to equations 1 and 2.
6. Pectin extraction yield
The extraction yield (Y) was calculated on a dry basis (d.b.) based on the mass of pectin extracted from the citrus flour (Freitas de Oliveira et al., Citation2016) (Equation (3)).
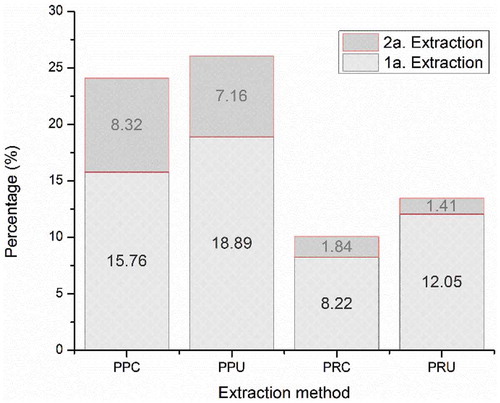
To favor greater UAE and CE yield, the citrus flours were subjected to two successive extractions under the conditions previously stated for each method, and the quantity of polysaccharide obtained in both extractions was expressed as total pectin.
7. Galacturonic acid (GalA) content
GalA content was determined by spectrophotometry at 520 nm by means of the alkaline m-hydroxyphenyl method (Blumenkrantz & Asboe-Hansen, Citation1973). Quantification was performed by means of a calibration curve using D-galacturonic acid monohydrate as standard.
8. Degree of esterification and methoxylation percentage
Degree of esterification (%DE) was estimated by potentiometric titration (Bochek et al., Citation2001; Liu, Cao, Huang, Cai, & Yao, Citation2010). The methoxyl percentage (% MeO) was determined based on Equation 4, where 100% of esterified pectin corresponds to 16.32% of the total methoxyl groups (Zouambia, Youcef Ettoumi, Krea, & Moulai-Mostefa, Citation2017).
9. Fourier-transform infrared spectroscopy (FTIR)
The Fourier-transform infrared (FTIR) spectrum was determined (Posé, Kirby, Mercado, Morris, & Quesada, Citation2012). A Bruker spectrophotometer (Tensor II model with OPUS software Version 7.5) was used with attenuated total reflectance (ATR). Samples were scanned 25 times over a spectral range of 4000–500 cm−1 at a resolution of 4 cm−1.
10. Intrinsic viscosity and viscosimetric molecular weight
The intrinsic viscosity [η] was determined (Cuevas-Bernardino et al., Citation2016) with modifications. Standard 0.1% pectin solutions were prepared in NaCl (100 mM) and stored at 5°C for 24 h until complete hydration. The solutions were then diluted (0.025–0.2 dL/g), stirred in a vortexer, equilibrated at 25°C for 30 min, and analyzed rheologically (DHR2, TA Instruments, Delaware, USA) using a measurement system of concentric cylinders and a geometry (No. 105959) at constant speed (63.10 s1) and temperature (30°C). The relative (ηrel), specific (η sp) and reduced (η red) viscosities were calculated from the following equations:
where η1 is the viscosity of the pectin solution (Pa.s), η0 is the viscosity of the solvent (100 mM NaCl solution) and C is the native pectin concentration. Intrinsic viscosity [η] was calculated by linearly extrapolating the reduced viscosity to zero concentration (). Viscometric molecular weight [Mw] was estimated from intrinsic viscosity [η] by means of the Mark Houwink-Sakurada equation (Migliori et al., Citation2010) (Equation (8)).
where K (L g− 1) and a are empirical constants that depend on the temperature and solvent-polymer system, and correspond to values of 99.55 × 10⁻⁴ and 0.73.
11. Steady shear measurements
The flow properties of pectin solutions (2% w/v) were characterized by a Discovery HR-2 rheometer (TA Instruments, New Castle, DE, USA) equipped with a plate-plate geometry (diameter = 40 mm and a gap = 1000 µm) at 25°C. The apparent viscosity as a function of the shear rate was determined in the range from 0.1 to 1000 s−1.
12. Solubility
Solubility was evaluated (Joslyn, Citation1980). Pectin samples were moistened with drops of ethanol (96%) and solubilized in distilled water (20 mL, 0.5% w/v). The dispersions were heated to 90°C for 15 min and then 5 mL aliquots were collected (soluble fraction). Subsequently, 1 mL of NaOH was added and they were mixed and heated to 90°C for 15 min to observe the changes in the alkaline solution.
13. Water holding capacity (WHC)
WHC was determined (Bayar et al., Citation2017). Pectin samples in distilled water (10 mL, 1% w/v) were deposited in (previously weighed) centrifuge tubes and stirred on a vortex mixer every 15 min during incubation at 25°C for 1 h. They were then centrifuged at 4,500 rpm for 15 min at 4°C, and the precipitate was recovered after draining on filter paper for 30 min. The capacity was expressed as the quantity in g of water retained per g of native pectin.
14. Oil holding capacity (OHC)
OHC was determined (Gan, Abdul Manaf, & Latiff, Citation2010). Pectin samples in distilled water (1 mL, 1% w/v) were deposited in (previously weighed) centrifuge tubes and mixed with canola oil (1:0 w/v). The solution was maintained under constant stirring for 5 h at 25°C. They were then centrifuged at 4,500 rpm for 15 min at 4°C, and the oil was recovered after draining on filter paper for 30 min. The capacity was expressed as the quantity in g of oil retained per g of native pectin.
15. Statistical analyses
All experiments and analyses were performed in triplicate. Values were expressed as mean ± standard deviation. Statistically significant differences between samples were determined by means of analysis of variance (ANOVA). Tukey’s test was used to compare mean values. Statistical analyses were conducted using the Statgraphics Centurion XVI.I. software (Statistical Graphics Corp., Manugistics, Inc., Cambridge, MA, USA).
16. Results and discussion
16.1. Physicochemical characterization of citrus flours
C. paradisi and C. reticulata agribusiness waste flours represent a source of macromolecules with potential for technological exploitation, as indicated by the crude protein content of 5.19 ± 0.03 and 7.25 ± 0.50 g 100 g−1, crude fiber content of 11.13 ± 0.91 and 9.99 ± 0.16 g 100 g−1, and nitrogen‐free extract of 74.13 ± 2.63 and 66.26 ± 0.89 g 100 g−1, respectively. The differences in the content of the main biomolecules present in flours can be caused by a number of factors, such as plant source, variety, tissue and maturity (Nelson, Smith, & Wiles, Citation1977). Both flours were within the limits of the normal composition, indicating their physicochemical stability, as suggested by the moisture content (4.2 ± 0.46–7.08 ± 0.37 g 100 g−1) (NOM-247-SSA1, Citation2008), Aw (data not shown) and pH (4.17 ± 0.01–4.42 ± 0.02).
17. Pectin extraction by UAE and CE
Pectin extraction is a multistage physicochemical process in which hydrolysis and solubilization of the heteropolysaccharides present in the plant tissue occur sequentially (Begum, Aziz, Uddin, & Yusof, Citation2014). The greatest yield occurred for pectins obtained by UAE. Cellular disruption based on the formation of microscopic cavities that expand and implode on a product's surface causes impingement by micro-jets that results in surface peeling, erosion and particle breakdown. This effect provides of the reduction in particle size and exposure of new surfaces further increasing mass transfer and yield (Chemat et al., Citation2017; Vilkhu, Mawson, Simons, & Bates, Citation2008), meaning the yields of PPU (26.05 ± 0.49%) and PRU (13.46 ± 1.79%) were significantly different (p < 0.05) to those obtained by CE. They were found to be in the range reported for commercial pectins originating from citrus peels (20–30%) and apple pomace (10–15%) (Kermani et al., Citation2014). The synergistic effect of the extraction system conditions with the ultrasonic probe (130 W, 20 kHz, 90% amplitude) and the temperature (80°C) likely accelerated the diffusion of the solvent into the plant matrix with the reduction in the viscosity of the extractant solution and the increase in vapor pressure and cavitation (Chemat, Zill-e-Huma, & Khan, Citation2011; Wang et al., Citation2015). Additionally, implosion of cavitation bubbles in a liquid media leads to macro-turbulences, high-velocity inter-particle collisions, perturbation in micro-porous particles of the biomass and to a micromixing (Chemat et al., Citation2017; Vilkhu et al., Citation2008). These parameters (ultrasonic power and temperature) were consistent with those reported for greater polysaccharide yields from extractions using ultrasonic techniques (Grassino et al., Citation2016; Safaryan et al., Citation2016) with the physical effects dominate (Chandrapala, Oliver, Kentish, & Ashokkumar, Citation2013). The differences in sonication time for each citrus species were based on the constant increase in yield until reaching the optimum time (30 min for C. paradisi and 15 min for C. reticulata). This phenomenon is likely due to the swelling and rehydration of each plant matrix during the earlier period of extraction as well as the asymmetric collapse of surface microbubbles, facilitate the basic mechanisms of extraction: desorption and diffusion of the solute (Chemat et al., Citation2017; Vilkhu et al., Citation2008; Wang, Wu, Dai, Chen, & Shao, Citation2012). Finally, ultrasound extraction act through different independent or combined mechanisms between fragmentation, erosion, capillarity, detexturation, and sonoporation (Chemat et al., Citation2017).
With regard to CE, the greatest pectin yield found was for PPC (24.08 ± 0.95%), which was greater than has been reported for this species (19.16%) (Bagherian, Zokaee Ashtiani, Fouladitajar, & Mohtashamy, Citation2011), as well as for pectins from lime (15%) (Sánchez-Aldana, Aguilar, Nevarez-Moorillon, & Contreras-Esquivel, Citation2013) and grapefruit (17.75%) (Venzon et al., Citation2015) extracted under similar conditions. PRC presented similar values (10.06 ± 0.38%) to those found in the literature (9.4–10.5%) (Chang-Won, Do-Youn, & Chan-Wha, Citation2003). The use of citric acid as an extraction agent favored higher yields and quality requirements for food-grade products, and also contributes to reducing environmental risks associated with treating chemical effluents (FEEDAP, Citation2015). The application of sequential extractions favored a substantial increase in native pectin for both methods and citrus species ().
Figure 1. Native pectin extraction yields from C. paradisi and C. reticulata obtained by CE and UAE. a–e Different letters between columns indicate significant differences (p < 0.05). Data are the means of three determinations. Abbreviations: PPC, pectins from C. paradisi extracted conventionally; PPU, pectins from C. paradisi extracted by ultrasound; PRC, pectins from C. reticulata extracted conventionally; PRU, pectins from C. reticulata extracted by ultrasound.
Figura 1. Rendimientos de la extracción de pectinas nativas de C. paradisi y C. reticulata obtenidas por EC y EAU. a-e Letras diferentes entre columnas indican diferencia significativa (p < 0.05). Los datos son la media de tres determinaciones. Las abreviaturas: PPC, pectinas de C. paradisi extractada convencionalmente; PPU, pectinas de C. paradisi extractada por ultrasonido; PRC, pectinas de C. reticulata extractada convencionalmente; PRU, pectinas de C. reticulata extractada por ultrasonido.
18. Physicochemical characterization of citrus pectins
The physicochemical properties of the pectins obtained by UAE and CE were influenced by the source and extraction method. The greater inorganic residue content in all pectins extracted (p < 0.05) compared to CP was independent of the extraction method and can be associated with greater solubility (Rolin, Citation2002) and gelling power (Begum et al., Citation2014). This probably influenced the solubilization of the minerals during the precipitation operations and washes with the water: ethanol solutions (Pereira et al., Citation2016). The raw protein content (6.31 ± 1.01–2.15 ± 0.12 g 100 g−1) is suggestive of pectins with emulsifying surface properties (Kermani et al., Citation2015), and this differed significantly (p < 0.05) between extraction methods applied to the same citrus species. The lower protein content in PPU (2.15 ± 0.12 g 100 g−1) and PRU (4.81 ± 0.23 g 100 g−1) is likely due to the cavitation effect on the ramified regions that contain arabinogalactan-protein fractions (Schols & Voragen, Citation2002; Zhang et al., Citation2013). Based on the color attributes, the pectins tended towards a yellow hue (h°): PPU (77.24 ± 0.04°), PPC (65.86 ± 6.05°), PRU (76.41 ± 0.25°), and PRC (72.61 ± 0.74°). This is indicative of lesser degradation during drying (non-enzymatic browning). However, they were less luminous than CP (L* = 75.91 ± 0.99), likely due to the drying method (Tsami, Krokida, & Drouzas, Citation1998) and industrial standardization of the latter (Rolin, Citation2002). C. reticulata pectins presented greater polyphenol content (PRC: 6.54 ± 1.02 mg GAE/g; PRU: 4.74 ± 0.22 mg GAE/g). Free acidity was greater for the pectins obtained by UAE. The values associated with residual citric acid (0.68 ± 0.05–1.39 ± 0.13 mEq) were lower than those for citrus pectins (1.73–3.0 mEq) of C. latifolia (Ayora-Talavera et al., Citation2017).
19. Structural characterization of citrus pectins
The structural characterization of the pectins obtained by UAE and CE is presented in . PPC (84.25 ± 2.98%) and PRC (82.30 ± 2.6%) showed DEs not significantly different to CP (84.91 ± 1.14%) but significantly greater (p < 0.05) than PPU (72.15 ± 0.11%) and PRU (71.81 ± 1.64%). The ultrasound likely led to the modification of the molecular structure of the PPU and PRU pectins (Wang et al., Citation2015; Zhang et al., Citation2013) due to mechanical effects (shearing forces) in the liquid surrounding the bubble that could break the C = O bond in the carboxyl group (Zhang et al., Citation2013). However, high-MeO pectins such as those obtained by UAE (11.74 ± 0.03%) are suggestive of a gelling power based on hydrophobic interactions and hydrogen bonds between carboxyl groups without dissociation in the presence of high sugar content (65%) and pH <3.5 (Abid et al., Citation2017; Thakur et al., Citation1997). As such, they can be classified as slow-gelling pectins, which is an important condition in the production of products with a range of texture characteristics (Adi-Dako et al., Citation2016), from jellies and confectionery to pharmaceutical applications associated with the release of orally and nasally administered medications.
Table 1. Chemical and functional parameters of native pectins from C. paradisi and C. reticulata.
Tabla 1. Parámetros químicos y funcionales de pectinas nativas de C. paradisi y C. reticulata.
In pectins, the GalA content is indicative of the degree of purity. PPU and PPC had GalA contents of over 65% and are classified as commercial pectins (food grade) according to the FAO and EU (Bagherian et al., Citation2011; Pereira et al., Citation2016). The GalA content in PRU (54.34 ± 1.21%) was significantly lower (p < 0.05) than in PRC (63.07 ± 2.52%) and CP (85.12 ± 1.34%) (). The greater GalA content was likely due to the high temperatures, greater extraction time and lower pH during extraction, similar to that reported for pomegranate (Pereira et al., Citation2016) and banana (Freitas de Oliveira et al., Citation2016) pectins.
FTIR confirmed the structure of all of the pectins and identified the main functional groups (). The wavelength region from 900 to 1200 cm−1 is considered the fingerprint region for carbohydrates (Posé et al., Citation2012) and allowed for the identification of ether (R–O–R) chemical groups and cyclic rings (C–C) at wavelengths of 1100–1200 cm−1 (Liu et al., Citation2010). Absorption peaks at 1010–1100 cm−1 indicated that the samples contain pyranoses and furanoses. The peaks at 827 cm−1 reference the absorption of alpha-D-mannopyranose, and this peak was smaller for PRC than for CP. Stretching bands at 1600–1630 and absorption peaks at 1730–1760 cm−1 correspond to C = O stretching vibrations of free carboxyl (COO–) and methyl-esterified (COO–R) groups, respectively (Wang et al., Citation2015). The absorbance of these bands varies based on the extraction method. The average of the signal of 1734 cm−1 (COO-R) over the sum of the peak of 1734 cm−1 (COO-R) and 1646 cm−1 (COO-) was calculated as DE (Hosseini, Khodaiyan, Kazemi, & Najari, Citation2019). Therefore, it could be concluded that all pectins belong to high methoxyl. The absorbances of 2915 cm−1 were attributed to the C-H stretching vibration of the CH3 associated with O-acetyl groups (Trujillo-Ramírez, Lobato-Calleros, & Román-Guerrero, Citation2018). To this respect, C, reticulata pectins showed the highest intensity of absorbance to the acetyl ester groups. However, the intensity of absorbance decreased when the pectins were extracted by ultrasound showed depolymerization, deesterification ( and ) and probably deacetylation. At approximately 3,440 cm−1 there is a wide band attributed to the stretching vibration of – OH groups due to inter- and intramolecular bonds in the main chains of galacturonic acid (Liang et al., Citation2012). The analysis shows the influence of the extraction methods on the chemical structure of the pectins of both species.
Figure 2. Infrared spectra of native pectins from C. paradisi and C. reticulata obtained by CE and UAE. Abbreviations: PPC, pectins from C. paradisi extracted conventionally; PPU, pectins from C. paradisi extracted by ultrasound; PRC, pectins from C. reticulata extracted conventionally; PRU, pectins from C. reticulata extracted by ultrasound.
Figura 2. Espectros infrarrojos de pectinas nativas de C. paradisi y C. reticulata obtenidas por EC y EAU. Abreviaturas: PPC, pectinas de C. paradisi extractada convencionalmente; PPU, pectinas de C. paradisi extractada por ultrasonido; PRC, pectinas de C. reticulata extractada convencionalmente; PRU, pectinas de C. reticulata extractada por ultrasonido.
The [Mw] differed based on the extraction method for PPC (123.60 ± 2.04 kDa) and PPU (95.35 ± 1.78 kDa), and both pectins presented a greater [Mw] than CP (92.64 ± 1.09 kDa) (). Meanwhile, the difference was smaller between PRC (48.70 ± 0.54 kDa) and PRU (46.59 ± 0.50 kDa). This phenomenon, observed especially for PRU, is because only long chains are vulnerable to breakage due to the action of hydrodynamic forces during the ultrasound process, while chains below the critical size limit cannot be degraded in this way (Chen & Chen, Citation2000).
20. Functional characterization and rheological behavior of citrus pectins
The molecular weight, protein and polyphenols content, degree of acetylation and methylesterification are the main factors which dictate the functional properties of pectin. The structure of pectins varies according to the source species, original tissue type and location, developmental or metabolic stage, environmental sate and conditions of extraction (Cunha & Gandini, Citation2010). Pectin must be dissolved in aqueous medium before application. The solubility of PPC and PPU was similar to PC under the conditions evaluated. The results appear to indicate that solubility increases with the degree of methoxylation. However, it may be more a result of the block distribution of free carboxyl groups on the chain of homogalacturonans, as well as the lower number of inter–intra molecular interactions with a blocking effect on hydrophilic groups, as reported for highly methoxylated pectins (Einhorn-Stoll, Kastner, Hecht, Zimathies, & Drusch, Citation2015). The medium solubility of PRC and PRU appears to indicate agglomeration and lumping, which affects their hydration. In this regard, the C. reticulata pectins showed the highest content to acetyl ester groups according to the IFTR analysis, which could help to explain the hydrophobic character of pectin (Cunha & Gandini, Citation2010). Likewise, the processing conditions (drying) likely had an effect by affecting parameters such as particle morphology (Einhorn-Stoll et al., Citation2015; Tsami et al., Citation1998) and the physical state of the molecule (crystalline or amorphous) (Einhorn-Stoll et al., Citation2015; Mathlouthi, Citation2001). Evenly, the greater inorganic residue content in PRC (3.29 ± 0.03 g 100 g−1) and PRU (3.55 ± 0.01 g 100 g−1) may have affected the dispersion and dissolution of the heteropolysaccharides. At an alkaline pH, the results indicate that the C. reticulata pectins likely underwent changes during heating. The reduction of intra/intermolecular attractive forces (hydrogen bonds, electrostatic bonds, and hydrophobic interaction) is imperative to improve the dissolution (Kurita, Miyake, & Yamazaki, Citation2012; Ngouémazong, Christiaens, Shpigelman, Van Loey, & Hendrickx, Citation2015).
Pectin is a hydrocolloid that can interact with water in different ways. WHC was significantly greater (p < 0.05) for PPC (21.78 ± 1.03 g H2O/g pectin) and PRC (18.76 ± 1.09 g H2O/g pectin) than CP (2.02 ± 0.20 g H2O/g pectin) (). Bayar et al. (Citation2017) reported values in a lower range (4.81–5.64 g H2O/g pectin) for nopal pectins. The greater WHC of pectins obtained by CE is likely due to the greater number of free hydroxyl group in the pectin structure (Bayar et al., Citation2017) and also may be due to their particle properties (porosity of pectin powder, etc.) (Bayar et al., Citation2017; Tsami et al., Citation1998), which can favor physical immobilization of water on their surface by sorption or trapping in microcapillaries or interparticle voids (Furmaniak, Terzyk, & Gauden, Citation2007). Meanwhile, PPU (15.42 ± 3.46) and PRU (16.61 ± 4.24) presented lower absorption and water holding due to the modification of the native state of the heteropolysaccharides. These hydration properties make the C. paradisi and C. reticulata pectins suitable for developing products enriched with fiber (Romero-Lopez, Osorio-Diaz, Bello-Perez, Tovar, & Bernardino-Nicanor, Citation2011). With regard to OHC, no differences were observed based on the source or extraction method.
The rheological behavior of the aqueous pectin solutions showed significantly different intrinsic viscosities between PPC (4.98 ± 0.06 dL/g), PPU (4.12 ± 0.05 dL/g), and CP (4.03 ± 0.04 dL/g) (). The values were greater than those reported for grapefruit pectins extracted by ultrasound (3.23 dL/g) and conventionally (3.98 dL/g) (Bagherian et al., Citation2011). The intrinsic viscosities of all pectins were estimated in the same way as shown in . Aqueous solutions of pectin can show pseudoplastic behavior (shear-thinning), directly dependent on the molecular weight and concentration of pectin. The highest viscosity and shear-thinning behavior exhibited by the grapefruit pectin solutions at 1000 s-1 were mainly explained by the high molecular weight in conventional extraction (PPC > PC > PRC). Similar behavior was presented in pectins extracted by ultrasonic assisted (PPU > PC > PRU) at 1000 s−1 in this study. presents the highest viscosity apparent values of PRC and PRU within the range of 0.1–10 s−1 and 0.1 to 100 s−1 versus PC, respectively. This behavior may be due to the crosslinking of the hydrophobic interactions within the pectin chains between the acetyl, methyl, and feruloyl esters, such as the protein content present in the long chain. The intermolecular distances between the pectin molecules decrease, facilitating intermolecular interactions such as hydrogen bonding and hydrophobic forces between chains, indicating that pectin solution with this characteristic requires a higher force to break its structure (Chan, Choo, Young, & Loh, Citation2017).
Figure 3. Reduced viscosity vs. concentration of grapefruit pectin-conventional (PPC) dispersed in 100 mM NaCl aqueous solution. The solid line shows a linear relationship between reduced viscosity and pectin concentration. Abbreviations: PPC, pectins from C. paradisi extracted conventionally.
Figura 3. La viscosidad reducida vs la concentración de pectina convencional de pomelo (PPC) dispersa en una solución acuosa de NaCl 100 mM. La línea continua muestra una relación lineal entre la viscosidad reducida y la concentración de pectina. Abreviaturas: PPC, pectinas de C. paradisi extraídas convencionalmente.
Figure 4. Flow curves of pectin solutions (2% w/v) at 25°C. Abbreviations: PPC, pectins from C. paradisi extracted conventionally; PPU, pectins from C. paradisi extracted by ultrasound; PRC, pectins from C. reticulata extracted conventionally; PRU, pectins from C. reticulata extracted by ultrasound.
Figura 4. Curvas de flujo de soluciones de pectina (2% p/v) a 25°C. Abreviaturas: PPC, pectinas de C. paradisi extraídas convencionalmente; PPU, pectinas de C. paradisi extraídas por ultrasonido; PRC, pectinas de C. reticulata extraídas convencionalmente; PRU, pectinas de C. reticulata extraídas por ultrasonid.
21. Conclusions
The results offer a perspective on the potential use of the pectins evaluated. The yield, as well as the specificity of the physicochemical, structural, rheological, and functional parameters of the pectins, depends on parameters defined during extraction, as well as on the citrus source used. UAE combined with citric acid represents a green alternative in terms of reduced pollutant effluents, time and energy, and favored obtaining pectins from C. paradisi with greater viscosimetric molecular weight and degree of esterification and an adequate galacturonic acid content for classification as slow-gelling commercial pectins for producing products with a range of texture characteristics or as edible coverings together with other biopolymers. Meanwhile, the pectins from C. reticulata presented physicochemical properties (high protein content, high methoxyl group content and lower viscosimetric molecular weight) the synergy of which could provide surface properties or they could be used as biocomposites for microencapsulation processes. All pectins showed pseudoplastic fluid characteristics with shear thinning behavior. However, rheological and techno-functional studies are underway.
Acknowledgment
This work was supported by a grant of the CONACYT for the first author.
Disclosure statement
No potential conflict of interest was reported by the authors.
Additional information
Funding
References
- Abid, M., Cheikhrouhou, S., Renard, C. M. G. C., Bureau, S., Cuvelier, G., Attia, H., & Ayadi, M. A. (2017). Characterization of pectins extracted from pomegranate peel and their gelling properties. Food Chemistry, 215, 318–325.
- Adetunji, L. R., Adekunle, A., Orsat, V., & Raghavan, V. (2017). Advances in the pectin production process using novel extraction techniques: A review. Food Hydrocolloids, 62, 239–250.
- Adi-Dako, O., Ofori-Kwakye, K., Frimpong Manso, S., Boakye-Gyasi, M. E. L., Sasu, C., & Pobee, M. (2016). Physicochemical and antimicrobial properties of cocoa pod husk pectin intended as a versatile pharmaceutical excipient and nutraceutical. Journal of Pharmaceutics, 2016, 1–12.
- AOAC. (1997). Official methods of analysis of the AOAC (7th ed.). Washington, DC: Goverment printing office.
- Ayora-Talavera, T., Ramos-Chan, C., Covarrubias-Cárdenas, A., Sánchez-Contreras, A., García-Cruz, U., Pacheco, L. N., & Pacheco, L. N. A. (2017). Evaluation of pectin extraction conditions and polyphenol profile from citrus x lantifolia waste: Potential application as functional ingredients. Agriculture, 7(3), 28.
- Bagherian, H., Zokaee Ashtiani, F., Fouladitajar, A., & Mohtashamy, M. (2011). Comparisons between conventional, microwave- and ultrasound-assisted methods for extraction of pectin from grapefruit. Chemical Engineering and Processing: Process Intensification, 50(11–12), 1237–1243.
- Bayar, N., Bouallegue, T., Achour, M., Kriaa, M., Bougatef, A., & Kammoun, R. (2017). Ultrasonic extraction of pectin from Opuntia ficus indica cladodes after mucilage removal: Optimization of experimental conditions and evaluation of chemical and functional properties. Food Chemistry, 235, 275–282.
- Begum, R., Aziz, M. G., Uddin, M. B., & Yusof, Y. A. (2014). Characterization of jackfruit (Artocarpus heterophyllus) waste pectin as influenced by various extraction conditions. Agriculture and Agricultural Science Procedia, 2, 244–251.
- Blumenkrantz, N., & Asboe-Hansen, G. (1973). New method for quantitative determination of uronic acids. Analytical Biochemistry, 54(2), 484–489.
- Bochek, A. M., Zabivalova, N. M., & Petropavlovskii, G. A. (2001). Determination of the esterification degree of polygalacturonic acid. Russian Journal of Applied Chemistry, 74(5), 796–799.
- Chan, S. Y., Choo, W. S., Young, D. J., & Loh, X. J. (2017). Pectin as a rheology modifier: Origin, structure, commercial production and rheology. Carbohydrate Polymers, 161, 118–139.
- Chandrapala, J., Oliver, C. M., Kentish, S., & Ashokkumar, M. (2013). Use of power ultrasound to improve extraction and modify phase transitions in food processing. Food Reviews International, 29(1), 67–91.
- Chang-Won, C., Do-Youn, L., & Chan-Wha, K. (2003). Concentration and purification of soluble pectin from mandarin peels using crossflow microfiltration system. Carbohydrate Polymers, 54(1), 21–26.
- Chemat, F., Rombaut, N., Sicaire, A. G., Meullemiestre, A., Fabiano-Tixier, A. S., & Abert-Vian, M. (2017). Ultrasound assisted extraction of food and natural products. Mechanisms, techniques, combinations, protocols and applications. A review. Ultrasonics Sonochemistry, 34, 540–560.
- Chemat, F., Zill-e-Huma, & Khan, M. K. (2011). Applications of ultrasound in food technology: Processing, preservation and extraction. Ultrasonics Sonochemistry, 18(4), 813–835.
- Chen, J., Liu, W., Liu, C.-M., Li, T., Liang, R.-H., & Luo, S.-J. (2015). Pectin modifications: A review. Critical Reviews in Food Science and Nutrition, 55(12), 1684–1698.
- Chen, R. H., & Chen, J. S. (2000). Changes of polidispersity and limiting molecular weight of ultrasound-treated chitosan. In M. G. Peter, A. Domard, & R. A. A. Muzarelli (Eds.), Advances in chitin science. Volumen IV (pp. 361–366). Germany: Universitiat Postdam.
- Cuevas-Bernardino, J. C., Lobato-Calleros, C., Román-Guerrero, A., Alvarez-Ramirez, J., & Vernon-Carter, E. J. (2016). Physicochemical characterisation of hawthorn pectins and their performing in stabilising oil-in-water emulsions. Reactive and Functional Polymers, 103(103), 63–71.
- Cunha, A. G., & Gandini, A. (2010). Turning polysaccharides into hydrophobic materials: A critical review. Part 2. Hemicelluloses, chitin/ chitosan,starch, pectin and alginates. Cellulose, 17(6), 1045–1065.
- Einhorn-Stoll, U., Kastner, H., & Drusch, S. (2014). Thermally induced degradation of citrus pectins during storage–Alterations in molecular structure, colour and thermal analysis. Elsevier, 35, 565–575.
- Einhorn-Stoll, U., Kastner, H., Hecht, T., Zimathies, A., & Drusch, S. (2015). Modification and physico-chemical properties of citrus pectin – Influence of enzymatic and acidic demethoxylation. Food Hydrocolloids, 51(51), 338–345.
- FAO. (2017). Citrus fruit - fresh and processed. Statistical bulletin. Retrieved from http://www.fao.org/economic/est/est-commodities/citrus-fruit/en/
- FEEDAP. (2015). Scientific opinion on the safety and efficacy of citric acid when used as a technological additive (preservative) for all animal species. EFSA Journal, 13, 2.
- Folin, O., & Ciocalteau, V. (1927). Tyrosine and tryptophane in proteins. Journal of Biological Chemistry, 73(2), 627–648.
- Freitas de Oliveira, C., Giordani, D., Lutckemier, R., Gurak, P. D., Cladera-Olivera, F., & Ferreira Marczak, L. D. (2016). Extraction of pectin from passion fruit peel assisted by ultrasound. LWT - Food Science and Technology, 71(71), 110–115.
- Furmaniak, S., Terzyk, A. P., & Gauden, P. A. (2007). The general mechanism of water sorption on foodstuffs – Importance of the multitemperature fitting of data and the hierarchy of models. Journal of Food Engineering, 82(4), 528–535.
- Gan, C. Y., Abdul Manaf, N. H., & Latiff, A. A. (2010). Physico-chemical properties of alcohol precipitate pectin-like polysaccharides from Parkia speciosa pod. Food Hydrocolloids, 24(5), 471–478.
- González-Centeno, M. R., Knoerzer, K., Sabarez, H., Simal, S., Rosselló, C., & Femenia, A. (2014). Effect of acoustic frequency and power density on the aqueous ultrasonic-assisted extraction of grape pomace (Vitis vinifera L.) – A response surface approach. Ultrasonics Sonochemistry, 21(6), 2176–2184.
- Grassino, A. N., Brnčić, M., Vikić-Topić, D., Roca, S., Dent, M., & Brnčić, S. R. (2016). Ultrasound assisted extraction and characterization of pectin from tomato waste. Food Chemistry, 198, 93–100.
- Hosseini, S. S., Khodaiyan, F., Kazemi, M., & Najari, Z. (2019). Optimization and characterization of pectin extracted from sour orange peel by ultrasound assisted method. International Journal of Biological Macromolecules, 125, 621–629.
- Jafari, F., Khodaiyan, F., Kiani, H., & Hosseini, S. S. (2017). Pectin from carrot pomace: Optimization of extraction and physicochemical properties. Carbohydrate Polymers, 157, 1315–1322.
- Joslyn, M. A. (1980). Methods in food analysis. Physical, chemical and instrumental methods of analysis (2nd ed.). New York, NY: Academic Press.
- Kermani, J. Z., Shpigelman, A., Pham, A., Huong, T. T., Van Loey, A. M., & Hendrickx, M. E. (2015). Functional properties of citric acid extracted mango peel pectin as related to its chemical structure. Food Hydrocolloids, 44(44), 424–434.
- Kermani, Z. J., Shpigelman, A., Kyomugasho, C., Van Buggenhout, S., Ramezani, M., Van Loey, A. M., & Hendrickx, M. E. (2014). The impact of extraction with a chelating agent under acidic conditions on the cell wall polymers of mango peel. Food Chemistry, 161, 199–207.
- Koubala, B. B., Mbome, L. I., Kansci, G., Tchouanguep Mbiapo, F., Crepeau, M.-J., Thibault, J.-F., & Ralet, M.-C. (2008). Physicochemical properties of pectins from ambarella peels (Spondias cytherea) obtained using different extraction conditions. Food Chemistry, 106(3), 1202–1207.
- Kurita, O., Miyake, Y., & Yamazaki, E. (2012). Chemical modification of citrus pectin to improve its dissolution into water. Carbohydrate Polymers, 87(2), 1720–1727.
- Liang, R., Chen, J., Liu, W., Liu, C., Yu, W., Yuan, M., & Zhou, X. (2012). Extraction, characterization and spontaneous gel-forming property of pectin from creeping fig (Ficus pumila Linn.) seeds. Carbohydrate Polymers, 87(1), 76–83.
- Liu, L., Cao, J., Huang, J., Cai, Y., & Yao, J. (2010). Extraction of pectins with different degrees of esterification from mulberry branch bark. Bioresource Technology, 101(9), 3268–3273.
- Mathlouthi, M. (2001). Water content, water activity, water structure and the stability of foodstuffs. Food Control, 12(7), 409–417.
- Medina-Torres, N., Ayora-Talavera, T., Espinosa-Andrews, H., Sánchez-Contreras, A., Pacheco, N., Medina-Torres, N., … Pacheco, N. (2017). Ultrasound assisted extraction for the recovery of phenolic compounds from vegetable sources. Agronomy, 7(3), 47.
- Migliori, M., Gabriele, D., Checchetti, A., & Battipede, B. (2010). Compatibility analysis of pectin at different esterification degree from intrinsic viscosity data of diluted ternary solutions. Reactive and Functional Polymers, 70(10), 863–867.
- Montoya-López, J., Giraldo-Giraldo, G. A., & Lucas-Aguirre, J. C. (2012). Determinación del índice de blancura en harina de trigo comercial. Vitae, 19(1), S415–S416. Retrieved from http://ww.redalyc.org/articulo.oa?id=6982394130
- Naqash, F., Masoodi, F. A., Rather, S. A., Wani, S. M., & Gani, A. (2017). Emerging concepts in the nutraceutical and functional properties of pectin—A Review. Carbohydrate Polymers, 168, 227–239.
- Nelson, D. B., Smith, C. G. B., & Wiles, R. R. (1977). No title. In H. D. Grahm (Ed.), Comercially important pectic substances (pp. 418–437). Westport, CN: AVI.
- Ngouémazong, E. D., Christiaens, S., Shpigelman, A., Van Loey, A., & Hendrickx, M. (2015). The emulsifying and emulsion-stabilizing properties of pectin: A review. Comprehensive Reviews in Food Science and Food Safety, 14(6), 705–718.
- NOM-247-SSA1. (2008). NOM-247-SSA1. Productos y servicios. Cereales y sus productos. Cereales, harinas de cereales, sémolas o semolinas. Retrieved from http://depa.fquim.unam.mx/amyd/archivero/NOMcereales_12434.pdf
- Pereira, P. H. F., Oliveira, T. Í. S., Rosa, M. F., Cavalcante, F. L., Moates, G. K., Wellner, N., … Azeredo, H. M. C. (2016). Pectin extraction from pomegranate peels with citric acid. International Journal of Biological Macromolecules, 88, 373–379.
- Posé, S., Kirby, A. R., Mercado, J. A., Morris, V. J., & Quesada, M. A. (2012). Structural characterization of cell wall pectin fractions in ripe strawberry fruits using AFM. Carbohydrate Polymers, 88(3), 882–890.
- Rolin, C. (2002). Commercial pectin preparations. In J. P. Seymour & G. B. Knox (Eds.), Pectins and their manipulations (pp. 221–241). Boca Raton: CRC.
- Romero-Lopez, M. R., Osorio-Diaz, P., Bello-Perez, L. A., Tovar, J., & Bernardino-Nicanor, A. (2011). Fiber concentrate from orange (Citrus sinensis L.) bagase: Characterization and application as bakery product ingredient. International Journal of Molecular Sciences, 12(4), 2174–2186.
- Safaryan, M. J., Ganjloo, A., Bimakr, M., & Zarringhalami, S. (2016). Optimization of ultrasound-assisted extraction, preliminary characterization and in vitro antioxidant activity of polysaccharides from green pea pods. Foods, 5, 78.
- Sanchez-Aldana, D., Aguilar, C. N., Nevarez-Moorillon, G. V., & Contreras-Esquivel, J. C. (2013). Comparative extraction of pectic and polyphenols from mexican lime pomace and bagasse. American Journal of Agricultural and Biological Sciences, 8(4), 309–322.
- Schols, H. A., & Voragen, A. G. J. (2002). The chemical structure of pectins. In J. P. Seymour & G. B. Knox (Eds.), Pectins and their manipulations (pp. 1–25). Boca Raton: CRC.
- Thakur, B. R., Singh, R. K., Handa, A. K., & Rao, M. A. (1997). Chemistry and uses of pectin — A review. Critical Reviews in Food Science and Nutrition, 37(1), 47–73.
- Tiwari, B. K. (2015). Ultrasound: A clean, green extraction technology. TrAC Trends in Analytical Chemistry, 71, 100–109.
- Trujillo-Ramírez, D., Lobato-Calleros, C., & Román-Guerrero, A. (2018). Complexation with whey protein hydrolysate improves cacao pods husk pectin surface active and emulsifying properties. Reactive and Functional Polymers, 123, 61–69.
- Tsami, E., Krokida, M. K., & Drouzas, A. E. (1998). Effect of drying method on the sorption characteristics of model fruit powders. Journal of Food Engineering, 38(4), 381–392.
- Vasco, C., Ruales, J., & Kamal-Eldin, A. (2008). Total phenolic compounds and antioxidant capacities of major fruits from Ecuador. Food Chemistry, 111(4), 816–823.
- Venzon, S. S., Canteri, M. H. G., Granato, D., Junior, B. D., Maciel, G. M., Stafussa, A. P., & Haminiuk, C. W. I. (2015). Physicochemical properties of modified citrus pectins extracted from orange pomace. Journal of Food Science and Technology, 52(7), 4102–4112.
- Vilkhu, K., Mawson, R., Simons, L., & Bates, D. (2008). Applications and opportunities for ultrasound assisted extraction in the food industry — A review. Innovative Food Science & Emerging Technologies, 9(2), 161–169.
- Wang, W., Ma, X., Xu, Y., Cao, Y., Jiang, Z., Ding, T., … Liu, D. (2015). Ultrasound-assisted heating extraction of pectin from grapefruit peel: Optimization and comparison with the conventional method. Food Chemistry, 178, 106–114. Retrieved from http://www.ncbi.nlm.nih.gov/pubmed/25704690
- Wang, X.-S., Wu, Y.-F., Dai, S.-L., Chen, R., & Shao, Y. (2012). Ultrasound-assisted extraction of geniposide from Gardenia jasminoides. Ultrasonics Sonochemistry, 19(6), 1155–1159.
- Yapo, B. M., Robert, C., Etienne, I., Wathelet, B., & Paquot, M. (2007). Effect of extraction conditions on the yield, purity and surface properties of sugar beet pulp pectin extracts. Food Chemistry, 100(4), 1356–1364.
- Zhang, L., Ye, X., Xue, S. J., Zhang, X., Liu, D., Meng, R., & Chen, S. (2013). Effect of high-intensity ultrasound on the physicochemical properties and nanostructure of citrus pectin. Journal of the Science of Food and Agriculture, 93(8), 2028–2036.
- Zouambia, Y., Youcef Ettoumi, K., Krea, M., & Moulai-Mostefa, N. (2017). A new approach for pectin extraction: Electromagnetic induction heating. Arabian Journal of Chemistry, 10(4), 480–487.