
 ?Mathematical formulae have been encoded as MathML and are displayed in this HTML version using MathJax in order to improve their display. Uncheck the box to turn MathJax off. This feature requires Javascript. Click on a formula to zoom.
ABSTRACT
The volatile organic compounds (VOCs) in different processing stages of dried pork slices (DPS) were analyzed by gas chromatography-ion mobility spectrometry (GC-IMS), which was used to construct the GC-IMS odor fingerprint spectrometry. The VOCs of raw meat, mixed meat, cured meat, semi-finished meat and finished meat were detected and analyzed by GC-IMS. The result shows that the main VOC species in DPS include alcohols and aldehydes, acids, ketones, heterocyclic compounds, aromatic hydrocarbons and esters. Except that the VOCs of mixed meat and cured meat were very similar, the odor component characteristics of DPS in other processing stages were significantly different. GC-IMS technology can effectively distinguish the volatile component differences of preserved meat samples at different processing stages. It is of profound significance to regulate and ensure the consistency of the VOCs in the processing of DPS.
RESUMEN
En este estudio se analizaron los compuestos orgánicos volátiles (VOC) presentes en las diferentes etapas de procesamiento de rodajas de carne de cerdo deshidratada (DPS). Para ello se utilizó cromatografía de gases-espectrometría de movilidad de iones (GC-IMS) y los resultados se emplearon para construir la espectrometría de huellas de olor GC-IMS. Así, se detectaron y analizaron mediante GC-IMS los VOC de la carne cruda, la carne mezclada, la carne curada, la carne semiacabada y la carne acabada. Se constató que entre las principales tipos de VOC en la DPS se incluyen alcoholes y aldehídos, ácidos, cetonas, compuestos heterocíclicos, hidrocarburos aromáticos y ésteres. Con excepción de la carne mezclada y la carne curada, en las que se comprobó que los VOC son muy similares, las características de los componentes que provocan el olor de la DPS en otras etapas de elaboración son muy diferentes. La tecnología GC-IMS permite distinguir eficazmente las diferencias entre los componentes volátiles de las muestras de carne conservada en diferentes etapas de procesamiento. Por ello es de gran importancia regular y asegurar la consistencia de los VOC en el procesamiento de la DPS.
1. Introduction
The dried meat slice, generally referred to as Rou Fu in the local Chinese parlance, is a traditional barbecued meat product in China, which is popular with consumers due to its high nutritional value, convenience and portability (Cheng et al., Citation2017; Xu et al., Citation2019). According to historical records, the dried meat slice can be traced to the Western Han-Dynasty, which was more than 2 000 years old (Gao & Wang, Citation2015). It can be subdivided into dried pork slice (DPS), dried beef slice, dried chicken slice, dried duck slice and so on. The dried pork slice is a crimson or a brownish slice meat product which is made from elaborately selected high-quality pig hind leg meat. The steps for preparing DPS include slicing, addition of seasoning, curing and baking. In the process of making DPS, chemical changes such as maillard reaction, lipid oxidation and strecker degradation will cause significant changes in volatile organic components (VOCs). Therefore, process changes in each stage will have a definite influence on quality of the final product.
However, the current product quality control of DPS is still based on artificial sensory evaluation. Under the trend of modernization of traditional food and increasing consumption demand, how to maintain the consistency of processing quality of DPS in the process is related to whether the DPS industry transition could successfully translate to industry under the process of modernization. On the other hand, the product quality control also urgently needs objective evaluation to data obtained from modern instruments (Fang et al., Citation2018).
In recent years, gas chromatography-ion migration spectroscopy (GC-IMS) technology is developed for the detection of VOCs (Vautz et al., Citation2018). Compared with electronic nose and gas chromatography-mass spectrometry (GC-MS), GC-IMS have the advantages of simple operation, portable size, high sensitivity and no sample pretreatment required (Lapthorn et al., Citation2013). At present, this technology has been successfully used in classification of meat products (Tong et al., Citation2019), detection of products freshness (Cavanna et al., Citation2019), and identification of authentic and fake Iberian ham (Arroyo-Manzanares et al., Citation2018; Martin-Gomez et al., Citation2019). However, there are few studies on the changes of VOCs in the process of baking meat products.
The aim of this research was to use GC-IMS technology to detect the VOCs of DPS in different processing stages, to find a new way to identify the VOCs of baking meat product, to provide a theoretical basis for the study of VOCs consistency in processing of DPS, and to develop a novel monitoring method for modern production and processing of DPS.
2. Materials and methods
2.1. Material
The hind leg meat of freshly slaughtered pork was purchased at Auchan supermarket in Zhenjiang, and stored in an incubator at 4°C and quickly transported to the laboratory. Other essentials including sucrose (purchased from Cofco Group Co. Ltd), monosodium glutamate (provided by Lotus Health Group Company), papain (provided by Guangzhou Yulibao Biotechnology Co., Ltd), pepper, fish sauce and eggs were purchased. All food materials were of food grade and meet Chinese government food hygiene standards.
2.2. Sample preprocessing
According to the conventional processing method of DPS, the processing stages of meat products can be divided into raw meat, mixed meat, cured meat, semi-finished meat and finished meat. The specific steps for sample preparation from each stage are shown below.
The raw meat: fresh pig hind leg lean meat 1 000 g, which removed broken bones, cartilage and fat. Along the direction of the pork texture, the pork was cut into slices with a thickness of 2 mm by a special blade.
The mixed meat: According to the proportion of DPS provided by Shuangyu Food Co., Ltd (Jiangsu Shuangyu Investment Co.), 125 g sucrose, 4.7 g monosodium glutamate, 0.3 g pepper, 82.08 g fish sauce and 25.9 g egg white liquid were added to 1000 g raw meat slices. After sufficient mixing, mixed meat was sampled and detected immediately.
The cured meat: 0.8 g of papain was measured and added to the mixed meat above, and marinated at 4°C for at least half an hour to allow better integration of seasoning into the meat. The meat after marinated sampled as cured meat. The cured meat sample could be preserved at 4°C within 24 h.
The semi-finished product: the cured meat should be laid flat on the grill with no overlap and gap between the meat slice. And then, they were dried in a hot air drying oven (provided by Shanghai Jinghong Laboratory Equipment Co., Ltd) for 5 h at 80°C. 1 000 g cured meat yielded about 400 g semi-finished meat.
The finished meat: the dried meat slices were roasted in an oven (Shanghai Jinghong Laboratory Equipment Co., Ltd) at 180°C for 90 s, and then the brown meat slices were obtained. After that, the slices were cooled to room temperature naturally.
For each processing stage, 10 g was sampled for GC-IMS detection. All samples of the different processing stages were prepared in triplicate in different day to the experiments and analysis. The fresh meat should purchase within experiment day.
2.3. GC-IMS instrumentation
Analyses of pork slices were performed on a GC-IMS device (FlavourSpec© 1H1-00128) from Gesellschaft für Analytische Sensorysteme (G.A.S, Dortmund, Germany), which was equipped with an automatic sampler unit (PAL, Analytics AG, Zwingen, Switzerland) for 60 vials and furnished with an l mL Hamilton syringe. The device was also provided with a radioactive ionization source (tritium) of 6.5 KeV. The gas chromatographic column of the instrument is non-polar column SE-54-CB-1 quartz capillary column (constituted by 94% methyl-5% phenyl-1% vinyl silicone with 15 m of length, an internal diameter of 0.32 mm and 0.25 μm of film thickness).
2.4. GC-IMS method optimization
In this research, the flavor of DPS is taken as the research object, and the purpose is to realize the flavor analysis and quality control of DPS in the processing. Thus, the semi-product meat in key process of drying was taken as the optimized sample. The condition of headspace is related to whether VOCs can be effectively extracted from the sample. Before the GC-IMS analysis, the parameter of headspace including incubation temperature, incubation time and headspace injection volume should be optimized. The parameter of the GC column and drift tube was based on previous experiment condition (Chen et al., Citation2019). Other parameters remain unchanged during optimization. The optimized GC-IMS detection condition is shown in .
Table 1. The optimized GC-IMS method.
Tabla 1. El método optimizado de GC-IMS
2.5. Reagent and standard
All reagents used in this work were of analytical grade. 2-nonanone(CAS:821-55-6), 2-octanone(CAS:111-13-7), 2-heptanone(CAS:110-43-0), 2-hexanone(CAS:591-78-6), 2-pentanone(CAS:107-87-9) and 2-butanone(CAS:78-93-3) were purchased from Sinopharm Chemical Reagent Shanghai Co., Ltd, China.
For normalization of the retention index, each standard solution mentioned above sere diluted to 0.8 g/ml, respectively. Then, stock solutions of each standard solution were mixed according to the volume ratio of 1:1:1:1:1:1 and diluted to 1000 mg/L with ultra-pure water. The stock solution of mixed standard substance stock solution should be stored at 4°C. Before the detection, the stock solution was diluted with ultra-pure water to the concentration of each standard substance at 200 mg/L. Then, 1 mL solution was added to the 20 mL headspace sample bottle and the optimized method was used for detection. For repeatability study, stock solutions of 2-pentanone at 200 mg/L were prepared daily by dilution of stock solution with ultra-pure water. Each solution was tested continuously for 10 days and repeated 6 times each day.
2.6. GC-IMS analysis
For testing, each meat slice (2 g) was placed into a 20 ml gas phase headspace injection bottle sealed with a magnetic spiral seal cap. After 30 min of incubation at 80°C, 200 μL headspace was injected into the GC-IMS injection port (80°C) through the injection needle (above 80°C). The VOCs in the injection port were pushed to the GC column (40°C) through carrier gas (N2, purity ≥99.999%). The carrier gas flow rate of GC column was programmed as follows: 2 mL/min for 2 min, ramped to 15 mL/min within 8 min, then ramped to 100 ml/min within 10 min and finally ramped to 150 ml/min within 10 min. The total GC runtime was 30 min. After separation in the column, the compounds were pushed into the drift tube (45°C, 9.7 cm length). The temperature and flow rate of drift gas (N2, purity≥99.999%) were 45°C and 150 mL/min, respectively. The ion mode was set at positive state. Each spectrum was scanned 12 times on average.
For normalization of the individual GC retention properties to retention index libraries, the stock solution of mixed standard substance (Li et al., Citation2019) was analyzed under the same conditions and the obtained data were used as external reference to calculate the retention index (RI) of VOCs before searching the library.
2.7. Data analysis
The software LAV (Laboratory Analytical Viewer, version 2.2.1, from G.A.S) was used to compare the differences of the spectrogram from different angles and select the useful characteristic peak regions. And the software GC-IMS Library Search (version 1.0.3, from G.A.S) was used to calculate Retention Index (RI) and draft time (DT) of the VOCs and combine the NIST database to classify the compound.
3. Results and discussion
3.1. GC-IMS method optimization
The optimization experiment was based on the study of features found in the GC-IMS fingerprint after parameter modifications. Its purpose was to improve resolution and intensity of characteristic peaks. For this purpose, the parameters in were optimized. Details of the optimization are shown in the supplementary material.
3.2. Repeatability analysis
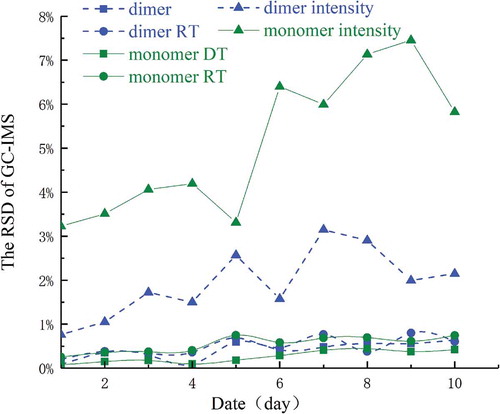
The optimized method tests the solutions of 2-pentanone and calculates the repeatability of the instrument based on the GC-IMS character peak of the 2-pentanone monomer and dimer. The repeatability of the same days and different days was calculated by peak intensity, drift time and retention time. The average and standard deviations of monomers and dimers are shown in . The relative standard deviation (RSD) of different days is shown in . The RSD values of DT for different days are less than 0.5%, the retention time is less than 1%, and the peak intensity was less than 8%, demonstrating suitability of the method for quality control analysis of DPS.
Table 2. GC-IMS precision study.
Tabla 2. Estudio de precisión del GC-IMS
Figure 1. The repeatability of GC-IMS.
Figura 1. Repetibilidad de la GC-IMS
3.3. GC-IMS topographic in different processing progress of DPS
In order to observe the differences of GC-IMS spectrum more intuitively, GC-IMS detection result of the raw meat was shown in a pseudo-color map (). The color in the picture represents signal value, in which red and blue indicates that the signal is strong and weak, respectively. The GC-IMS detection result of the other processing stages was displayed on the difference spectrum. Using the raw meat as reference, the difference spectrum was obtained by subtracting the reference spectrum signal from the mixed meat, cured meat, semi-finished and finished meat. In the difference spectrum, different colors indicate that the peak intensity is different from the reference. The white present that the difference was small, red means that peak intensity is higher than the reference, and blue indicates that it is weaker than the reference. In , the X-axis value represents the relative drift time of the VOCs in the drift tube, which is equivalent to drift time (7 ms −15 ms) pretreated by the reaction ion peak (RIP) time (the red value under the X-axis in ) normalization. After normalization, the effective value of the X-axis is between 0.8 and 1.8. And the Y-axis represents the retention time (RT, from 0 s to 1300 s) of the VOCs in the GC column.
Figure 2. The pseudo-color difference spectrum of dried pork slice relative to fresh meat at different processing stages.
Figura 2. Espectro de diferencia de seudocolor de la rebanada de carne de cerdo deshidratada en relación con la carne fresca en diferentes etapas de procesamiento
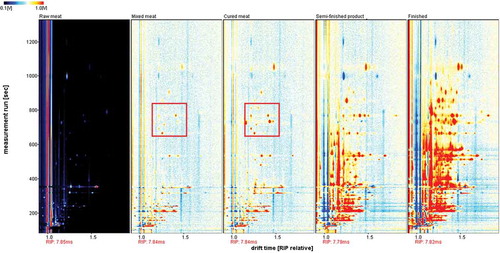
In , owing to addition of the corresponding seasoning, some VOCs signal of the mixed meat is stronger than that of the raw meat. However, the VOCs species of mixed meat slice were very similar to cured meat slice, only the components in the part of RT from 600 s to 800 s (red box in ) were different, and the cured one’s signal intensity was stronger than the mixed meat. This phenomenon is probably caused by low temperature and short time curing, which could produce a variety of VOCs (No 2, 25, 26, 27 in , including 1-octen-3-ol, phenylacetaldehyde, octanal, benzaldehyde, respectively) with low-polarity and low molecular weight, because the RT of non-polar VOCs in non-polar columns are longer than that of polar compounds (Arroyo-Manzanares et al., Citation2018). After meat drying and baking, some new signals emerged in the areas with RT of 100 s to 1000 s. The GC-IMS regions of VOCs of finished meat were more than those of semi-finished meat before baking, and those of semi-finished meat were more than those of cured meat before drying. The possible reason (Dominguez et al., Citation2019; Geng et al., Citation2019) for the increasing in number of VOCs type is that high temperature causes a series of reactions, such as maillard reaction and lipid oxidation in pork meat.
Table 3. Volatile organic compounds detected from dried pork slices by GC-IMS.
Tabla 3. Compuestos orgánicos volátiles detectados en rebanadas de carne de cerdo deshidratada por el GC-IMS
3.4. Qualitative analysis of GC-IMS fingerprint of DPS
In order to better select feature variables available in the original map, the effective signal regions in were selected by LAV software, and 54 characteristic peaks were selected. Those regions corresponding to specific chemical compounds were identified and the results are shown in . Then, for comparing VOCs differences in different processing stages of DPS, the signal of each peak of DPS under different processing conditions were arranged into gallery figure (). It can be seen that the VOCs types of cured meat were very similar to the mixed meat and raw meat, except some VOCs such as No. 15 to No. 18 (red oval area in ) which had significant difference. And the 3-methylbutanal (No. 17 and No. 18) and 1-butanol (No. 16) may be new substances caused by the addition of seasoning. After heating and dehydration, the number of IMS characteristic peaks in meat increased from 27 kinds of cured meat to 43 species in semi-finished meat, and then increased to 54 types in finished meat due to the effect of high temperature baking.
Figure 3. Characteristic flavor map image library of dried pork slice at different processing.
Figura 3. Biblioteca de imágenes del mapa de sabores característicos de la rebanada de carne de cerdo deshidratada en diferentes procesos

For specific substances equalization of the characteristic peaks, the external reference (the retention time of N-ketones C4-C9) is linearly calibrated with RI. Based on the determined RI and DT Volume libraries, GC-IMS Library Search software combined with NIST2014 was used to search for matched compounds. The result is showed in . The carrier gas (N2) and the water vapor (from the carrier gas or air) in the ionization region will produce the hydrated protons (H+(H2O)n, reactant ions) (Eiceman & Karpas, Citation2010). When H+(H2O)n meets analyte molecule separated from the chromatographic column, it will react with EquationEquation 1(1)
(1) to form MH+(H2O)n-1 (Protonated Monomer), the Z in Equationequation 1
(1)
(1) as a third body to stabilize the products. At the same time, analyte molecule could also react with MH+(H2O)n-1 to form M2 H+(H2O)n-2 (Proton Bound Dimer). Among them, the higher the concentration of analyte molecule, the more M2 H+(H2O)n-2 is produced. As some GC-IMS signal of VOCs existed in the form of dimer, the qualitative result of 54 regions only contains 37 substances.
shows that there are no alkanes and phenols in the GC-IMS detection results, which may be due to the fact that the proton affinity of alkanes is lower than that of water (Eiceman & Karpas, Citation2010). The essence of IMS is to detect the protonated monomer formed from VOCs and hydrated protons. Because the headspace gas of the sample and carrier gas (N2) contains water vapor, it is difficult to obtain the charge of alkanes in the ionization region of the drift tube, so that GC-IMS spectrum shows few or no alkanes in the qualitative detection result. This point of view is consistent with previous studies (Cavanna et al., Citation2019; Ge et al., Citation2020), in which GC-IMS result of test did not find alkane. Although alkanes have a certain degree of effect on flavor in DPS, the threshold of that effect is higher and has little effect on the flavor meat (Fang et al., Citation2018). Phenols were not detected in this study which is consistent with previous report (Fang et al., Citation2018) using GC-MS and sensory techniques to detect flavor in DPS.
3.5. Analysis of relative content of VOCs
In order to compare the changes of VOCs in different processing stages, the relative content of each VOCs (54 regions selected in ) in each sample was calculated according to the VOCs peak volume. Among them, since some VOCs exist in the form of dimer, the peak volume of dimer should be calculated at twice of the peak volume in the original spectrum peak. The peak volume was used to calculate the ratio of each chemical group to total VOCs and used to draw for comparing and analyzing the relative content of each chemical group.
Figure 4. Chart of relative content of VOCs in dried meat at different processing stages.
Figura 4. Gráfico del contenido relativo de VOC en la carne deshidratada en diferentes etapas de procesamiento
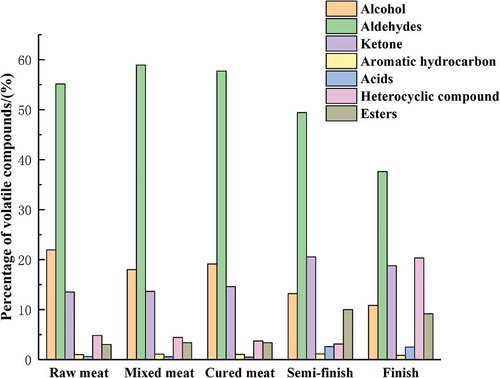
shows that aldehydes in the whole process were the predominant VOCs, followed by alcohols and ketones. These results are in agreement with the previous studies (Dominguez et al., Citation2019; Petricevic et al., Citation2018), in which also confirmed that aldehydes were the major VOCs in pork products. Aldehydes are produced by oxidation of unsaturated fatty acids (Dashmaa et al., Citation2011), which have a low sensor threshold and fatty characteristic aroma. With the heating process of DPS, the relative content of aldehydes in the finished product (37%) is less than that in the semi-finished product (49%), and less than that in cured meat (57%). The hexanal (No. 3 and 4), pentanal (No. 21) and octanal (No. 26) in GC-IMS color map all belong to saturated straight-chain aldehyde, which contain unpleasant spicy flavors with the characteristic smell of oil and wax (Dominguez et al., Citation2019). In addition, many previous studies (Biller et al., Citation2016; Song et al., Citation2019) have found that hexanal produced by the linoleic acid oxidation is an important VOC in pork products.
In , alcohols gradually decrease in the process of heating. shows that these alcohols in the GC-IMS detection results include linalool (No. 1), 1-octene-3-ol (No. 2) and others. And linalool in accounts for a large proportion of raw meat. As an aroma active substance added to the raw meat, linalool gradually decomposes with the heat of processing. 1-octene-3-ol has the flavor of cooked mushroom, which has an important contribution to the VOCs of pork. It is considered the product of linoleic and fatty acid autoxidation (Pham et al., Citation2008) that exists in the whole process of DPS production.
As shown in , all the ketones of GC-IMS detection results are 2-ketones including 2-hexanone, 2, 3-pentanedione, 2-pentanone, 2-butanone, 2-heptanone, 3-hydroxy-2-butanone and 2, 3-butanedione. 2-ketones have typical aroma of meat and cream, deemed to enhance the aroma of meat product due to their peculiar property. Meanwhile, 2-butanone has a strong aroma of blue-cheese and butter (Pastorelli et al., Citation2003), while 2-pentanone has an ethereal, spicy and blue-cheese flavor (Purrinos et al., Citation2012), and 2-heptanone has spicy blue-cheese and acorn taste (Garcia-Gonzalez et al., Citation2008). shows that the relative content of ketones increased from 10% to 20% of the semi-finished meat after drying process, respectively. However, the subsequent high temperature baking process did not significantly change the relative content of ketones in the finished product, which indicated that the ketones were stable under heating conditions.
The relative content of esters increased from 3% in fermented to 9% in finished products after heating, respectively, which seem to be due to the esterification reaction in DPS caused by heating (Komorowska et al., Citation2009). shows there are four types of esters in finished meat, but no corresponding ester precursor compounds were found in the raw meat, such as propionic acid, butyric acid, acetic acid and ethanol. It is seemly caused by the non-polar chromatographic column used in the detection, which did not realize effective separation of polar compounds.
The acid compounds and aromatic compounds are relatively low in the finished products (), which means they have little influence on the flavor of DPS. Pyrazines are the predominate compounds in heterocyclic compounds in DPS. The relative content of them increased from 11% in semi-finished products before baking to 21% in finished products after curried. Pyrazines are produced by meat under high temperature condition, having strong aroma and lowly sensor threshold (Muller & Rappert, Citation2010). They are stable in final products at the end of maillard reaction and contribute greatly to the flavor of DPS (Muller & Rappert, Citation2010).
4. Conclusions
In this study, GC-IMS technique was used to detect the VOCs of DPS at different processing stages, and the GC-IMS fingerprint changes of DPS at different processing stages were established. GC-IMS was applied to detect baked meat for the first time. In this study, 37 kinds of VOCs were detected in DPS, which were mainly divided into 7 families of VOCs, such as alcohols, aldehydes, ketones, heterocyclic compounds, aromatic hydrocarbons and esters. Among them, aldehydes and alcohols accounted for the largest proportion, which are the main VOCs in DPS. The relative content of aldehydes and alcohols in DPS decreased gradually with processing stage, whereas that of heterocyclic esters and ketones increased gradually. This change indicates that the processing technology will change the VOCs of DPS. GC-IMS technology can effectively distinguish the volatile component differences of preserved meat samples at different processing stages. It is of profound significance to regulate and ensure the consistency of VOCs during processing DPS.
Supplemental Material
Download MS Word (1.9 MB)Acknowledgments
The study was supported by the National Natural Science Foundation of China (No. 31772056). Special thanks are given to Jiangsu shuangyu Food Co., Ltd for the production process and guidance for the experiment.
Disclosure statement
No potential conflict of interest was reported by the authors.
Additional information
Funding
References
- Arroyo-Manzanares, N., Martín-Gómez, A., Jurado-Campos, N., Garrido-Delgado, R., Arce, C., & Arce, L. (2018). Target vs spectral fingerprint data analysis of Iberian ham samples for avoiding labelling fraud using headspace - gas chromatography - ion mobility spectrometry. Food Chemistry, 246, 65. https://doi.org/10.1016/j.foodchem.2017.11.008
- Biller, E., Boselli, E., Obiedzinski, M., Karpinski, P., & Waszkiewicz-Robak, B. (2016). The profile of volatile compounds in the outer and inner parts of broiled pork neck is strongly influenced by the acetic-acid marination conditions. Meat Science, 121, 292–301. https://doi.org/10.1016/j.meatsci.2016.06.029
- Cavanna, D., Zanardi, S., Dall’Asta, C., & Suman, M. (2019). Ion mobility spectrometry coupled to gas chromatography: A rapid tool to assess eggs freshness. Food Chemistry, 271, 691–696. https://doi.org/10.1016/j.foodchem.2018.07.204
- Chen, T., Qi, X. P., Chen, M. J., & Chen, B. (2019). Gas chromatography-ion mobility spectrometry detection of odor fingerprint as markers of rapeseed oil refined grade. Journal of Analytical Methods in Chemistry, 2019, 1–8. https://doi.org/10.1155/2019/3163204
- Cheng, J. R., Liu, X. M., Zhang, Y. S., Zhang, Y. H., Chen, Z. Y., Tang, D. B., & Wang, J. Y. (2017). Protective effects of Momordica grosvenori extract against lipid and protein oxidation-induced damage in dried minced pork slices. Meat Science, 133, 26–35. https://doi.org/10.1016/j.meatsci.2017.04.238
- Dashmaa, D., Cho, B. W., Odkhuu, G., Park, K. M., Do, K. T., Lee, K. H., … Hwang, I. (2011). Meat quality and volatile flavor traits of duroc, berkshire and yorksire breeds. Korean Journal for Food Science of Animal Resources, 31(6), 807–816. https://doi.org/10.5851/kosfa.2011.31.6.807
- Dominguez, R., Purrinos, L., Perez-Santaescolastica, C., Pateiro, M., Barba, F. J., Tomasevic, I., Campagnol, P. C. B., & Lorenzo, J. M. (2019). Characterization of volatile compounds of dry-cured meat products using HS-SPME-GC/MS technique. Food Analytical Methods, 12(6), 1263–1284. https://doi.org/10.1007/s12161-019-01491-x
- Eiceman, G. A., & Karpas, Z. (2010). Ion mobility spectrometry (Second ed.). Taylor and Francis.
- Fang, Y., Jing, Z., Jing, L., Xing-pu, Q., Jie-ming, C., & Rui-jing, Z. (2018). Research on volatile flavor components in processing of dried pork slice. China Condiment, 43(2), 179-183+200. https://doi.org/10.3969/j..1000-9973.2018.02.043
- Gao, X., & Wang, R. (2015). Meat production technology. In L. Zhang (Ed.), Dried meat processing (pp. 171). Beijing: China Light Industry Press.
- Garcia-Gonzalez, D. L., Tena, N., Aparicio-Ruiz, R., & Morales, M. T. (2008). Relationship between sensory attributes and volatile compounds qualifying dry-cured hams. Meat Science, 80(2), 315–325. https://doi.org/10.1016/j.meatsci.2007.12.015
- Ge, S., Chen, Y., Ding, S., Zhou, H., Jiang, L., Yi, Y., & Wang, R. (2020). Changes in volatile flavor compounds of peppers during hot air drying process based on headspace-gas chromatography-ion mobility spectrometry (HS-GC-IMS). J Sci Food Agric, 100(7), 3087–3098. https://doi.org/10.1002/jsfa.10341
- Geng, J. T., Takahashi, K., Kaido, T., Kasukawa, M., Okazaki, E., & Osako, K. (2019). Relationship among pH, generation of free amino acids, and Maillard browning of dried Japanese common squid Todarodes pacificus meat. Food Chemistry, 283, 324–330. https://doi.org/10.1016/j.foodchem.2019.01.056
- Komorowska, M., Stefanidis, G. D., Gerven, T. V., & Stankiewicz, A. I. (2009). Influence of microwave irradiation on a polyesterification reaction. Chemical Engineering Journal, 155(3), 859–866. https://doi.org/10.1016/j.cej.2009.09.036
- Lapthorn, C., Pullen, F., & Chowdhry, B. Z. (2013). Ion mobility spectrometry-mass spectrometry (IMS-MS) of small molecules: Separating and assigning structures to ions. Mass Spectrometry Reviews, 32(1), 43–71. https://doi.org/10.1002/mas.21349
- Li, M. Q., Yang, R. W., Zhang, H., Wang, S. L., Chen, D., & Lin, S. Y. (2019). Development of a flavor fingerprint by HS-GC-IMS with PCA for volatile compounds of tricholoma matsutake singer. Food Chemistry, 290, 32–39. https://doi.org/10.1016/j.foodchem.2019.03.124
- Martin-Gomez, A., Arroyo-Manzanares, N., Rodriguez-Estevez, V., & Arce, L. (2019). Use of a non-destructive sampling method for characterization of Iberian cured ham breed and feeding regime using GC-IMS. Meat Science, 152, 146–154. https://doi.org/10.1016/j.meatsci.2019.02.018
- Muller, R., & Rappert, S. (2010). Pyrazines: Occurrence, formation and biodegradation. Applied Microbiology and Biotechnology, 85(5), 1315–1320. https://doi.org/10.1007/s00253-009-2362-4
- Pastorelli, G., Magni, S., Rossi, R., Pagliarini, E., Baldini, P., Dirinck, P., Van Opstaele, F., & Corino, C. (2003). Influence of dietary fat, on fatty acid composition and sensory properties of dry-cured Parma ham. Meat Science, 65(1), 571–580. https://doi.org/10.1016/S0309-1740(02)00250-4
- Petricevic, S., Radovcic, N. M., Lukic, K., Listes, E., & Medic, H. (2018). Differentiation of dry-cured hams from different processing methods by means of volatile compounds, physico-chemical and sensory analysis. Meat Science, 137, 217–227. https://doi.org/10.1016/j.meatsci.2017.12.001
- Pham, A. J., Schilling, M. W., Mikel, W. B., Williams, J. B., Martin, J. M., & Coggins, P. C. (2008). Relationships between sensory descriptors, consumer acceptability and volatile flavor compounds of American dry-cured ham. Meat Science, 80(3), 728–737. https://doi.org/10.1016/j.meatsci.2008.03.015
- Purrinos, L., Franco, D., Carballo, J., & Lorenzo, J. M. (2012). Influence of the salting time on volatile compounds during the manufacture of dry-cured pork shoulder “lacon”. Meat Science, 92(4), 627–634. https://doi.org/10.1016/j.meatsci.2012.06.010
- song, S. Q., Fan, L., Xu, X. D., Xu, R., Jia, Q., & Feng, T. (2019). Aroma patterns characterization of braised pork obtained from a novel ingredient by sensory-guided analysis and gas-chromatography-olfactometry. Foods, 8(3), 87. https://doi.org/10.3390/foods8030087
- Tong, C., Zhiyuan, W., Zhengyun, W., Daoli, L., & Bin, C. (2019). Identification of meat species by gas chromatography-ion mobility spectrometry and chemometrics. Chinese Journal of Food Science, 19(7), 221–226. https://doi.org/10.16429/j.1009-7848.2019.07.029
- Vautz, W., Franzke, J., Zampolli, S., Elmi, I., & Liedtke, S. (2018). On the potential of ion mobility spectrometry coupled to GC pre-separation – A tutorial. Analytica Chimica Acta,1024, 52–64.
- Xu, L., Cheng, J. R., Liu, X. M., & Zhu, M. J. (2019). Effect of microencapsulated process on stability of mulberry polyphenol and oxidation property of dried minced pork slices during heat processing and storage. Lwt-Food Science and Technology, 100, 62–68. https://doi.org/10.1016/j.lwt.2018.10.025