
ABSTRACT
In this study, chicken breast meat was hydrolyzed enzymatically to obtain chicken meat hydrolysate with its molecular weight to a large extent (98%) less than 3000 Da. The hydrolysate was capable of binding bile acids dose-dependently. The potential hypolipidemic effect of this hydrolysate was evaluated in high-fat-fed hamsters. Total free amino acids in the hydrolysate were seven times higher than those in the chicken meat. As compared with high-fat control, the inclusion of hydrolysate resulted in decreased concentrations of serum TG (by 16–34%) and TC (by 6–20%). The animals fed hydrolysate at a high dose exhibited 30% lower serum LDL-C levels and maintained a higher ratio of HDL-C/LDL-C (0.54) than those fed casein (0.36). Moreover, higher levels of hydrolysate inclusion were associated with increased outputs of fecal bile acid and total lipid, suggesting an association between hypocholesterolemic potential and bile acid binding capacity of the chicken hydrolysate.
RESUMEN
En el presente estudio se hidrolizó enzimáticamente carne de pechuga de pollo para obtener hidrolizado de carne de pollo con un peso molecular muy inferior (98%) a 3,000 Da. El hidrolizado pudo unir los ácidos biliares de modo dosis dependiente. Posteriormente, se evaluó el efecto hipolipidémico potencial de este hidrolizado en hámsteres alimentados con mucha grasa. Se verificó que, en el hidrolizado, el total de aminoácidos libres fue siete veces mayor que en la carne de pollo. En comparación con el control de alto contenido graso, la inclusión del hidrolizado dio lugar a una disminución de las concentraciones de TG (en 16-34%) y TC (en 6-20%) en el suero. Además, se constató que los animales alimentados con altas dosis de hidrolizado exhibieron niveles de LDL-C en suero 30% más bajos y mantuvieron una proporción más alta de HDL-C/LDL-C (0.54) que los alimentados con caseína (0.36). Asimismo, la inclusión de niveles más altos de hidrolizado se vinculó con un aumento de la producción de ácido biliar fecal y de lípidos totales, lo que sugiere una asociación entre el potencial hipocolesterolémico y la capacidad de unión de los ácidos biliares del hidrolizado de pollo.
1. Introduction
According to the World Health Organization (WHO), cardiovascular disease (CVD) has been rated as the number one cause of death globally in 2017. Hyperlipidemia, a term referring to elevated levels of blood cholesterol, triglyceride, and abnormalities of lipoproteins, has been strongly associated with the increased incidence of CVD (Howard & Udenigwe, Citation2013). Nelson (Citation2013) mentioned that the diagnosis and management of hyperlipidemia are ways to prevent CVD.
Pharmaceutical interventions are effective in the management of hyperlipidemia; however, many prescribed cholesterol-lowering drugs may cause side effects (Howard & Udenigwe, Citation2013). Many studies have attempted to explore alternatives with dietary intervention in the prevention of certain diseases. For instance, monacolin K produced by yeast rice extract would reduce the synthesis of cholesterol (Lee & Pan, Citation2012). Dietary fiber could deplete the reabsorption of bile acids in the intestine and decrease circulating blood cholesterol (Fuller et al., Citation2016). Yoshikawa et al. (Citation2000) also indicated that various bioactive peptides were able to reduce serum cholesterol levels.
Peptides have been known to possess various bioactivities, such as hypocholesterolemic activity, anti-microbial action, anti-hypertension, anti-oxidation, anti-inflammation, and immunomodulation (Yoshikawa et al., Citation2000). Different mechanisms have also been proposed to describe the functions of bioactive peptides. Iwami et al. (Citation1986) have mentioned that residual peptides from digestion might affect the secretion of hormones from the pancreas or gut to lower apolipoprotein and cholesterol levels. Immunomodulatory peptides derived from rice and soy protein hydrolysates might trigger non-specific immune defense through stimulating reactive oxygen species. The amphipathic structure of many antimicrobial peptides facilitated their interaction with cell walls and the membrane of microorganisms. Milk derived peptides reduced blood pressure in hypertensive subjects by inhibiting angiotensin-converting enzyme (Sánchez & Vázquez, Citation2017).
Processing chicken with high pressure and high temperature could produce bioactive peptides with anti-fatigue, anti-anxiety, and immunity-enhancing properties (Li et al., Citation2012). A classical approach to obtain peptides commercially is to hydrolyze protein with proteolytic enzymes. In our preliminary experiments, we have found that the hydrolysate derived from enzymatic hydrolysis of chicken breast meat displayed a promising bile acid binding ability. It was believed that the bile acid binding activities of this hydrolysate might confer a potential hypolipidemic effect.
The objective of the present study was to ascertain the hypolipidemic effect of chicken breast meat hydrolysates using hamsters as an animal model. The amino acid profiles and potential bile acid binding activity of chicken meat and its hydrolysate samples were investigated. Changes in serum lipid profiles, fecal, and hepatic parameters and histological analysis of liver tissue in hamsters after the consumption of these samples were also discussed.
2. Materials and methods
2.1. Sample preparation
Fresh chicken breast meat was minced and dispersed in deionized water at a ratio of 2:3 (w/v). The mixture was then divided into two portions. One portion was freeze-dried and ground to fine chicken meat powder (0.5 mm in size). The other portion was used to prepare chicken hydrolysate powder by enzymatic hydrolysis. Based on the methods of Lau et al., Citation2019, the hydrolysis process was performed enzymatically with ProtamexTM (Novo Nordisk A/S Co., Bagsvaerd, Denmark) at pH 8.5, 55°C for 5 h. The enzyme treatment was then terminated by boiling the mixture for 30 min. After lyophilization, the dried hydrolysate sample was finely ground to 0.5 mm in size. The crude protein contents of the dried chicken meat powder and hydrolysate powder were 82.6 g and 83.2 g/100 g, respectively, while their crude lipid contents were 8.38 g and 8.33 g/100 g, respectively.
2.2. Molecular weight distribution
Following the methods described by Lau et al., Citation2019, the molecular weight distribution of the hydrolysate sample was evaluated by high-performance liquid chromatography system (HPLC) equipped with a Superdex Peptide 10/300 GL column (300 × 10 mm, GE Healthcare Co., Little Chalfont, Buckinghamshire, UK). The sample was loaded onto the HPLC coupled to an ultraviolet detector at 214 nm, 30°C. The sample was eluted at a flow rate of 1 mL/min with a mobile phase composed of 10 mM Tris-hydrochloride, 0.15 mM sodium chloride (NaCl), and 5 mM calcium chloride (CaCl2). Gly-Pro (172.2 Da, Bachem AG, Bubendorf, Switzerland), Gly-Pro-Ala (243.2 Da, Bachem AG), Gly-Pro-Hyp (285.3 Da, Bachem AG), pullulan P-5 (6200 Da, Showa Denko, Tokyo, Japan), and pullulan P-10 (10000 Da, Showa Denko) were used as the molecular weight markers.
2.3. Total amino acid profile
Total amino acid profiles of chicken meat and its hydrolysate powder were determined according to Simpson et al. (Citation1976). Samples were hydrolyzed by 4 N methane sulfonic acid at 115°C for 24 h and the amino acid profiles were examined with an amino acid analyzer (L-8900, Hitachi Co., Tokyo, Japan).
2.4. Free amino acids, carnosine, and anserine
Based on the methods of H. C. Wu et al. (Citation2003), samples were mixed with trichloroacetic acid (10%, v/v) at a ratio of 1:4 (w/v) and homogenized for 2 min. After filtration, the residues were again homogenized with trichloroacetic acid and filtered. Free amino acids, anserine, and carnosine in the filtrates were analyzed by an amino acid analyzer.
2.5. In vitro bile acid binding capability
The bile acid binding capacity of the hydrolysate sample at different concentrations was evaluated based on the procedures described by Pérez-Gálvez et al. (Citation2015) and S. C. Wu et al. (Citation2009) with modifications. Hydrolysate sample (6.25–100 mg) was mixed with 1 ml of 0.01 N hydrochloric acid for 1 h in a water bath at 37°C, and adjusted to pH 7.0 with 0.1 N sodium hydroxide solution. Subsequently, 4 ml of bile acid solution (2 mM; T-0750, Sigma Chemical Co., USA) was added into the mixture and incubated at 37°C for 1 h. After centrifugation at 10860 × g for 1 h, the supernatant was mixed with 0.75 mL of 0.133 M Tris-HCl buffer, 0.5 mL of 1 M hydrazine hydrate solution, 0.15 mL of 7 mM β-nicotinamide adenine dinucleotide solution (NAD+), and 0.05 mL of hydroxysteroid dehydrogenase solution. After incubation at 37°C for another hour, all samples were determined spectrophotometrically at 340 nm. Cholestyramine (6.25 mg/mL), a well-known bile acid sequestrant, was employed as a positive control for this analysis.
2.6. Diets and experimental design
The study protocol was approved by the Animal Care and Use Committee of National Chung Hsing University. A total of 48 male Golden Syrian hamsters (7-week-old) were obtained from the National Laboratory Animal Centre (Taipei, Taiwan) and cared in accordance with the institutional guidelines. All animals were housed individually in a stainless steel screen-bottomed cage and placed in a room maintained at 22 ± 2ºC with a 12 h light/dark cycle. Animals were given free access to food and water throughout the whole experiment. After a 2-week acclimation period, the hamsters weighing 125.3 ± 8.1 g were divided into eight weight classes of six each. The animals in each weight classes were randomly assigned to the six diet groups and were fed their corresponding diets, including normal control (NC), high-fat (HF) control, chicken meat (CM), hydrolysate at low-dose (hydrolysate-L), hydrolysate at medium-dose (hydrolysate-M), and hydrolysate at high-dose (hydrolysate-H) diets.
As shown in , the NC, HF control, CM, and three hydrolysate diets were prepared based on the AIN93-M formulation (Reeves et al., Citation1993). All high-fat diets were prepared by modifying the NC diet to provide fat and cholesterol at a level of 14 g/100 g and 0.2 g/100 g, respectively (). The CM diet was prepared by replacing casein in the HF control diet with chicken meat to provide a total of 12.6 g of protein per 100 g of diet. The hydrolysate-L, hydrolysate-M, and hydrolysate-H diets were formulated by replacing 25%, 50%, and 100% of chicken meat, respectively, in the CM diet with hydrolysate powder.
Table 1. Composition of the six experimental diets.
Tabla 1. Composición de las seis dietas experimentales.
During the 8-week experimental period, food intakes and body weights were recorded every alternate day. Feces were collected on the last three days of the experiment and stored at −20ºC until analyzed. At the end of the experiment, all hamsters were sacrificed after 12 h of food deprivation. Blood samples were collected from orbital sinus, and serum was prepared for biochemical analysis. The liver was eviscerated and divided into two portions. One portion of the liver was fixed in 10% formalin solution for 48 h and stained with hematoxylin and eosin (H&E) for the histological examination. The remaining portion was analyzed for total lipid content in the liver.
2.7. Determination of serum cholesterol and triglycerides
The concentrations of serum total cholesterol (TC; cat. No. 1 1300 99 10 023, DiaSys Diagnostic Systems GmbH, Holzheim, Germany), triglyceride (TG; cat. No. 1 5710 99 10 023, DiaSys Diagnostic Systems GmbH, Holzheim, Germany), high-density lipoprotein cholesterol (HDL-C; cat. No. 1 3540 99 90 885, DiaSys Diagnostic Systems GmbH, Holzheim, Germany), and low-density lipoprotein cholesterol (LDL-C; BXC0432A, Fortress Diagnostics Limited, Antrim, UK) were measured enzymatically by using commercial kits.
2.8. Determination of liver and fecal lipids
Liver and fecal samples were freeze-dried and ground into powder. Based on the methods of S. C. Wu et al. (Citation2009) with slight modifications, 0.2 g of grinded sample was homogenized with 1.5 mL of methanol. Lipids in the homogenate were further extracted with a mixture of hexane and NaCl aqueous solution (2:1, v/v). The total lipids were quantified gravimetrically after the evaporation of solvent with nitrogen gas.
2.9. Determination of fecal bile acid
According to the methods described by Beher et al. (Citation1981), fecal bile acid extracts were prepared by refluxing the fecal samples with boiling ethanol (2:7, v/v). After centrifugation at 3100 × g for 10 min, the fecal bile acid content in the extract was determined with a spectrophotometer at 340 nm following the enzymatic methods described in section 2.5.
2.10. Statistical analysis
All results were presented as mean ± standard deviation (SD). Data were analyzed by one-way ANOVA with the use of statistical analysis system (version 20.0; SPSS, Armonk, NY, USA) to determine statistical significance among groups. p values <.05 were considered to be statistically significant.
3. Results and discussion
3.1. Characteristics of samples
The molecular weight of peptides and protein hydrolysates is an important factor that influences their bioactivities and absorption efficiencies (Jin et al., Citation2016). presents the content of each molecular weight range in the chicken hydrolysate sample. A majority of peptide components (approximately 98%) in the hydrolysate were found to have a molecular weight of less than 3000 Da.
Table 2. Molecular weight distribution of chicken hydrolysate.
Tabla 2. Distribución del peso molecular del hidrolizado de pollo.
The total and free amino acid compositions of both lyophilized chicken meat and hydrolysate samples are shown in . Regarding the total amino acid profiles, the chicken meat and hydrolysate samples possessed all the essential amino acids and their total contents were 35905 and 36392 mg/100 g, respectively. The ratio of total essential amino acids to total amino acids for both chicken meat and hydrolysate samples (close to 0.44) was comparable to the findings on chicken breast meat as reported by Sun et al. (Citation2011). The results in total amino acids demonstrated that the underlying enzymatic hydrolysis did not result in apparent changes in the amino acid profiles between these samples.
Table 3. Amino acid profiles (mg/100 g) of chicken meat and chicken hydrolysate.
Tabla 3. Perfiles de aminoácidos (mg/100 g) de la carne de pollo y el hidrolizado de pollo.
As indicated in , the total amounts of free amino acids in the chicken meat and hydrolysate were 2197 and 15754 mg/100 g, respectively, demonstrating that the enzymatic hydrolysis process could efficiently release up to seven times more free amino acids from the chicken meat. The six predominant free amino acids in the chicken hydrolysate were glutamic acid, leucine, alanine, phenylalanine, lysine, and arginine. reveals that the concentrations of free amino acids (excluding tryptophan and cystine) in the chicken hydrolysate were nearly 1 to 31 times higher than those in the chicken meat. It was worth noting that the contents of cystine and tryptophan in the hydrolysis increased dramatically from undetectable levels to 145 and 205 mg/100 g, respectively. The particular changes in the free amino acid profile after hydrolysis might be attributed to the selectivity of the Protamex protease being used in this study. Moreover, the analysis of free amino acids revealed that the concentrations of anserine and carnosine in chicken meat were 1336 and 1102 mg/100 g, respectively, while chicken hydrolysate contained 4520 and 1325 mg/100 g, respectively.
3.2. In vitro bile acid binding capacity
Hypocholesterolemic activities of various samples such as soy protein peptic hydrolysate and digestion-resistant polysaccharides have been associated with their bile acid binding capacities (Nagaoka et al., Citation1999; Zhou et al., Citation2006). In vitro assay has been an efficient way to estimate the ability of a particular ingredient to bind bile acids (Zhou et al., Citation2006). presents the bile acid binding capacity of chicken hydrolysate at different concentrates (6.25–100 mg/mL) in comparison with cholestyramine as a positive control. The above concentrations were designated to cover the typical protein content (50 to 100 mg/mL) in most commercial chicken essence products. In the present study, the ability of each mg of cholestyramine to sequestrate 0.67 mg of bile acids was regarded as 100%. All the hydrolysate samples at different concentrations were capable of binding bile acids to different extents (20.5–98.2%). As compared to the cholestyramine, the same concentration of hydrolysate (6.25 mg/mL) exhibited only one-fifth of the bile acid binding capacity. An upward trend in the total amounts of bile acids bound to the hydrolysate was observed as its concentration increased. At 100 mg/mL, chicken hydrolysate could achieve comparable binding ability as cholestyramine.
Figure 1. Relative in vitro bile acid binding capacity of chicken hydrolysates at different concentrations.a-e Means with different letters are significantly different (p < 0.05).
Figura 1. Capacidad relativa de fijación de ácidos biliares in vitro de hidrolizados de pollo a diferentes concentraciones.a-e Las medias con diferentes letras son significativamente diferentes (p < 0.05).
Hydrophobic, aromatic (i.e. tyrosine, tryptophan, and phenylalanine), and sulfur containing (i.e. cysteine and methionine) amino acids have been reported to bind with bile acids (Siow et al., Citation2016). The in vitro observations on the bile acid binding capacity were speculated to be in part related to the remarkably higher amounts of these free amino acids in the hydrolysate samples.
3.3. Serum lipid profiles
All animals were healthy throughout the whole experiment. There were no differences in the average daily food intakes (ranging from 6.31 to 6.56 g/day) among all groups. The body weight gains (9.7–17.3 g) of the hamsters among different high-fat diet groups were comparable to each other. shows the changes in various serum lipid parameters, including the concentrations of serum TG, TC, HDL-C, and LDL-C as well as the ratio of HDL-C/LDL-C among the six dietary groups. As the dietary fat content was increased from 4 g/100 g to 14 g/100 g, the concentrations of serum TG and TC were elevated by 156% and 174%, respectively. The replacement of casein with chicken meat entirely in the diet did not result in statistically differences in the serum TG and TC levels between HF control and CM groups (). Compared with the HF control group, the inclusion of chicken hydrolysate into the high-fat diet was, however, capable of lowering the serum TG and TC levels by 16–34% and 6–20%, respectively. In particular, significant (p < .05) reductions in serum TG and TC levels were observed in animals fed hydrolysate-M and hydrolysate-H diets.
Table 4. Changes in serum lipid profiles among different dietary groups.
Tabla 4. Cambios en los perfiles de lípidos séricos entre los diferentes grupos dietéticos.
The average concentrations of serum HDL-C among the animals given high-fat diets ranged from 55.6 to 58.2 mg/dL. No apparent differences in HDL-C levels were noted among the five high-fat dietary groups. As for the average serum LDL-C levels, the administration of hydrolysate-H diet resulted in a 30% reduction. It was observed that the higher was the substitution ratio of hydrolysate, the lower was the serum LDL-C levels. LDL-C concentrations and lipoprotein ratios, especially HDL-C/TC and HDL-C/LDL-C ratios, are important indexes for CVDs (Millán et al., Citation2009). Taking the hydrolysate at a high dose significantly (p < .05) reduced TC level (−20%) in accompany with a higher ratio of HDL-C/LDL-C (0.54) relative to the HF control (0.36), suggesting the potential of chicken hydrolysate to alleviate hyperlipidemia.
Bile acids are synthesized from cholesterol in the liver and are reabsorbed in the terminal ileum. When bile acids were bound to sequestrants, the reabsorption of bile acids was disrupted as they would form insoluble complexes, which were eventually excreted in the feces. In order to compensate for the loss of bile acids, hepatic cholesterol was degraded and converted to bile acids, leading to the reduction of serum LDL-C (Howard & Udenigwe, Citation2013; Insull, Citation2006). It was inferred that the reduction in serum cholesterol and triglyceride levels by administrating both the hydrolysate-M and hydrolysate-H diets might be partly associated with the in vitro bile acid binding capability of hydrolysate ().
3.4. Liver total lipids and histology
After 8 weeks of feeding, an apparently (p < .05) higher concentration of liver total lipids was measured in animals fed high-fat diets than the NC group (). As compared to the HF control and CM groups (334.4–359.0 mg/g), the administration of hydrolysate-H diet could render a significantly (p < .05) lower level of liver total lipids (305.9 mg/g). Fat accumulation in the liver was associated with the elevations in serum TG and LDL-C levels (Fon Tacer & Rozman, Citation2011). It was therefore observed that the decreased levels of serum TC and TG in the hydrolysate-H group () were accompanied with the reduction in liver total lipids.
Figure 2. Variations in (A) total lipids and (B) histological analysis (400X) of livers among different dietary groups. CV represents the central vein.a-d Means with different letters are significantly different (p < 0.05).
Figura 2. Variaciones en (A) lípidos totales y (B) análisis histológico (400X) de los hígados entre los diferentes grupos dietéticos. CV significa vena central.a-d Las medias con diferentes letras son significativamente diferentes (p < 0.05).
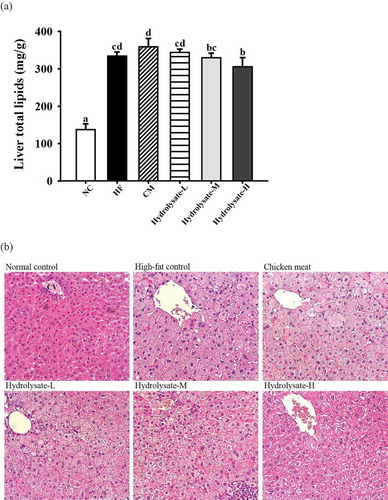
presents the histology examination of the liver among different dietary groups. No abnormalities were observed in the hepatocytes of the NC group. In the liver of the HF control group, the hepatocytes around the central vein were generally swollen and deposited with abundance of fat. The high levels of serum cholesterol might contribute to steatohepatitis in animal models of hyperlipidemia (Wouters et al., Citation2008). The hydrolysate-treated hamsters demonstrated improvement in lipid accumulations, especially those fed hydrolysate-M and hydrolysate-H diets.
3.5. Fecal total lipids and fecal bile acid
reveals the fecal total lipids and bile acid excreted by hamsters fed different diets. Upon supplementing higher amounts of hydrolysate sample, there was an increasing trend of lipid excretion in feces. Parallel to the reduction in serum and liver lipid levels (, ), animals fed a high dose of hydrolysate showed significant (p < .05) elevation in fecal total lipid output (36.7 mg/day) than those of the other four high-fat groups (25.4–33.1 mg/day).
Table 5. Changes in fecal total lipids and bile acid among different dietary groups.
Tabla 5. Cambios en los lípidos fecales totales y los ácidos biliares entre los diferentes grupos alimentarios.
As indicated in , there was also a positive relationship between hydrolysate consumption and fecal bile acid excretion. The replacement of casein in the high-fat diets with chicken meat or hydrolysate to different extents would enhance the excretion of bile acids (14–170%). It was worth mentioning that the more hydrolysate was consumed, the more fecal bile acid was excreted. Previous findings from Hosomi et al. (Citation2011) have also demonstrated that fish protein was capable of lowering serum cholesterol levels through the elevated excretion in fecal cholesterol and bile acids.
4. Conclusion
The present study demonstrated that the enzymatic hydrolysis treatment of chicken meat could produce hydrolysate with small molecular weight (mostly <3000 Da) as well as a higher amount of free amino acids. The hydrolysate exhibited an apparent in vitro bile acid binding capacity dose-dependently. The consumption of this hydrolysate, especially at medium and high doses, could significantly (p < .05) lower the levels of serum TG, TC, and LDL-C, meanwhile it also rendered significant (p < .05) increases in the fecal excretion of bile acids. These results suggested that the hypocholesterolemic activity of the chicken hydrolysate might be attributed to its ability to bind bile acids and increased bile acids excreted.
Author contributions
Conceptualization, C.F.C., P.T.W., and Y.Q.L.; Methodology, P.T.W., Y.Q.L., and F.J.D.; Formal Analysis, P.T.W., Y.Q.L., and F.J.D.; Investigation, P.T.W.; Y.Q.L. and F.J.D.; Resources, C.F.C. and H.Y.K.; Data Curation, P.T.W., Y.Q.L., and J. T. L.; Writing – Original Draft Preparation, P.T.W. and Y.Q.L.; Writing – Review & Editing, C.F.C., P.T.W., and Y.Q.L. and F.J.D.; Visualization, C.F.C. and J.T.L.; Supervision, C.F.C.; Project Administration, C.F.C. All authors have read and agreed to the published version of the manuscript.
Figure S1
Download MS Word (41 KB)Acknowledgments
The authors gratefully acknowledge the support of the Ministry of Science and Technology of Taiwan, R.O.C. (MOST 106-2320-B-005-006-MY3).
Disclosure statement
No potential conflict of interest was reported by the authors.
References
- Beher, W. T., Stradnieks, S., Lin, G. J., & Sanfield, J. (1981). Rapid analysis of human fecal bile acids. Steroids, 38(3), 281–295. https://doi.org/10.1016/0039-128x(81)90064-7
- Fon Tacer, K., & Rozman, D. (2011). Nonalcoholic Fatty liver disease: Focus on lipoprotein and lipid deregulation. Journal of Lipids, 2011, 1–14. https://doi.org/10.1155/2011/783976
- Fuller, S., Beck, E., Salman, H., & Tapsell, L. (2016). New horizons for the study of dietary fiber and health: A review. Plant Foods for Human Nutrition, 71(1), 1–12. https://doi.org/10.1007/s11130-016-0529-6
- Hosomi, R., Fukunaga, K., Arai, H., Kanda, S., Nishiyama, T., & Yoshida, M. (2011). Fish protein decreases serum cholesterol in rats by inhibition of cholesterol and bile acid absorption. Journal of Food Science, 76(4), 116–121. https://doi.org/10.1111/j.1750-3841.2011.02130.x
- Howard, A., & Udenigwe, C. C. (2013). Mechanisms and prospects of food protein hydrolysates and peptide-induced hypolipidaemia. Food and Function, 4(1), 40–51. https://doi.org/10.1039/c2fo30216k
- Insull, J. W. (2006). Clinical utility of bile acid sequestrants in the treatment of dyslipidemia: A scientific review. Southern Medical Journal, 99(3), 257–274. https://doi.org/10.1097/01.smj.0000208120.73327.db
- Iwami, K., Sakakibara, K., & Ibuki, F. (1986). Involvement of post-digestion hydrophobia peptides in plasma cholesterol-lowering effect of dietary plant proteins. Agricultural and Biological Chemistry, 50(5), 1217–1222. https://doi.org/10.1080/00021369.1986.10867551
- Jin, J., Ma, H., Wang, B., Yagoub, A. E. G. A., Wang, K., He, R., & Zhou, C. (2016). Effects and mechanism of dual-frequency power ultrasound on the molecular weight distribution of corn gluten meal hydrolysates. Ultrasonics Sonochemistry, 30, 44–51. https://doi.org/10.1016/j.ultsonch.2015.11.021
- Lau, Y. Q., Dai, F. J., Wu, P. T., Chuah, L., Kao, H. Y., & Chau, C. F. (2019). Enhancement of physical stamina upon the consumption of chicken protein hydrolysate with different molecular weight distribution. Taiwanese Agriculture Chemistry and Food Science, 57(5,6), 1–9. https://doi.org/10.6578/TJACFS.201912_57(5_6).0006
- Lee, C. L., & Pan, T. M. (2012). Development of Monascus fermentation technology for high hypolipidemic effect. Applied Microbiology and Biotechnology, 94(6), 1449–1459. https://doi.org/10.1007/s00253-012-4083-3
- Li, Y. F., He, R. R., Tsoi, B., & Kurihara, H. (2012). Bioactivities of chicken essence. Journal of Food Science, 77(4), 105–110. https://doi.org/10.1111/j.1750-3841.2012.02625.x
- Millán, J., Pintó, X., Muñoz, A., Zúñiga, M., Rubiés-Prat, J., Pallardo, L. F., Masana, L., Mangas, A., Hernández-Mijares, A., González-Santos, P., Ascaso, J. F., & Pedro-Botet, J. (2009). Lipoprotein ratios: Physiological significance and clinical usefulness in cardiovascular prevention. Vascular Health and Risk Management, 2009, 757–765. https://doi.org/10.2147/VHRM.S6269
- Nagaoka, S., Miwa, K., Eto, M., Kuzuya, Y., Hori, G., & Yamamoto, K. (1999). Soy protein peptic hydrolysate with bound phospholipids decreases micellar solubility and cholesterol absorption in rats and Caco-2 cells. The Journal of Nutrition, 129(9), 1725–1730. https://doi.org/10.1093/jn/129.9.1725
- Nelson, R. H. (2013). Hyperlipidemia as a risk factor for cardiovascular disease. Primary Care: Clinics in Office Practice, 40(1), 195–211. https://doi.org/10.1016/j.pop.2012.11.003
- Pérez-Gálvez, R., García-Moreno, P. J., Morales-Medina, R., Guadix, A., & Guadix, E. M. (2015). Bile acid binding capacity of fish protein hydrolysates from discard species of the West Mediterranean Sea. Food and Function, 6(4), 1261–1267. https://doi.org/10.1039/c4fo01171f
- Reeves, P. G., Nielsen, F. H., & Fahey,,. G. C., Jr. (1993). AIN-93 purified diets for laboratory rodents: Final report of the American Institute of Nutrition ad hoc writing committee on the reformulation of the AIN-76A rodent diet. The Journal of Nutrition, 123(11), 1939–1951. https://doi.org/10.1093/jn/123.11.1939
- Sánchez, A., & Vázquez, A. (2017). Bioactive peptides: A review. Food Quality and Safety, 1(1), 29–46. https://doi.org/10.1093/fqs/fyx006
- Simpson, R. J., Neuberger, M. R., & Liu, T. Y. (1976). Complete amino acid analysis of proteins from a single hydrolysate. Journal of Biological Chemistry, 251(7), 1936–1940. https://www.jbc.org/content/251/7/1936.long
- Siow, H. L., Choi, S. B., & Gan, C. Y. (2016). Structure–activity studies of protease activating, lipase inhibiting, bile acid binding and cholesterol-lowering effects of pre-screened cumin seed bioactive peptides. Journal of Functional Foods, 27, 600–611. https://doi.org/10.1016/j.jff.2016.10.013
- Sun, T., Liu, Z. Y., & Long, R. J. (2011). Amino acid and mineral composition of meat from free-range broilers reared on alpine steppe. Journal of Agricultural Science and Technology B, 1(8), 1196–1199. http://www.airitilibrary.com/Publication/alDetailedMesh?docid=21616264-201112-201205070015-201205070015-99-102
- Wouters, K., van Gorp, P. J., Bieghs, V., Gijbels, M. J., Duimel, H., Lütjohann, D., Kerksiek, A., Kruchten, R. V., Maeda, N., Staels, B., van Bilsen, M., Shiri‐Sverdlov, R., & Hofker, M. H. (2008). Dietary cholesterol, rather than liver steatosis, leads to hepatic inflammation in hyperlipidemic mouse models of nonalcoholic steatohepatitis. Hepatology, 48(2), 474–486. https://doi.org/10.1002/hep.22363
- Wu, H. C., Chen, H. M., & Shiau, C. Y. (2003). Free amino acids and peptides as related to antioxidant properties in protein hydrolysates of mackerel (Scomber austriasicus). Food Research International, 36(9), 949–957. https://doi.org/10.1016/s0963-9969(03)00104-2
- Wu, S. C., Wu, S. H., & Chau, C. F. (2009). Improvement of the hypocholesterolemic activities of two common fruit fibers by micronization processing. Journal of Agricultural and Food Chemistry, 57(12), 5610–5614. https://doi.org/10.1021/jf9010388
- Yoshikawa, M., Fujita, H., Matoba, N., Takenaka, Y., Yamamoto, T., Yamauchi, R., Tsuruki, H., & Takahata, K. (2000). Bioactive peptides derived from food proteins preventing lifestyle‐related diseases. Biofactors, 12(1), 143–146. https://doi.org/10.1002/biof.5520120122
- Zhou, K., Xia, W., Zhang, C., & Yu, L. L. (2006). In vitro binding of bile acids and triglycerides by selected chitosan preparations and their physico-chemical properties. LWT-Food Science and Technology, 39(10), 1087–1092. https://doi.org/10.1016/j.lwt.2005.07.009