
 ?Mathematical formulae have been encoded as MathML and are displayed in this HTML version using MathJax in order to improve their display. Uncheck the box to turn MathJax off. This feature requires Javascript. Click on a formula to zoom.
ABSTRACT
Oats (Avena sativa L.) with similar amylose content were used to investigate the effects of ultra-high pressure treatment (UHPT) on the eating quality of steamed oat and oat protein structure. Water absorption and texture of steamed oat were evaluated and taste analysis was conducted by electronic tongue after a series of UHPT (400–600 MPa; holding time 5–15 min). The oat protein was extracted from the oat and treated with the same UHPT as the steamed oat (400–600 MPa; holding time 5–15 min). The oat protein structure was scanned by scanning electron microscopy (SEM). The water absorption rate of oat rice was increased by UHPT. Hardness values of steamed oat were reduced while springiness and cohesiveness were increased by UHPT. The UHPT samples showed significant differences in electronic tongue profiles from that of the original samples. The SEM results indicated that the structure of the protein was greatly affected by UHPT. The impact on protein structure significantly increased with an increasing level of pressure and treatment time. In general, the UHPT has strong potential to improve the texture and flavor of oat and change the structure of oat protein during industrial production.
RESUMEN
En el presente estudio se utilizó avena (Avena sativa L.) con un contenido similar de amilosa para investigar los efectos provocados por el tratamiento de ultra alta presión (UHPT) en la calidad de consumo de avena al vapor y la estructura de la proteína en la misma. Así, se evaluaron la absorción de agua y la textura de la avena cocida al vapor, realizándose un análisis del sabor mediante lengua electrónica después de aplicar una serie de UHPT (400-600 MPa; tiempo de espera: 5-15 minutos). La proteína de avena fue extraída de la avena y tratada con el mismo UHPT que la avena cocida al vapor (400-600 MPa; tiempo de espera: 5-15 minutos). Luego se escaneó la estructura de la proteína de avena empleando microscopía electrónica de barrido (SEM), constatándose que la tasa de absorción de agua del arroz de avena se incrementó tras el tratamiento con UHPT. Asimismo, se comprobó que los valores de dureza de la avena cocida al vapor se redujeron, mientras que su elasticidad y cohesividad aumentaron con el UHPT. En comparación con las muestras originales, las muestras tratadas con UHPT mostraron diferencias significativas en los perfiles establecidos por la lengua electrónica. Los resultados de la SEM indicaron que la estructura de la proteína se vio muy afectada por el UHPT. El impacto sobre la estructura de la proteína aumentó significativamente al aumentar el nivel de presión y el tiempo de tratamiento. En general, se evidencia que el UHPT tiene un fuerte potencial para mejorar la textura y el sabor de la avena, así como para modificar la estructura de la proteína de la avena durante la producción industrial.
KEYWORDS:
PALABRAS CLAVE:
1. Introduction
For a long time, people consume refined white rice as the staple food in China in general. The long-term consumption of refined white rice often leads to a lack of various nutrients, nutrient imbalance, at the same time, accompanied by hypertension, diabetes, and other chronic diseases due to the single nutrient source (Bouis et al., Citation2003). The nutritional value of oats was accepted earlier than other cereals and oat naturally contains a high content of valuable nutrients, such as soluble fiber, protein, unsaturated fatty acids, vitamins, minerals, and antioxidants (Chu et al., Citation2013; Lásztity, Citation1998; Peterson, Citation2001).
At present, UHPT is widely used in the field of food processing, there are already commercial foods such as jam, oyster, lobster, ham, rice, and so on. In recent years, more and more attention has been paid to the application of UHPT in grain products. The research of UHPT mainly around the modification of grain starch and protein also involves the physical and chemical characteristics related to its flavor and nutritional value. Researchers found that metabolic response to UHPT during germination could significantly improve functional and quality characteristics of wholegrain brown rice products (Xia et al., Citation2018). H. Y. Li et al. (Citation2020) took a method to improve the stickiness of nonglutinous rice by high-pressure homogenization and try to expand the application potential of rice products by modification of rice stickiness. Lee and Koo (Citation2019) found that the quality and properties of low-protein wheat noodles were improved by high hydrostatic pressure. The investigation results showed that HPT could significantly improve the water absorption rate, color, and cooked texture of brown rice (Y. Yu et al., Citation2017).
The eating qualities of rice mainly include appearance, palatability, odor, and taste. The palatability refers to the physical properties of rice, such as hardness, gumminess, and so on. The physical properties of rice are considered to be the primary evaluation index of rice-eating quality, as it can reflect its texture and organizational structure (C.H. Liu et al., Citation2008).
One of the main components of oat is starch, and the amylose content is the main factor affecting the taste quality. Hence, it may be related to the starch characteristics of different varieties of oats (Wang et al., Citation2016). In order to minimize the influence of different amylose content on the result, oat with similar amylose content was selected as research materials. Therefore, the objective of this study was to investigate the effect of UHPT on the water absorption, the cooked texture of oat rice, and protein structure of oat. The purpose is to improve the taste of steamed oat and preliminary explore if there is a correlation to its protein modification.
2. Materials and methods
2.1. Materials
Oats [seven varieties: Meng Yan2 (MY2), Meng Yan3 (MY3), Yan Ke2 (YK2), Bai Yan2 (BY2), Nei Yan5 (NY5), Ba You18 (BY18), Cao You1(CY1)] were supplied from Inner Mongolia Academy of Agricultural & Animal Husbandry Sciences, which were harvested in 2019 and stored in a refrigerator at 4°C until use. Amylose standard (Sigma, potato source), purchased from Shanghai Yuanye Bio-Technology Co., Ltd. Iodine, potassium iodide, hydrochloric acid, sodium hydroxide, potassium hydroxide, potassium chloride, tartaric acid, and ethanol were analytical-grade, purchased from Tianjin Yongda Chemical Regent Co., LTD.
2.2. Ultrahigh pressure treatment
UHPT was conducted in a laboratory-scale ultrahigh-pressure processing unit (UHPP-600-5 L, Kefa High Pressure Food Processing Inc., Baotou, China) with a 5 L cylindrical pressure chamber capable of operating at pressure-selected levels up to a maximum of 600 MPa.
The UHPP steps are as follows:
10 g oat was weighed and vacuum packed in a food-grade polyethylene bag (7 cm×12 cm, Manufactured in China, Dongguan, China) with 16 mL of distilled water. 3 g oat protein was weighed packed in a food-grade polyethylene bag (7 cm×10 cm, Manufactured in China, Dongguan, China) with 1.2 mL of distilled water.
After mixing, vacuum sealed and soaked for 4 h.
One pressure treatment was applied at a time, respectively, at 400, 500, or 600 MPa for 5, 10, or 15 min (holding time) at 20°C. The unit was pressurized at a rate of approximately 50 MPa/s, depressurized at 100 MPa/s.
Transferred oat after UHPP from polyethylene bag to a small beaker, added distilled water (1:3 ratio), and put the beaker into the boiling water pot, cooked at 160°C for 20 min. The oat protein extract was placed into a plate and lyophilized after UHPP.
2.3. Protein extraction
Pretreatment of grounded oat flour, including sifting and defatting steps adopted the method published in (Ma et al., Citation2020). 500 g of defatted oat flour was suspended in 6500 mL of distilled water, and the pH was adjusted to 10.5. The mixture was stirred and incubated for 1.7 h at 45°C after resting for 10 min. The combination of oat flour and alkali solution was centrifuged at 2683 × g for 20 min, and the supernatant was gathered, then the pH was adjusted to 4.0 by 1 M hydrochloric acid and followed by centrifugation at 2683 × g for 20 min after resting 10 min, the precipitates were rinsed using deionized water. The protein isolate was lyophilizated and kept at −20°C (Ma et al., Citation2020).
2.4. Determination of texture characteristics of oat rice
Physical properties of steamed oat were conducted as described by Deng (Citation2012) with the following test parameter settings: take 3 oat rice and put them in the shape of letter “m,” used P/36 R cylindrical probe, the compression ratio of 70%, the compression rate of 0.5 mm/s, rising height at 20 mm. Each sample was measured six times, and the average value of the four results was determined as the final results after removing the maximum and minimum values. The evaluated indexes were hardness, springiness, and cohesiveness, respectively.
2.5. Electronic tongue (E-tongue) analysis
Taste analyses were performed with a commercial E-tongue, Taste-Sensing System (SA402B, Intelligent Sensor Technology Inc., Japan) equipped with an array of chemical sensors. About 5 g oat was weighed and cooked as described in the method, 50 mL distilled water was added on the steamed oat and soaked were performed for 30 min. After filtration, the filtrate was ready for further use. E-tongue analysis was conducted in accordance with the method described by Cai et al. (Citation2019).
2.6. Water absorption
The water absorption rate (WAT) of steamed oat test samples was measured according to the method of Y. Yu et al. (Citation2017) with some modifications. For this test, the steamed oat (with and without UHPT) was taken out of the beakers and immediately wrapped in a filter paper to remove the excess surface water and then weighed. All measurements were triplicated. The following equation was used to calculate the WAT.
Where WAT is the water absorption rate of the sample, W1 is the initial weight of the sample without treatment (g), and W2 is the weight of the treated sample (g).
2.7. Scanning electron microscopy (SEM)
A scanning electron microscope (TM4000Plus) was used to measure the morphological properties of oat protein according to the method of Tian et al. (Citation2014) with minor modifications. The freeze-dried oat protein sample, before and after UHPT, was cracked, mounted on a metallic stub and coated with a thin film of gold (10 nm) in a vacuum evaporator and observed under the microscope and photographed.
2.8. Amylose content determination (dual-wavelength spectrophotometry)
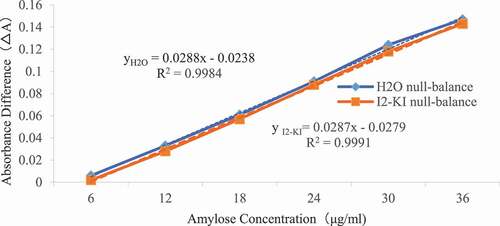
a. Making dual-wavelength amylose standard curve
0.3, 0.5, 0.7, 0.9, 1.1, and 1.3 mL of amylose standard solution with concentration of 1 mg/mL was pipetted in 6 different 50 mL volumetric flasks, respectively. 30 mL distilled water was added, pH was adjusted to 3.5 with 0.1 M HCl, 0.5 mL iodine was added, and then distilled water was added to constant volume. After 20 min of resting, A λ 1 and A λ 2 were determined with a 1 cm cuvette at two wavelengths of λ 1 and
λ 2 (according to the reference, the determination wavelength of λ 1 was 630 nm, and the reference wavelength of λ 2 was 480 nm), respectively. The distilled water was used as blank, the value of Δ A = A λ1- A λ 2. The double wavelength amylose standard curve was constructed using the Δ A as y-axis and the amylose content (mg) as the x-axis.
Figure 1. Standard curve of amylose.
Figura 1. Curva estándar de la amilosa
b. Determination of amylose in samples
The sample was sifted through a 60 mesh sieve, defatted by n-hexane, 0.1 g defatted sample was weighed (accurate to 1 mg), and placed in a 50 mL volumetric flask.
About 10 mL of 0.5 M KOH was added, then the mixture was heated in a boiling water bath for 10 min, which was diluted to 50 mL with distilled water (ethanol can be used as antifoam), and rest for 20 min. Duplicate samples of 2.5 mL solution (sample determination solution and blank solution) was taken and 30 mL distilled water was added to both samples, the pH was adjusted to 3.5 with 0.1 M HCl, 0.5 mL iodine was added to the sample and no iodine was added to the blank solution, and both of them diluted to 50 mL and rest for 20 min. With the blank solution of the sample used as a control, the absorbance values of A λ 1 and A λ 2 were determined with a 1 cm cuvette at λ 1 and λ 2. The value of Δ A = A λ 1-A λ 2 was obtained.
c. The amylose content in the defatted sample can be calculated by checking the dual-wavelength standard curve of amylose (X.H. Liu et al., Citation2013).
2.9. Statistical analysis
All tests were conducted at least in duplicates. Results are showed as mean ± standard deviation and were analyzed by SPSS 9.0 and Origin 2018 software.
3. Results and discussion
3.1. Determination of amylose content
As shown in , the amylose content of seven oat varieties ranged from 21.14 ± 0.06% to 33.96 ± 0.09%. Among them, MY2 and CY1 have similar content of amylose, 31.58 ± 0.12% and 31.70 ± 0.11%, respectively. In order to eliminate the influence of the difference of amylose content on the result, MY2 and CY1 which have similar amylose content were selected for further research.
Table 1. Determination of amylose content in different oat varieties.
Tabla 1 Determinación del contenido de amilosa en diferentes variedades de avena
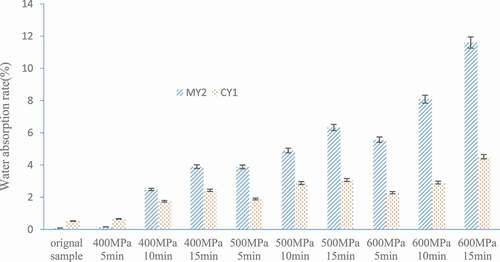
3.2. Water absorption rate of steamed oat
It can be seen from that the water absorption rate of two varieties of steamed oat was increased significantly with respect to the pressure levels. When under the same pressure level, with the increasing treatment time, the water absorption rate of steamed oat also increased. The results are similar to some previous studies with white rice, it was found that the water absorption of grain increased with the increasing pressure (Huang et al., Citation2009; Y. Yu et al., Citation2017). Douzals et al. (Citation1996) found that water absorption was affected by an increase in hydrogen bonds between water and starch. We inferred that altered interactions between proteins and starch, may promote the combination of starch and water.
Figure 2. Water absorption rate of steamed oat.
Figura 2. Tasa de absorción de agua de la avena cocida al vapor
3.3. Texture characteristics of steamed oat
There were significant differences in texture characteristics of two kinds of steamed oat before and after UHPT. It can be seen from that the hardness of steamed oat after UHPT is lower than that of the sample without UHPT. Y. Yu et al. (Citation2017) found the similar conclusion that HPT affected the properties of the brown rice. The decrease of steamed oat hardness indicated that UHPT can make oat softer and more acceptable to consumers. The initial hardness of steamed oat was 8864 g and 9002 g for MY2 and CY1. When the pressure was up to 600 MPa with holding time of 15 min, the hardness of each sample was decreased to 2648 g and 3141 g, which means the hardness was reduced by 69.72% and 65.11%, respectively.
Figure 3. Texture characteristics of MY2 and CY1 with different UHPT.
Figura 3. Características de la textura de MY2 y CY1 con diferentes UHPT
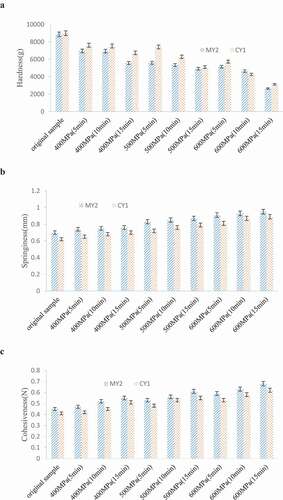
The springiness of steamed oat was increased when the pressure was increased from 400 to 600 MPa. The initial springiness is 0.7 and 0.62 mm, the springiness of the sample increased after UHPT, ranged 0.74–0.95 mm and 0.65–0.89 mm for MY2 and CY1, as increased 5.71%–35.71% and 4.84%–43.55%, respectively. Springiness is an important index reflecting the texture quality of rice, springiness was positively correlated with chewiness, the more springy the rice is, the more chewy the rice is (Ma, Citation2013). The cohesiveness of steamed oat was also increased by UHPT. There were no significant differences with respect to the pressure levels. However, there were significant differences between the treated and untreated steamed oat.
The differences in texture mean the composition and structure of oats are different, which affects the eating quality of steamed oat (Yu et al., Citation2009a). Some researchers believed that the change of protein structure also had a certain impact on the texture characteristics of rice (Yu et al., Citation2009b).
3.4. E-tongue analysis
E-tongue analysis has been a popular technique to evaluate umami, sweet, salty, acid, and astringent tastes in foods and pharmaceuticals (S. Li et al., Citation2014). shows the PCA plot of two varieties of steamed oat. The first two principle components, PC1 and PC2, accounted for 85.74% and 13.19% of MY2; 83.84% and 14.86% of CY1, respectively, led to total variance of 98.93% and 98.70% of MY2 and CY1. In PCA analysis, the difference between taste is judged according to the distance between samples on the x and y axis, as the x axis represents the contribution rate of the first principal component, often the contribution rate of the first principle component is larger, and the contribution rate of the second principle component is smaller (Xie, Citation2012). As shown in , a significant difference was observed between the original sample and the other UHPT group, both of the original sample of MY2 and CY1 occupied different areas of the figure. The sample information with the same pressure level was very similar. Hence, UHPT was effective in the taste of oat rice. The e-tongue analyses are capable of offering complementary information about steamed oat after different treatments (Hu et al., Citation2017).
Figure 4. Principle Component Analysis (PCA) of a) MY2; b) CY1 by e-tongue.
Figura 4. Análisis de los componentes principales (PCA) de a) MY2; b) CY1 por la lengua electrónica: [min = minutos]
![Figure 4. Principle Component Analysis (PCA) of a) MY2; b) CY1 by e-tongue.Figura 4. Análisis de los componentes principales (PCA) de a) MY2; b) CY1 por la lengua electrónica: [min = minutos]](/cms/asset/28d2b48e-eec2-476f-bd95-98964d09d3c6/tcyt_a_1857847_f0004_c.jpg)
3.5. SEM result of oat protein
showed the effects of different UHPT on the protein structure of MY2 and CY1. Among them, a represented original protein sample, and b-j represented SEM of protein structure with different pressures and holding time. Surface structures of the protein on the original oat samples were fine; however, as shown in Pictures b–d, the apparent structure began to change when the samples were treated with 400 MPa, the surface of their protein becomes more porous and uneven. From Pictures e–g, when the samples were treated with 500 MPa, the protein structure began to form irregular flakes and the texture is no longer fine anymore as the treatment time increases. As shown in Pictures h–j, the protein structure changed significantly under 600 MPa with the increased holding time from 5 to 15 min. This result is indicating that the disulfide bond cross-linking between protein and protein was destroyed by the UHPT. Hüttner et al. (Citation2010) reported that weakening of protein structure, moisture redistribution, and possibly altered interactions between proteins and starch were responsible for the positive effects of UHPT at 200 MPa on the bread-making performance of oat flour.
Figure 5. 1. (a) original protein sample of MY2 (b) protein of MY2 treated with 400 MPa for 5 min (c) protein of MY2 treated with 400 MPa for 10 min (d) protein of MY2 treated with 400 MPa for 15 min (e) protein of MY2 treated with 500 MPa for 5 min (f) protein of MY2 treated with 500 MPa for 10 min (g) protein of MY2 treated with 500 MPa for 15 min (h) protein of MY2 treated with 600 MPa for 5 min (i) protein of MY2 treated with 600 MPa for 10 min (j) protein of MY2 treated with 600 MPa for 15 min. 2. Effect of different UHPT on protein apparent structure of 1) MY2; 2) CY1 (a) original protein sample of CY1 (b) protein of CY1 treated with 400 MPa for 5 min (c) protein of CY1 treated with 400 MPa for 10 min (d) protein of CY1 treated with 400 MPa for 15 min (e) protein of CY1 treated with 500 MPa for 5 min (f) protein of CY1 treated with 500 MPa for 10 min (g) protein of CY1 treated with 500 MPa for 15 min (h) protein of CY1 treated with 600 MPa for 5 min (i) protein of CY1 treated with 600 MPa for 10 min (j) protein of CY1 treated with 600 MPa for 15 min.
Figura 5. 1. a) Muestra de la proteína original de MY2; b) Proteína del MY2 tratada con 400 MPa durante 5 min; c) Proteína del MY2 tratada con 400 MPa durante 10 min; d) Proteína del MY2 tratada con 400 MPa durante 15 min; e) Proteína del MY2 tratada con 500 MPa durante 5 min; f) proteína del MY2 tratada con 500 MPa durante 10 min; g) proteína del MY2 tratada con 500 MPa durante 15 min; h) proteína del MY2 tratada con 600 MPa durante 5 min; i) proteína del MY2 tratada con 600 MPa durante 10 min; j) proteína del MY2 tratada con 600 MPa durante 15 min. 2. Efecto de diferentes UHPT en la estructura aparente de la proteína de 1) MY2; 2) CY1. [min = minutos] a) Muestra de proteína original de CY1; b) Proteína de CY1 tratada con 400 MPa durante 5 min; c) Proteína de CY1 tratada con 400 MPa durante 10 min; d) Proteína de CY1 tratada con 400 MPa durante 15 min; e) Proteína de CY1 tratada con 500 MPa durante 5 min; f) proteína de CY1 tratada con 500 MPa durante 10 min; g) proteína de CY1 tratada con 500 MPa durante 15 min; h) proteína de CY1 tratada con 600 MPa durante 5 min; i) proteína de CY1 tratada con 600 MPa durante 10 min; j) proteína de CY1 tratada con 600 MPa durante 15 min
![Figure 5. 1. (a) original protein sample of MY2 (b) protein of MY2 treated with 400 MPa for 5 min (c) protein of MY2 treated with 400 MPa for 10 min (d) protein of MY2 treated with 400 MPa for 15 min (e) protein of MY2 treated with 500 MPa for 5 min (f) protein of MY2 treated with 500 MPa for 10 min (g) protein of MY2 treated with 500 MPa for 15 min (h) protein of MY2 treated with 600 MPa for 5 min (i) protein of MY2 treated with 600 MPa for 10 min (j) protein of MY2 treated with 600 MPa for 15 min. 2. Effect of different UHPT on protein apparent structure of 1) MY2; 2) CY1 (a) original protein sample of CY1 (b) protein of CY1 treated with 400 MPa for 5 min (c) protein of CY1 treated with 400 MPa for 10 min (d) protein of CY1 treated with 400 MPa for 15 min (e) protein of CY1 treated with 500 MPa for 5 min (f) protein of CY1 treated with 500 MPa for 10 min (g) protein of CY1 treated with 500 MPa for 15 min (h) protein of CY1 treated with 600 MPa for 5 min (i) protein of CY1 treated with 600 MPa for 10 min (j) protein of CY1 treated with 600 MPa for 15 min.Figura 5. 1. a) Muestra de la proteína original de MY2; b) Proteína del MY2 tratada con 400 MPa durante 5 min; c) Proteína del MY2 tratada con 400 MPa durante 10 min; d) Proteína del MY2 tratada con 400 MPa durante 15 min; e) Proteína del MY2 tratada con 500 MPa durante 5 min; f) proteína del MY2 tratada con 500 MPa durante 10 min; g) proteína del MY2 tratada con 500 MPa durante 15 min; h) proteína del MY2 tratada con 600 MPa durante 5 min; i) proteína del MY2 tratada con 600 MPa durante 10 min; j) proteína del MY2 tratada con 600 MPa durante 15 min. 2. Efecto de diferentes UHPT en la estructura aparente de la proteína de 1) MY2; 2) CY1. [min = minutos] a) Muestra de proteína original de CY1; b) Proteína de CY1 tratada con 400 MPa durante 5 min; c) Proteína de CY1 tratada con 400 MPa durante 10 min; d) Proteína de CY1 tratada con 400 MPa durante 15 min; e) Proteína de CY1 tratada con 500 MPa durante 5 min; f) proteína de CY1 tratada con 500 MPa durante 10 min; g) proteína de CY1 tratada con 500 MPa durante 15 min; h) proteína de CY1 tratada con 600 MPa durante 5 min; i) proteína de CY1 tratada con 600 MPa durante 10 min; j) proteína de CY1 tratada con 600 MPa durante 15 min](/cms/asset/aeec91d6-5ab8-43aa-aae0-37011de05e1b/tcyt_a_1857847_f0005_b.gif)
4. Conclusion
As expected, 400–600 MPa UHPT positively affected the eating quality of steamed oat. The water absorption rate of steamed oat was increased by UHPT. Hardness values of steamed oat were reduced while springiness and cohesiveness were increased by UHPT. The original samples and UHPT group samples showed significant differences in electronic tongue profiles. Scanning electron microscopy (SEM) indicated that the structure of the protein is greatly affected by UHPT, with increasing pressure level and pressure time, the more impact on protein structure was observed. In conclusion, the eating quality of steamed oat was positively affected by UHPT, which has some correlation to the changes of oat protein structure; however, further studies are required to determine these correlations.
Disclosure statement
The authors did not report any potential conflict of interest.
Additional information
Funding
References
- Bouis, H. E., Chassy, B. M., & Ochanda, J. O. (2003). Genetically modified food crops and their contribution to human nutrition and food quality. Trends in Food Science and Technology, 14(5), 191–209. https://doi.org/https://doi.org/10.1016/S0924-2244(03)00073-6
- Cai, W. C., Tang, F. X., Zhao, X. X., G, Z., Zhang, Z. D., Dong, Y., & Shan, C. H. (2019). Different lactic acid bacteria strains affecting the flavor profile of fermented jujube juice. Journal of Food Processing and Preservation, 43(9), 1–14. https://doi.org/https://doi.org/10.1111/jfpp.14095
- Chu, Y. F., Wise, M. L., Gulvady, A. A., Chang, T., Kendra, D. F., Vanklinken, B. J. W., Shi, Y. H., & O’Shea, M. (2013). In vitro antioxidant capacity and anti-inflammatory activity of seven common oats. Food Chemistry, 139(1–4), 426–431. https://doi.org/https://doi.org/10.1016/j.foodchem.2013.01.104
- Deng, L. Z. (2012). Rice cooking and its physical properties and the mechanism of taste formation [Dissertation] (pp. 10–12). Zhengzhou: Henan University of Technology.
- Douzals, J. P., Marechal, P. A., Coquille, J. C., & Gervais, P. (1996). Microscopic study of starch gelatinization under high hydrostatic pressure. Journal of Agriculture and Food Chemistry, 44(6), 1403–1408. https://doi.org/https://doi.org/10.1021/jf950239c
- Hu, G. L., Zheng, Y. R., Liu, Z. M., & Deng, Y. (2017). Effects of UV-C and single- and multiple-cycle high hydrostatic pressure treatments on flavor evolution of cow milk: Gas chromatography-mass spectrometry, electronic nose, and electronic tongue analyses. International Journal of Food Properties, 20(7), 1677–1688. https://doi.org/https://doi.org/10.1080/10942912.20.2016.1217876
- Huang, S. L., Jao, C. L., & Hsu, K. C. (2009). Effects of hydrostatic pressure/heat combinations on water uptake and gelatinization character- istics of japonica rice grains: A kinetic study. Journal of Food Science, 74(8), E442–E448. https://doi.org/https://doi.org/10.1016/j.foodchem.2018.07.171
- Hüttner, E. K., Dal Bello, F., & Arendt, E. K. (2010). Fundamental study on the effect of hydrostatic pressure treatment on the bread-making performance of oat flour. European Food Research and Technology, 230(6), 827–835. https://doi.org/https://doi.org/10.1007/s00217-010-1228-4
- Lásztity, R. (1998). Oat grain: A wonderful reservoir of natural nutrients and biologically active substances. Food Reviews International, 14(1), 99–119. https://doi.org/https://doi.org/10.1080/87559129809541150
- Lee, N. Y., & Koo, J. G. (2019). Effects of high hydrostatic pressure on quality changes of blends with low-protein wheat and oat flour and derivative foods. Food Chemistry, 271, 685–690. https://doi.org/https://doi.org/10.1016/j.foodchem.2018.07.171
- Li, H. Y., Yan, S., Yang, L., Xu, M. H., Ji, J. Y., Liu, Y. L., Wang, J., & Sun, B. G. (2020). High-pressure homogenization thinned starch paste and its application in improving the stickiness of cooked non-glutinous rice. LWT-Food Science and Technology, 131, 1–5. https://doi.org/https://doi.org/10.106/j.lwt.2020.109750
- Li, S., Ma, C., Liu, Z., Gong, G., Xu, Z., Xu, A., & Hua, B. (2014). Flavour analysis of stirred yoghurt with cheddar cheese adding into milk. Food Science and Technology Research, 20(5), 939–946. https://doi.org/https://doi.org/10.1080/10942912.2016.1217876
- Liu, C. H., Zheng, X. Z., & Ding, N. Y. (2008). Principal component analysis of cooked rice texture qualities. Journal of Northeast Agricultural University, 15(1), 70–74.
- Liu, X. H., Zheng, L. X., Zheng, L. M., Ou, C. C., Ye, C. X., & Wang, A. L. (2013). Determination of amylose and amylopectin in the commonly used starch materials by dual-wavelength spectrophotometry. Guangdong Agricultural Sciences, 18(1), 97–100. https://doi.org/https://doi.org/10.16768/j..1004-874x.2013.18.010
- Ma, J. H. (2013). The storage quality indicator changes rice after controlled atmosphere storage [Dissertation] (pp. 30–35). Zhengzhou: Henan University of Technology.
- Ma, S., Zhang, M. L., Bao, X. L., & Fu, Y. (2020). Preparation of antioxidant peptide from oat globulin. CyTA-Journal of Food, 1(18), 108–115. https://doi.org/https://doi.org/10.1080/19476337.2020.1716076
- Peterson, D. M. (2001). Oat antioxidants. Journal of Cereal Science, 33(2), 115–129. https://doi.org/https://doi.org/10.1006/jcrs.2000.0349
- Tian, Y., Zhao, J., Xie, Z., Wang, J., Xu, X., & Jin, Z. (2014). Effect of different pressure-soaking treatments on color, texture, morphology and retrogradation properties of cooked rice. LWT Food Science and Technology, 55(1), 368–373. https://doi.org/https://doi.org/10.1016/j.lwt.2013.09.020
- Wang, P. Y., Shen, Q. X., Lu, X. H., Pang, L. J., & Chen, Z. X. (2016). Relevance features of rice protein and its components to physical and sensory properties of cooked rice. Food and Machinery, 3(32), 24–27. https://doi.org/https://doi.org/10.13652/j..1003-5788.2016.03.005
- Xia, Q., Wang, L. P., & Li, Y. F. (2018). Exploring high hydrostatic pressure-mediated germination to enhance functionality and quality attributes of wholegrain brown rice. Food Chemistry, 249, 104–110. https://doi.org/https://doi.org/10.1016/j.foodchem.2018.01.007
- Xie, T. P. (2012). Research on the rice storage quality and quick determination technology of electronic nose [Dissertation] (pp. 50–55). Nanjing University of Finance and Economics.
- Yu, S. F., Ma, Y., & Sun, D. W. (2009a). Impact of amylose content on starch retrogradation and texture of cooked milled rice during storage. Journal of Cereal Science, 50(2), 139–144. https://doi.org/https://doi.org/10.1016/j.jcs.2009.04.003
- Yu, S. F., Yang, X. C., Menager, Lucile, & Ma, Y. (2009b). Effect of amylose, protein and lipid on thermal propertied of rice flour. Food and Fermentation Industry, 35(4), 38–42. CNKI:SUN:SPFX.0.2009-04-013
- Yu, Y., Pan, F., Ramaswamy, H. S., Zhu, S., Yu, L., & Zhang, Q. (2017). Effect of soaking and single/two cycle high pressure treatment on water absorption, color, morphology and cooked texture of brown rice. Journal of Food Science and Technology, 54(6), 1655–1664. https://doi.org/https://doi.org/10.1007/s13197-017-2598-4