
 ?Mathematical formulae have been encoded as MathML and are displayed in this HTML version using MathJax in order to improve their display. Uncheck the box to turn MathJax off. This feature requires Javascript. Click on a formula to zoom.
ABSTRACT
Microbial load, protein oxidation, myofibrillar protein changes and quality characteristics (meat color and water retentiveness including centrifugal loss (CeL) and water-holding capacity (WHC)) of post-rigor tan mutton exposed to different high-pressure treatments (200 MPa/500 MPa for 15 min at 18°C) during chilled storage for 7 days (4°C) were evaluated. High-pressure applications of 200 MPa and 500 MPa significantly reduced the number of Total Viable Counts (TVC) during storage (P < 0.05), but excessive pressure treatment (500 MPa) also resulted in a significant increase in protein oxidation and decrease in water retentiveness (P < 0.05), accompanied by deterioration of meat color. 200 MPa treatment also caused adverse effects on the quality of processed meat at the later stage of storage (3–7 d) similar to 500 MPa high pressure, but the initial application of 200 MPa pressure resulted in no significant differences in meat color and retentiveness from the untreated (P > 0.05) and better texture characteristics than untreated samples. ANOVA with Partial Least Squares Regression (APLSR) confirmed the relationshipS between these variations in quality characteristics induced by high-pressure treatments and protein oxidation and key myofibrillar skeleton proteins.
RESUMEN
Este estudio evaluó la carga microbiana, la oxidación de proteínas, los cambios de las proteínas miofibrilares y las características de calidad (color de la carne y retención de agua, incluidas la pérdida centrífuga [CeL] y la capacidad de retención de agua [WHC]) de ovejas color castaño en fase posrigor expuestas a diferentes tratamientos de alta presión (200 MPa/500 MPa durante 15 minutos a 18°C) durante su almacenamiento refrigerado de siete días (a 4°C). Las aplicaciones de alta presión de 200 MPa y 500 MPa redujeron significativamente el número de recuentos totales viables (TVC) durante el almacenamiento (P < 0.05). Sin embargo, el tratamiento de presión excesiva (500 MPa) dio lugar a un aumento significativo de la oxidación de proteínas y a la disminución de la capacidad de retención de agua (P < 0.05), lo que se acompañó del deterioro del color de la carne. El tratamiento de 200 MPa también provocó efectos adversos en la calidad de la carne procesada en la etapa posterior de almacenamiento (3-7 días), similares a los causados por la aplicación de alta presión de 500 MPa. No obstante, la aplicación inicial de la presión de 200 MPa no dio lugar a diferencias significativas en el color de la carne y la retención del agua con respecto a la carne sin tratar (P > 0.05), presentando mejores características de textura que las muestras sin tratar. El ANOVA con regresión de cuadrados mínimos parciales (APLSR) confirmó las relaciones entre estas variaciones en las características de calidad inducidas por los tratamientos de alta presión y la oxidación de las proteínas, así como en las proteínas clave del esqueleto miofibrilar.
1. Introduction
Tan sheep with tenderness, high protein content, low cholesterol and rich nutrition is a characteristic dominant animal breed in Ningxia, China, and more than 90% of lamb is sold as cold fresh and frozen meat in the northwest region of China (Li et al., Citation2019).
The tenderness, colour and water retentiveness are usually deemed as the important quality criteria for evaluating meat for sale since it can be stated directly through appearance, texture and touch. However, these critical characteristics of meat quality would be inevitably deteriorated during postmortem storage owing to the action of endogenous enzymes, leading to prime quality loss (De Oliveira et al., Citation2019). Also, the onset and promotion of protein degradation during postmortem storage triggered by enzymatic action also create ideal conditions for the growth of microorganisms that contaminate muscle and lead to being susceptible to spoilage (Jo et al., Citation2014). High-pressure processing (HPP) as a non-thermal sterilization technology has been proved to have superior capacities to diminish microbial loads while retaining most of the sensory, nutrient and functional properties of processed food products (Chouhan et al., Citation2015). However, the application of HPP to raw meat could induce alterations of meat quality traits in texture, color and water-retaining properties, which depends upon protein susceptibility, the applied pressure and temperature, and the duration of the pressure treatment (Sun & Holley, Citation2010), and are related to the conformation state, denaturation, aggregation and gel properties of meat proteins after HPP (Roco et al., Citation2018). The primary proteins in muscle myofibrils as myosin, actin, tropomyosin and troponin-T play an important role in maintaining muscle structural integrity and fluid retention by myofibrils, and high pressure can induce these cytoskeleton proteins to change and thereby affect meat quality (Campus et al., Citation2010). Jo et al. (Citation2014) pointed out that the unfolding and denaturation of muscle proteins after high-pressure treatments of 400 MPa and 500 MPa for 3 min contributed to the WHC and textural properties of the muscle, and pressurization from 300 MPa to 500 MPa for 3 min could lead to protein unfolding and structural changes in the muscle and compensate for the decline in pH and shear force caused by the acceleration of postmortem glycolysis, thereby resulting in an increase in pH of pressurized post-rigor abalone muscle. Zhang et al. (Citation2015) indicated pressures at <200 MPa induced gel formation of myofibrillar proteins which increased WHC, whereas higher pressures resulted in protein denaturation and reduced WHC. In addition, denaturation of myofibrillary structural proteins such as myosin and actin also affects meat surface and light reflectance, leading to changes in meat color (Grossi et al., Citation2016).
The traditional texture tests as texture profile analysis (TPA), Kramer test and puncture test are frequently used to assess the textural changes in high-pressure-treated meat, yet they present drawbacks due to being destructive and time-consuming (Campus et al., Citation2010). The stress relaxation test is one of the most important evaluation tools used for determining viscoelastic properties of materials and can be used for quality assurance of high-pressure-treated meat, being rapid, robust and non-destruction, and this method has been proven to be well consistent with structural protein changes and texture parameters determined by TPA testing, which can be used as markers to monitor the textural changes of muscle (Barroso et al., Citation2010; Herrero et al., Citation2010).
Although some studies have reported the effects of high-pressure treatment on the textural properties of seafood and meat products during storage (Campus et al., Citation2010; Chouhan et al., Citation2015; McArdle et al., Citation2013), few studies have monitored the rheological changes of post-rigor tan mutton during storage by stress relaxation test, and further established the correlations between pressurized meat quality characteristics and protein changes from the perspective of protein oxidation and changes in key myofibrillar skeleton proteins. Therefore, this study aimed to investigate the influences of different high-pressure treatments (200/500 MPa,15 min, 18°C) on the quality characteristics (meat color, water retentiveness including CeL and WHC) of tan mutton during the chilled period (4°C, up to 7 days), and to characterize its textural properties more finely by stress relaxation test. Key myofibrillar protein changes are elucidated by SDS-PAGE and protein oxidation is determined, and their associations with the above quality characteristics are established.
2. Materials and methods
2.1. Experimental design and high-pressure treatment
Samples were collected from Xinhai pasture, Yanchi, Ningxia China. A total of 45 tan sheep with the same feeding conditions and management methods (about 8 months old, average carcass weight 36 ± 5 kg) were slaughtered. The longissimus dorsi muscles from the left and right carcasses of each sheep were removed separately and immediately transported back to the laboratory under the protection of an ice bag. Subsequently, visible fat and anadesma of the longissimus dorsi muscles were removed and uniformly trimmed to a size of approximately 10 cm × 4.0 cm × 4.0 cm chunks of meat, each sheep could obtain two chunks of meat from the left and right carcasses and assigned them to two different groups (M1 group and M2 group), one chunk of meat in each group, so a total of 90 chunks of meat were obtained from the carcasses of 45 sheep, and 45 chunks of meat from different carcasses were obtained from the two groups, respectively (M1 group = 45; M2 group = 45). Next, five chunks of meat were randomly selected from each group and packed in vacuum (DZ-400D, Shenzhen Packaging Machinery Co., Ltd. China) to ensure that each chunk of meat in the polyamide-polyethylene vacuum bag came from five different carcasses. A total of 18 vacuum packages were finally obtained from the two groups, and all vacuum packages were placed in a 4°C refrigerator for 48 h. Then, all meat chunks were taken out and randomly divided into three groups (control group, 200 MPa high-pressure treatment group, 500 MPa high-pressure treatment group). Each treatment group had six vacuum packages. After high-pressure treatment was completed, the meat chunks were again kept in a refrigerator at 4°C for 1 day, 3 days and 7 days. Two packages were taken from each treatment group at each storage time point for determination. Five chunks of meat in one package were used for the stress relaxation test. Five chunks of meat in another package were used for the determination of other indicators. High-pressure processing was performed with reference to Marcos and Mullen (Citation2014) and McArdle et al. (Citation2013)’s methods, sample chunks packed were placed in an ice bath (0–2°C) before high-pressure treatment to prevent adverse temperature effects. One polyamide-polyethylene vacuum bag containing five sample chunks was placed in a 5-L capacity high-pressure vessel (HPP-600, Baotou Kefa Co., Inner Mongolia, China) during each high-pressure treatment. The preset pressures of 200 MPa and 500 MPa were achieved by an ascending rate of 5 MPa/s and maintained for 15 min, the pressure release time was 10 s, the pressure-transmitting medium was distilled water, and the pressure temperature was set to 18°C.
2.2. Water retentiveness
The ability of muscle to retain water was characterized in terms of centrifugal loss (CeL) and water-holding capacity (WHC) according to Luca et al. (Citation2010) and Campus et al. (Citation2010), respectively.
2.3. Color assessment
Surface color was assessed at 25°C using a color difference meter (CR-400, Konica Minolta, INC., Japan) in the CIE L* a* b* scale in the reflectance mode. The lightness values (L*), redness values (a*), and yellowness values (b*) of tan mutton were measured according to the method of McArdle et al. (Citation2013).
2.4. Protein oxidation analysis
Carbonyl content was evaluated by reaction with 2,4-dinitrophenylhydrazine (DNPH) to form protein hydrazones (Ali et al., Citation2015). An extinction coefficient of 22,000 M−1 cm−1 was used to calculate the carbonyl content.
2.5. Stress relaxation test
Stress relaxation tests were performed with a TA-XT plus Texture analyzer (Stable Micro Systems Ltd., Surry, UK) equipped with Exponent 5.1.2.0 software using a 500 N load cell. Slices that were 20 ± 1 mm in thickness were cut out from different sample chunks of longissimus dorsi perpendicular to the muscle fiber orientation, and compressed by 30% with a 36 mm aluminum cylinder probe at a crosshead speed of 1 mm/s. Sample compressed surface was placed perpendicular to the direction of the muscle fiber, and the compression was kept constant for 60 s, allowing the stress to reach equilibrium. For each storage time (1, 3, 7 days), five sample chunks for each treatment condition were analysed (control, 200 MPa, 500 MPa), making a total of fifteen sample chunks per time of analysis. Texture Expert Exceed Software was used to acquire the data output. The force–time relationship in relaxation was fitted to a modified version of the Maxwell model represented by (Peleg, Citation2010), as follows:
where δ is the stress (N) at a given time, t (seconds), Ci are stress relaxation constants (N), δ0 is the equilibrium stress (N), τi (seconds) are the relaxation times of the Maxwell elements. Non-linear regression models with three exponential terms with δ0 were used as described by previous studies (Herrero et al., Citation2008, Citation2010).
2.6. SDS-polyacrylamide gel electrophoresis (SDS-PAGE)
The extraction of myofibrillar protein and SDS-PAGE were performed according to the procedures of Marino et al. (Citation2013) and slightly modified. Briefly, SDS–PAGE was resolved in 12% polyacrylamide resolving gel with a 5% stacking gel. Protein concentration was adjusted approximately at 2 mg/mL. Twenty microgram of protein was loaded per lane. Low range molecular weight markers ranging from 150 kDa to 15 kDa were used for the estimation of protein’s molecular weight. Gels were run in a Mini-PROTEAN Tetra Cell system (Bio-Rad). Bio-safe Coomassie stain (Bio-Rad) was used to visualize bands. Gels were destained, and stained gel images were captured using a G-800 Densitometer (Bio-Rad). The density of the protein bands were quantified using Quantity One software (Version 4.6.20) and expressed as average intensity.
2.7. Microbiological analysis
Samples were analysed for Total Viable Counts (TVC) at 1d and after 7d. Microbiological analysis TVC was inspected based on standard plate count method by the method of Hussain et al. (Citation2020). In brief, 5 g sample was taken aseptically from vacuumed bags and homogenized in 45 mL of sterile physiological saline (0.85% w/v) in stomacher bags for 2 min. For microbial enumeration, suitable serial dilutions were prepared using the same diluent, by following the protocol of the International Organization for Standardization’s (ISO, Citation2003). Then, the deriving suspension was serially diluted (1:10) in sterile physiological saline water and 1 mL samples of appropriate dilutions were poured into the petridishes, containing 15–20 mL of plates count agar (PCA). The number of bacterial colonies on the plates was enumerated after incubation for 72 h at 37°C and expressed as Log CFU (colony forming units)/g meat.
2.8. Statistical analysis
All analyses were repeated five times, and the results were expressed as the mean ± standard deviation. The relaxation curves were fitted with Origin Pro 2018 (Origin Lab Corporation, USA), using the Levemberg-Marquardt regression analysis method. The correlations between meat quality characteristics (Rheological properties, WHC, CeL, meat color, Carbonyl content) and changes of myofibrillar proteins caused by HP treatments were analyzed by ANOVA with PLSR (APLSR) under Unscrambler X 10.4 Software (CAMO ASA, Trondheim, Norway). From an examination of the validated variance, two two Principal Components (PCs) models were established. On average, 75% and 13% of the validated total variation in Y indicators (meat quality characteristics and protein indicators) were revealed as relevant to X variables (different treatments, referred as control-1d (C-1d), control-3d (C-3d), control-7d (C-7d), 200 MPa-1d, 200 MPa-3d, 200 MPa-7d, 500 MPa-1d, 500 MPa-3d, 500 MPa-7d) in PC1 and 2, respectively. Besides, significant differences were compared using Fisher’s least significant difference (LSD) test at P = 0.05 through DPS v7.05 data processing system.
3. Results and discussion
3.1. Effect of high-pressure treatments on microbial numbers of post-rigor tan mutton
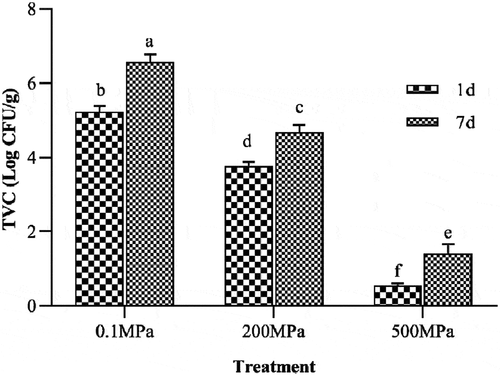
The total microbial count is one of the most important criteria for the quality evaluation of fresh and refrigerated seafood and meat products (Chouhan et al., Citation2015). represents the effect of different high-pressure treatments on the TVCs of tan mutton after 1 and 7 days of refrigerated storage. Microbial growth increased significantly (P < 0.05) during storage and this increase was found to be higher in untreated meat. On the initial day, the application of 200 MPa pressure significantly reduced the TVC compared with untreated (P < 0.05), and further pressurization to 500 MPa showed a stronger sterilization efficiency than other treatments (P < 0.05). After 7 days of storage, the corresponding TVC in the control approached the unacceptable limit of 7 log cfu/g, while the significantly decreased TVCs were obtained in 200 MPa and 500 MPa pressure-treated samples (4.67 ± 0.21 and 1.40 ± 0.26 log cfu/g for 200 MPa and 500 MPa, respectively). Cell membrane is considered to be a primary target for high-pressure inactivation of bacteria as it affects permeability and thereby disturbs transport mechanisms which leads to nutrient deficiency, pH modifications and eventual cell death (Chouhan et al., Citation2015). The effectiveness of HPP for reducing or inactivating microbial growth of seafood and meat products has been previously reported, including 250 and 350 MPa/10 min processed hilsa fillets (Chouhan et al., Citation2015), 200–400 MPa/10 min processed Sea Bream (Campus et al., Citation2010), 400 MPa/5 min processed duck breast (Khan et al., Citation2019) and 200–600 MPa/20 min processed lamb (McArdle et al., Citation2013).
Figure 1. Changes in total aerobic count during storage in untreated samples and samples treated at 200 and 500 MPa for 15 min at 18 C.
Results are shown as the average value with the standard deviation (n = 3). The different lower case letters represent significant differences (P < 0.05).
Figura 1. Cambios en el recuento aeróbico total durante el almacenamiento en muestras no tratadas y en muestras tratadas a 200 y 500 MPa durante 15 minutos a 18°C
3.2. Effect of high-pressure treatments on water retentiveness of post-rigor tan mutton
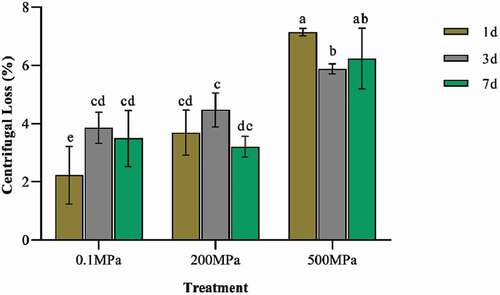
Water retentiveness is a property of muscular tissue that withstands water loss (Roco et al., Citation2018). The water retentiveness of tan mutton under different treatments was together characterized in terms of WHC and CeL in this study, as shown in . The effects of high pressure and storage time on the WHC of tan mutton were not obvious, but it could be noted that WHC decreased slightly with the increases of high pressure. The effect of high pressures on the water retentiveness of treated meat was more reflected in the CeL, as shown in . The CeL of untreated samples and 200 MPa high-pressure-treated samples did not differ significantly in each storage day (P > 0.05), while a significant increase in CeL was observed when further pressurized to 500 MPa compared with other treatments (P < 0.05). The influence of high pressure on the water retentiveness of meat depends on the pressure level, holding time and temperature (Sun & Holley, Citation2010). Kim et al. (Citation2007) indicated the bovine semitendinosus muscles obtained higher CeL than the controls after 5 min of high-pressure treatment with 200–500 MPa in a hydrostatic fluid medium at 15 ± 3°C. Hong et al. (Citation2005) discovered that the increase of pressure from 50 MPa to 200 MPa at an ambient temperature significantly decreased the WHC of pork longissimus dorsi (P < 0.05). The decrease in water retentiveness of meat treated with high pressure may be attributed to protein denaturation and changes in the intracellular architecture of fibrils induced by high pressure (Fabiano et al., Citation2017).
Figure 2. Changes in water-holding capacity during storage in untreated samples and samples treated at 200 and 500 MPa for 15 min at 18°C.
Results are shown as the average value with the standard deviation (n = 5). The different lower case letters represent significant differences (P < 0.05).
Figura 2. Cambios en la capacidad de retención de agua durante el almacenamiento en muestras no tratadas y en muestras tratadas a 200 y 500 MPa durante 15 minutos a 18°C
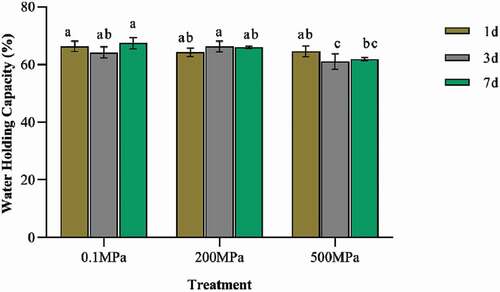
Figure 3. Changes in centrifugal loss during storage in untreated samples and samples treated at 200 and 500 MPa for 15 min at 18°C.
Results are shown as the average value with the standard deviation (n = 5). The different lower case letters represent significant differences (P < 0.05).
Figura 3. Cambios en la pérdida por centrifugación durante el almacenamiento en muestras no tratadas y en muestras tratadas a 200 y 500 MPa durante 15 minutos a 18°C
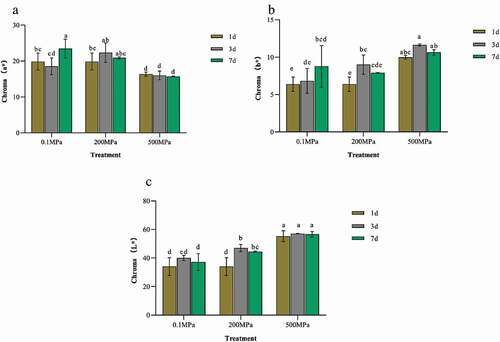
3.3. Effect of high-pressure treatments on meat color of post-rigor tan mutton
The color of meat depends on the optical properties of the meat surface as well as on the myoglobin content of the muscle (Marcos & Mullen, Citation2014). Different high-pressure treatments had significant effects on the color of tan mutton during storage, as shown in . The redness (a*) of untreated and 200 MPa treated samples did not differ significantly from each storage day except the third day ()). Continuing to increase the pressure to 500 MPa, it was found that the a* values during the whole storage period were significantly lower than those of untreated and 200 MPa treatments (P < 0.05). The negative effects of high pressure on meat color were also reflected in the yellowness (b*) of processed meat, as shown in ). 200 MPa high-pressure application only apparently advanced the b* values of the treated samples on the third day (P < 0.05), whereas no significant differences with the untreated samples at other storage times (P > 0.05). Further pressurization to 500 MPa significantly elevated the yellowness of treated meat, showing a significant increase in b* values than the control and 200 MPa treatment during the storage period (P < 0.05). In addition, the lightness (L*) of tan mutton also responded differently to various high-pressure levels ()), 200 MPa pressure substantially increased the L* values of the treated samples on the first and third days (P < 0.05), while the application of 500 MPa pressure further promoted this parameter of the treated meat throughout the storage period by comparing the 200 MPa treated and untreated groups (P < 0.05). It is a generally accepted fact that high pressure induces changes in the color of processed meat, which depends on the intensity of the HP process (pressure and time). Similar to our findings, significantly increased L* values were observed in abalone treated at 200–500 MPa for 3 min. Meanwhile, a decrease in the a* value of abalone was observed after 2–3 weeks depending on the pressure level (P < 0.05). The abalone treated at <200 MPa showed decreases in a* after 2 weeks of storage, whereas the a* value of those treated at >300 MPa decreased after 3 weeks (Jo et al., Citation2014). In addition, carp muscle fillets also obtained significantly increased L* values when treated with 140–200 MPa pressures for 15 or 20 min (P < 0.05), while significantly increased b* values could be found when treated with pressures higher than 100 MPa regardless of treatment time (15/20 min, P < 0.05) (Sequeira-Munoz et al., Citation2006). According to the authors, increased L* parameters in HP meat may be associated with protein coagulation, which would affect sample structure and surface properties, while increased b* and decreased a* parameters may be attributed to the pressure-induced oxidation of ferrous myoglobin to ferric metmyoglobin and denaturation of myoglobin.
Figure 4. Changes in meat colour parameters during storage in untreated samples and samples treated at 200 and 500 MPa for 15 min at 18°C.
Results are shown as the average value with the standard deviation (n = 5). The different lower case letters represent significant differences (P < 0.05).
Figura 4. Cambios en los parámetros de color de la carne durante el almacenamiento en muestras no tratadas y en muestras tratadas a 200 y 500 MPa durante 15 minutos a 18°C
3.4. Effect of high-pressure treatments on protein oxidation of post-rigor tan mutton
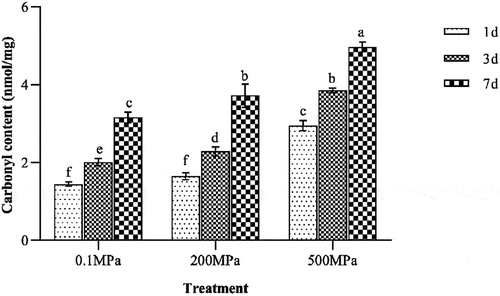
The data related to the carbonyl contents of tan mutton samples after different treatments are shown in . The carbonyl contents of samples corresponding to each treatment increased significantly with storage time (P < 0.05). 200 MPa high-pressure-treated samples obtained significantly increased carbonyl contents on the third and seventh days of storage compared with the control (P < 0.05), while the application of 500 MPa pressure further increased the carbonyl content at the corresponding each storage day compared with 200 MPa treated and untreated (P < 0.05). Higher carbonyl contents indicated more production of protein oxidation products and implied lower oxidation stability under these high-pressure treatments. The increase in protein oxidation under pressure may be associated with the potential formation of free radicals, pressure associated denaturation of myofibrillar proteins could cause the release of Fe2+, which promoted the site-specific metal-catalyzed oxidation occurred in the side chains of lysine, arginine, proline, and threonine residues in the tan mutton samples, to which gave rise to the carbonyl derivatives (Jung et al., Citation2013; Khan et al., Citation2019).
Figure 5. Changes in carbonyl content during storage in untreated samples and samples treated at 200 and 500 MPa for 15 min at 18 °C.
Results are shown as the average value with the standard deviation (n = 5). The different lower case letters represent significant differences (P < 0.05).
Figura 5. Cambios en el contenido de carbonilo durante el almacenamiento en muestras no tratadas y en muestras tratadas a 200 y 500 MPa durante 15 minutos a 18°C
3.5. Effect of high-pressure treatments on rheological characteristics of post-rigor tan mutton
The generalized Maxwell model was often used to describe of relaxation behavior of materials (Nobile et al., Citation2007). It was reported that the number of elements taking part in the establishment of the generalized Maxwell model for food materials was usually 2 to 3 (Peleg, Citation2010), and the three-term model with δ0 has been chosen for some foods such as pork, poultry meats, and seafoods, as best fitted to interpret the relaxation curves (Campus et al., Citation2010; Herrero et al., Citation2008, Citation2010; Myhan et al., Citation2015). Therefore, a three-term model with δ0 was established and used to attempt to fit the experimental data in this study. Curves obtained from relaxation experiments were fitted considering the relaxation part, taking not into account the first part of the curve, namely from the start of the test to the reaching of the maximum force (Zhao et al., Citation2017). Fitting results by a three-term model with δ0 to relaxation data are presented in , where the fitting capability of each model was evaluated based on the maximum relative difference (MRD) and the Percent Explained Variation (R2). The results showed that the three-term model with δ0 produced an excellent representation of experimental data (R2 > 0.99 and MRD < 5), and regression analysis results can be used for subsequent analysis.
Table 1. Constants of the three-term model with δ0 for controls and samples treated at 200 and 500 MPa for 15 min at 18°C.
Tabla 1 Constantes del modelo de tres términos con δ0 para controles y muestras tratadas a 200 y 500 MPa durante 15 minutos a 18°C
As the decay forces of the Maxwell model, Ci represent the elastic components and can be used as a measure of material elasticity (Campus et al., Citation2010). As shown in , it was observed that the Ci values (C1, C2 and C3) in the control after 7 days of storage were significantly lower than those on the first day (P < 0.05), while no significant differences in Ci size between the seventh day and the first day for 500 MPa treated samples (P > 0.05). Conversely, the application of 200 MPa high pressure appreciably elevated the level of Ci parameters as storage progressed, and a prominent enhancement in Ci values appeared on the seventh day compared to its initial levels on the first day (P < 0.05). Comparison of the amplitude of Ci parameters among different treatments revealed that 200 MPa high-pressure treatment significantly decreased the amplitude of these parameters when just being treated relative to the untreated (P < 0.05), while further increasing the pressure to 500 MPa promoted them significantly (P < 0.05). At the end of the whole storage period, the Ci values in the 200 MPa and 500 MPa pressurized samples were obviously higher than these in the untreated (P < 0.05), and there were no significant differences in Ci magnitude between the applied high-pressure levels (P > 0.05). Campus et al. (Citation2010) pointed out that τi can also be used to measure muscle firmness and elasticity, but this parameter other than τ3 did not seem to be significantly affected by high-pressure treatment and refrigeration storage in this study (P > 0.05), as depicted in . Meanwhile, the magnitude of δ0 is often used to measure the “stiffness” of materials (Campus et al., Citation2010), and its change with storage time in each treatment group was basically consistent with the Ci parameters.
According to the analysis results of stress relaxation parameters, the post-rigor tan mutton may suffer from the deterioration of texture after being refrigerated for 7 days, accompanied by becoming softening and less elastic, while the processed meat with 200 MPa and 500 MPa high pressures maintained higher stiffness and elasticity after storage. Similarly, Campus et al. (Citation2010) also assessed the rheological changes of sea bream muscle after high-pressure treatment using a three-element Maxwell model with δ0 and found that the C1 values of untreated and 200 MPa treated samples for 10 min decreased significantly (P < 0.05), while in samples treated at 300 MPa and 400 MPa the magnitude of this parameter, although decreasing, was kept significantly higher during 7 days of chilled storage (P < 0.05). Moreover, τi values decreased drastically in untreated sea bream muscles after 13 days of chilled storage, while the values of the parameter in high-pressure-treated samples were kept more constant, especially in samples treated at 300 MPa and 400 MPa. These results were consistent with our finding that tan mutton treated at 200 MPa and 500 MPa after 7 days of chilled storage had higher C1 and τi values than untreated samples, which indicated that samples treated with high pressure retained more “elasticity” and “solidity” than the control during storage. The increased meat texture induced by high-pressure treatment could be associated with myofibrillar protein denaturation and aggregation (Christensen et al., Citation2017).
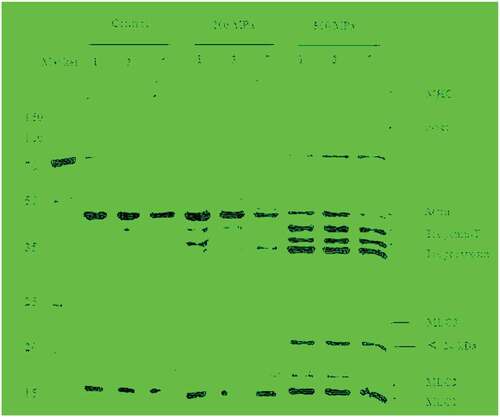
3.6. Effect of high-pressure treatments on myofibrillar protein of post-rigor tan mutton
In order to better reveal the effect of high-pressure application on myofibrillar proteins, SDS-PAGE was performed and shown in . Major myofibrillar protein bands were identified starting from the positive electrode, as myosin heavy chain (MHC), C-protein, α-actinin (α-act), troponin-T, tropomyosin, actin, myosin light chains (MLC1, MLC2 and MLC3) and a low molecular weight region (<24 kDa) in , and their corresponding band densities are represented in . It can be seen from the table that 200 MPa high-pressure treatment significantly increased the band densities of troponin-T and topomyosin on the first and seventh days (P < .01), while further increasing the pressure to 500 MPa made their band strength notably increased throughout the storage period (P < .01), compared to the non-pressurized control. Similar band reinforcement in troponin-T and tropomyosin were also observed in 200 MPa and above pressures treated pork myofibrillar protein, which may be due to an increased concentration of these proteins, indicating an increased fraction of solubilization (Grossi et al., Citation2016). Meanwhile, it was also noticed that MHC, actin and α-act bands became less intense after high-pressure treatment of 500 MPa during the storage period than the untreated (P < .01), and accompanied by a significant increase in band magnitude of MLC3, MLC2 and MW< 24 kDa (P < .01). A similar loss and disappearance of the α-act band in the soluble proteins fraction from bovine muscle was observed after pressure treatment above 300 MPa (Chapleau & Lamballerie-Anton, Citation2003), which was considered to be associated with decreased protein solubility. Also, more intense low molecular weights protein bands (<24 kDa) also appeared in carp fillets treated with 200 MPa for 30 min (Sequeira-Munoz et al., Citation2006) and sea bass treated with 250 MPa for 30 min (Teixeira et al., Citation2014), which may be the result of the fragmentation of myofibrillar proteins, leading to an increase in solubilization of these proteins.
Table 2. Effect of different high-pressure treatments (200 MPa/500 MPa, 15 min, 18°C) and storage time on myofibrillar proteins of post-rigor tan mutton.
Tabla 2 Efecto de los diferentes tratamientos de alta presión (200 MPa/500 MPa, 15 minutos, a 18°C) y el tiempo de almacenamiento en las proteínas miofibrilares de la oveja castaña en fase posrigor
Figure 6. SDS-PAGE profile of myofibrillar proteins of untreated samples and 200 MPa and 500 MPa treated samples for 15 min at 18 °C with storage time.
MHC, myosin heavy chain; α-act, α-actinin; MLC, myosin light chain.
Figura 6. Perfil de SDS-PAGE de las proteínas miofibrilares de las muestras no tratadas y de las muestras tratadas a 200 y 500 MPa durante 15 minutos a 18°C con tiempo de almacenamiento
3.7. Relationships between protein changes and quality characteristics of post-rigor tan mutton after high-pressure treatments
As indicated in , most of the Y indicators located between the inner 50% and outer 100% explained variance circles of the APLSR correlation loading plot, indicating that they were well explained by the 2 PC model. Different treatments involving three different pressure levels (0.1 MPa (control), 200 MPa and 500 MPa) were clearly separated and distinguished on the APLSR plot, in which the 500 MPa treatment was located on the right side of the PC2 axis, the control was located on the left side of the PC2 axis, and the 200 MPa treatment was distributed along the PC2 axis. The control (C-1d, C-3d) and 500 MPa treatment (500 MPa-1d, 500 MPa-3d and 500 MPa-7d) were distributed along the PC1 axis and located near the small ellipse, suggesting that both more markedly affected Y indicators that were mostly reflected by PC1 than the other treatments. Most of the Y indicators were spread along both sides of PC1 axis and were mainly interpreted by PC1 (75%). The relationships between meat quality and protein changes were very clear and mainly influenced by 500 MPa treatment.
Figure 7. The APLSR correlation loading plot for the first two principal components (PCs). Nine 0/1 indicator variables (different treatments, referred as C-1d (control-1d), C-3d (control-3d), C-7d (control-7d), 200 MPa-1d, 200 MPa-3d, 200 MPa-7d, 500 MPa-1d, 500 MPa-3d, 500 MPa-7d) in the X-matrix, and changes of myofibrillar proteins and meat quality characteristics in the Y-matrix. Ellipses represent r2 = 0.5 (50%) and 1.0 (100%).
Figura 7. Gráfico de carga de correlación del APLSR para los dos primeros componentes principales (PC). Nueve variables indicadoras 0/1 [diferentes tratamientos, denominadas C-1d (control-1d), C-3d (control-3d), C-7d (control-7d), 200 MPa-1d, 200 MPa-3d, 200 MPa-7d, 500 MPa-1d, 500 MPa-3d, 500 MPa-7d) en la matriz X, y cambios de las proteínas miofibrilares y las características de calidad de la carne en la matriz Y]. Las elipses representan r2 = 0.5 (50%) y 1.0 (100%)
![Figure 7. The APLSR correlation loading plot for the first two principal components (PCs). Nine 0/1 indicator variables (different treatments, referred as C-1d (control-1d), C-3d (control-3d), C-7d (control-7d), 200 MPa-1d, 200 MPa-3d, 200 MPa-7d, 500 MPa-1d, 500 MPa-3d, 500 MPa-7d) in the X-matrix, and changes of myofibrillar proteins and meat quality characteristics in the Y-matrix. Ellipses represent r2 = 0.5 (50%) and 1.0 (100%).Figura 7. Gráfico de carga de correlación del APLSR para los dos primeros componentes principales (PC). Nueve variables indicadoras 0/1 [diferentes tratamientos, denominadas C-1d (control-1d), C-3d (control-3d), C-7d (control-7d), 200 MPa-1d, 200 MPa-3d, 200 MPa-7d, 500 MPa-1d, 500 MPa-3d, 500 MPa-7d) en la matriz X, y cambios de las proteínas miofibrilares y las características de calidad de la carne en la matriz Y]. Las elipses representan r2 = 0.5 (50%) y 1.0 (100%)](/cms/asset/72a95c3f-f2e8-4fbf-b884-9f16e430b426/tcyt_a_1863476_f0007_oc.jpg)
In terms of the relevance between myofibrillar proteins and stress relaxation constants, δ0, C1, and τ1 were markedly affected by 500 MPa treatment, especially on the first and seventh days. C1 and τ1 derived from the first of the three terms of Maxwell model are generally considered to be a major contribution to the total modulus (Campus et al., Citation2010; Zhao et al., Citation2017). δ0, C1 and τ1 strongly negatively correlated with MHC, actin and α-act, and positively correlated with MLC2, MLC3, TPM. The increased stress relaxation constants indicated the increase of elasticity and firmness of pressurized meat, which may be due to pressure-induced denaturation and aggregation of myofibrillar proteins (Chouhan et al., Citation2015). High pressure-induced aggregation involved the dissociation of myosin heavy and light chains followed by aggregation of the heavy chains, which reduced MHC and increased MLCs (Speroni et al., Citation2014). The unfolding of actin and aggregation of myosin molecules contributed to the enhanced texture of treated meat (Ramirez-Suarez & Morrissey, Citation2006).
In terms of the relevance between myofibrillar proteins and water retentiveness, 500 MPa treatments (500 MPa-1d and 500 MPa-7d) were markedly positively correlated with CeL, and negatively correlated with WHC. Meanwhile, CeL intimately negatively correlated with MHC, actin and α-act, and positively correlated with MLC2, MLC3, TPM and MW < 24 kDa. Myosin and actin, and to some extent tropomyosin are known as the main water-binding components in muscle tissue (Marcos & Mullen, Citation2014). HP induced protein denaturation of structural proteins like myosin and actin, causing reduced WHC and increased CeL of the proteins (Christensen et al., Citation2017). Low molecular weight proteins (MW < 24 kDa) were dramatically negatively correlated with MHC and actin, and were very close to the position of CeL in the APLSR plot, indicating that increased depolymerization and fragmentation of myofibrillar proteins due to high pressure contributed markedly to the increase of muscle water loss (Teixeira et al., Citation2014).
In terms of the relevance between myofibrillar proteins and meat color, 500 MPa treatment, especially the first and seventh days, had a remarkable negative correlation with a* and positive correlation with b* and L*. Changing the color coordinates a* and b* were considered to be related to denaturation of myoglobin and oxidation reactions (Fabiano et al., Citation2017). The application of 500 MPa high pressure denatured myoglobin and promoted oxidation of ferrous myoglobin to ferric metmyoglobin, resulting in a yellower and less red muscle. L* substantially positively correlated with CeL, and negatively correlated with MHC, actin, and α-act. This can be explained by the fact that 500 MPa treatment induced this structural proteins denaturation and formed larger insoluble protein aggregates, thus affecting the water distribution on the surface of pressurized meat and increasing light reflectance and scattering (Olsen & Orlien, Citation2016).
In addition, the location of carbonyl contents with relaxation parameters δ0, Ci and τi in the same quadrant described its strong relationships with sample texture. The structural changes occurring in the muscle due to denaturation of myofibrillar proteins, mainly by oxidation of protein side chains, modified the muscle structures and brought about an increase in textural properties of high-pressure-treated samples (Khan et al., Citation2019). Meanwhile, the close positional relationships between carbonyl content and CeL and L* also emphasized the importance of the structural changes of myofibrils caused by oxidative damage to the loss of free water between myofibrils and increased light reflectance and scattering (Christensen et al., Citation2017).
4. Conclusions
Both moderate and high-pressure applications (200/500 MPa, 15 min) effectively reduced the microbial loads during the chilled storage of post-rigor tan mutton, while 500 MPa pressure caused significantly undesirable deterioration in meat color and water retentiveness. 200 MPa treatment could decrease the number of initial microorganisms in processed meat while maintaining no significant differences in WHC and meat color with untreated samples at the beginning of the application, and could further improve the texture characteristics of processed meat. However, meat processed under this pressure is not recommended for long-term refrigeration, as APLSR analysis results revealed that the pressure-induced oxidation and denaturation of proteins increased with storage time, which in turn led to the deterioration of water retentiveness and texture properties of processed samples during later storage.
Disclosure statement
No potential conflict of interest was reported by the author(s).
Additional information
Funding
References
- Ali, S., Zhang, W., Rajput, N., Khan, M. A., Li, C. B., & Zhou, G. H. (2015). Effect of multiple freeze-thaw cycles on the quality of chicken breast meat. Food Chemistry, 173(apr.15), 808–814. https://doi.org/https://doi.org/10.1016/j.foodchem.2014.09.095
- Barroso, M., Careche, M., Barrios, L., & Borderias, A. J. (2010). Frozen hake fillets quality as related to texture and viscosity by mechanical methods. Journal of Food Science, 63(5), 793–796. https://doi.org/https://doi.org/10.1111/j.1365-2621.1998.tb17902.x
- Campus, M., Addis, M. F., Cappuccinelli, R., Porcu, M. C., Pretti, L., Tedde, V., Secchi, N., Stara, G., & Roggio, T. (2010). Stress relaxation behaviour and structural changes of muscle tissues from Gilthead Sea Bream (Sparus aurata L.) following high pressure treatment. Journal of Food Engineering, 96(2), 192–198. https://doi.org/https://doi.org/10.1016/j.jfoodeng.2009.07.013
- Chapleau, N. J., & Lamballerie-Anton, M. I. D. (2003). Changes in myofibrillar proteins interactions and rheological properties induced by high-pressure processing. European Food Research & Technology, 216(6), 470–476. https://doi.org/https://doi.org/10.1007/s00217-003-0684-5
- Chouhan, A., Kaur, B. P., & Rao, P. S. (2015). Effect of high pressure processing and thermal treatment on quality of hilsa (Tenualosa ilisha) fillets during refrigerated storage. Innovative Food Science & Emerging Technologies, 29(2), 92–101. https://doi.org/https://doi.org/10.1016/j.ifset.2015.03.016
- Christensen, L. B., Hovda, M. B., & Rode, T. M. (2017). Quality changes in high pressure processed cod, salmon and mackerel during storage. Food Control, 72(15), 90–96. https://doi.org/https://doi.org/10.1016/j.foodcont.2016.07.037
- De Oliveira, L. G., Delgado, E. F., Steadham, E. M., Huff-Lonergan, E., & Lonergan, S. M. (2019). Association of calpain and calpastatin activity to postmortem myofibrillar protein degradation and sarcoplasmic proteome changes in bovine Longissiumus lumborum and Triceps brachii. Meat Science, 155(SEP), 50–60. https://doi.org/https://doi.org/10.1016/j.meatsci.2019.04.015
- Fabiano, A. D. O., Neto, O. C., Marcondes, R. D. S. L., Rocha Ferreira, E. H., & Rosenthal, A. (2017). Effect of high pressure on fish meat quality-A review. Trends in Food Science & Technology, 26(12), 147–153. https://doi.org/https://doi.org/10.1016/j.tifs.2017.04.014
- Grossi, A., Olsen, K., Bolumar, T., Rinnan, A., Ogendal, L. H., & Orlien, V. (2016). The effect of high pressure on the functional properties of pork myofibrillar proteins. Food Chemistry, 196(1), 1005–1015. https://doi.org/https://doi.org/10.1016/j.foodchem.2015.10.062
- Herrero, A. M., de la Hoz, L., Ordonez, J. A., Herranz, B., Romero, D. A. M., & Cambero, M. I. (2008). Tensile properties of cooked meat sausages and their correlation with texture profile analysis (TPA) parameters and physico-chemical characteristics. Meat Science, 80(3), 690–696. https://doi.org/https://doi.org/10.1016/j.meatsci.2008.03.008
- Herrero, A. M., Heia, K., & Careche, M. (2010). Stress relaxation test for monitoring postmortem textural changes of ice-stored Cod (Gadus morhua L). Journal of Food Science, 69(4), 178–182. https://doi.org/https://doi.org/10.1111/j.1365-2621.2004.tb06344.x
- Hong, G., Park, S., Kim, J., Lee, S., & Min, S. (2005). Effects of time-dependent high pressure treatment on physico-chemical properties of pork. Food Science and Biotechnology, 14(4), 101–112. https://doi.org/https://doi.org/10.1093/icb/icr113
- Hussain, Z., Li, X., Ijaz, M., Xiao, X., Hou, C., Zheng, X., Ren, C., & Zhang, D. (2020). Effect of Chinese cinnamon powder on the quality and storage properties of ground Lamb Meat during refrigerated storage. Food Sci Anim Resour, 40(3), 311–322. https://doi.org/https://doi.org/10.5851/kosfa.2019.e79
- ISO. (2003). Microbiology of food and animal feeding stuffs — Horizontal method for the enumeration of microorganisms — Colony-count technique at 30 degrees C. International Organization for Standardization.
- Jo, Y. J., Jung, K. H., Lee, M. Y., Choi, M. J., Min, S. G., & Hong, G. P. (2014). Effect of high-pressure short-time processing on the physicochemical properties of abalone (Haliotis discus hannai) during refrigerated storage. Innovative Food Science & Emerging Technologies, 85(17), 92–103. https://doi.org/https://doi.org/10.1016/j.ifset.2014.02.011
- Jung, S., Nam, K. C., Ahn, D. U., Kim, H. J., & Jo, C. (2013). Effect of phosvitin on lipid and protein oxidation in ground beef treated with high hydrostatic pressure. Meat Science, 95(1), 8–13. https://doi.org/https://doi.org/10.1016/j.meatsci.2013.04.005
- Khan, M. A., Ali, S., Yang, H., Kamboh, A. A., Ahmad, Z., Tume, R. K., & Zhou, G. (2019). Improvement of color, texture and food safety of ready-to-eat high pressure-heat treated duck breast. Food Chemistry, 277(2019), 646–654. https://doi.org/https://doi.org/10.1016/j.foodchem.2018.11.006
- Kim, Y. J., Lee, E. J., Lee, N. H., Kim, Y. H., & Yamamoto, K. (2007). Effects of hydrostatic pressure treatment on the physicochemical, morphological, and textural properties of bovine Semitendinosus muscle. Food Science and Biotechnology, 16(1), 49–54. https://doi.org/https://doi.org/10.1016/j.foodpol.2006.08.002
- Li, D., Peng, Y., & Zhang, H. (2019). Investigation on texture changes and classification between Cold-Fresh and Freeze-Thawed Tan Mutton. Journal of Food Quality, 2019(1), 1–10. https://doi.org/https://doi.org/10.1155/2019/1957486
- Luca, A. D., Mullen, A. M., Elia, G., Davey, G., & Hamill, R. M. (2010). Centrifugal drip is an accessible source for protein indicators of pork ageing and water-holding capacity. Meat Science, 88(2), 261–270. https://doi.org/https://doi.org/10.1016/j.meatsci.2010.12.033
- Marcos, B., & Mullen, A. M. (2014). High pressure induced changes in beef muscle proteome: Correlation with quality parameters. Meat Science, 97(1), 11–20. https://doi.org/https://doi.org/10.1016/j.meatsci.2013.12.008
- Marino, R., Albenzio, M., Della, M. A., Santillo, A., Loizzo, P., & Sevi, A. (2013). Proteolytic pattern of myofibrillar protein and meat tenderness as affected by breed and aging time. Meat Science, 95(2), 281–287. https://doi.org/https://doi.org/10.1016/j.meatsci.2013.04.009
- McArdle, R. A., Marcos, B., Mullen, A. M., & Kerry, J. P. (2013). Influence of HPP conditions on selected lamb quality attributes and their stability during chilled storage. Innovative Food Science & Emerging Technologies, 19(2013), 66–72. https://doi.org/https://doi.org/10.1016/j.ifset.2013.04.003
- Myhan, R., Markowski, M., Daszkiewicz, T., Zapotoczny, P., & Sadowski, P. (2015). Non-linear stress relaxation model as a tool for evaluating the viscoelastic properties of meat products. Journal of Food Engineering, 146(25), 107–115. https://doi.org/https://doi.org/10.1016/j.jfoodeng.2014.09.006
- Nobile, M. A. D., Chillo, S., Mentana, A., & Baiano, A. (2007). Use of the generalized Maxwell model for describing the stress relaxation behavior of solid-like foods. Journal of Food Engineering, 78(3), 978–983. https://doi.org/https://doi.org/10.1016/j.jfoodeng.2005.12.011
- Olsen, K., & Orlien, V. (2016). High-pressure processing for modification of food biopolymers. Innovative Food Processing Technologies, 246(75), 291–313. https://doi.org/https://doi.org/10.1016/B978-0-08-100294-0.00011-0
- Peleg, M. (2010). Characterization of the stress relaxation curves of solid foods. Journal of Food Science, 44(1), 277–281. https://doi.org/https://doi.org/10.1111/j.1365-2621.1979.tb10062.x
- Ramirez-Suarez, J. C., & Morrissey, M. T. (2006). Effect of high pressure processing (HPP) on shelf life of albacore tuna (Thunnus alalunga) minced muscle. Innovative Food Science & Emerging Technologies, 7(1–2), 27. https://doi.org/https://doi.org/10.1016/j.ifset.2005.08.004
- Roco, T., Torres, M. J., Briones-Labarca, V., Reyes, J. E., Tabilo-Munizaga, G., Stucken, K., Lemus-Mondaca, R., & Perez-Won, M. (2018). Effect of high hydrostatic pressure treatment on physical parameters, ultrastructure and shelf life of pre- and post-rigor mortis palm ruff (Seriolella violacea) under chilled storage. Food Research International, 108(6), 192–202. https://doi.org/https://doi.org/10.1016/j.foodres.2018.03.009
- Sequeira-Munoz, A., Chevalier, D., LeBail, A., Ramaswamy, H. S., & Simpson, B. K. (2006). Physicochemical changes induced in carp (Cyprinus carpio) fillets by high pressure processing at low temperature. Innovative Food Science & Emerging Technologies, 7(1–2), 18. https://doi.org/https://doi.org/10.1016/j.ifset.2005.06.006
- Speroni, F., Szerman, N., & Vaudagna, S. R. (2014). High hydrostatic pressure processing of beef patties: Effects of pressure level and sodium tripolyphosphate and sodium chloride concentrations on thermal and aggregative properties of proteins. Innovative Food Science & Emerging Technologies, 23(6), 10–17. https://doi.org/https://doi.org/10.1016/j.ifset.2014.03.011
- Sun, X. D., & Holley, R. A. (2010). High hydrostatic pressure effects on the texture of meat and meat products. Journal of Food Science, 75(1), 17–23. https://doi.org/https://doi.org/10.1111/j.1750-3841.2009.01449.x
- Teixeira, B., Fidalgo, L., Mendes, R., Costa, G., Cordeiro, C., Marques, A., Saraiva, J. A., & Nunes, M. L. (2014). Effect of high pressure processing in the quality of sea bass (Dicentrarchus labrax) fillets: Pressurization rate, pressure level and holding time. Innovative Food Science & Emerging Technologies, 72(15), 53–60. https://doi.org/https://doi.org/10.1016/j.ifset.2013.12.005
- Zhang, Z., Yang, Y., Tang, X., Chen, Y., & You, Y. (2015). Chemical forces and water holding capacity study of heat-induced myofibrillar protein gel as affected by high pressure. Food Chemistry, 188(1), 111–118. https://doi.org/https://doi.org/10.1016/j.foodchem.2015.04.129
- Zhao, W., Fang, Y., Zhang, Q., Guo, Y., Gao, G., & Yi, X. (2017). Correlation analysis between chemical or texture attributes and stress relaxation properties of ‘Fuji’ apple. Postharvest Biology and Technology, 129(3), 45–51. https://doi.org/https://doi.org/10.1016/j.postharvbio.2017.03.010