
 ?Mathematical formulae have been encoded as MathML and are displayed in this HTML version using MathJax in order to improve their display. Uncheck the box to turn MathJax off. This feature requires Javascript. Click on a formula to zoom.
ABSTRACT
Changes in color and color stability of cyanidin and cyanidin 3-O-β-glucopyranoside (Cy3Glc) in aqueous solutions were investigated at pHs from 0.5 to 13.1, by combination of colorimetry and spectrophotometry. The glucosidic substitution at C-3 of cyanidin (i.e., Cy3Glc), moved the tonalities toward the yellow pole of the chromatic circle, which resulted in high Chroma increases and a hypsochromically shifted visible absorbance maximum (λmax-vis). Under the most acidic and alkaline conditions, cyanidin showed greater Lightness compared with the rest of the pH range. At these extreme pHs, the lower Lightness of Cy3Glc was coupled with a high Chroma value. As a consequence, Cy3Glc showed its most intense color under the most acidic and alkaline conditions, and did not show visually perceptible color at neutral pH. At pH <3 and from pH 10 to11 cyanidin had lower color stability than Cy3Glc. We show the correlations between the data for these color and stability variations for cyanidin and Cy3Glc over the entire pH range.
RESUMEN
Este estudio se propuso investigar los cambios en el color y la estabilidad del color de la cianidina y la cianidina 3-O-β-glucopiranósido (Cy3Glc) en soluciones acuosas a pH de 0.5 a 13.1, combinando colorimetría y espectrofotometría. La sustitución glucosídica de la cianidina en C-3 (es decir, Cy3Glc) movió las tonalidades hacia el polo amarillo del círculo cromático, lo que dio lugar a altos incrementos del croma y a un máximo de absorción visible desplazado hipsocrómicamente (λmax-vis). La cianidina mostró mayor ligereza tanto en las condiciones más ácidas como en las más alcalinas, en comparación con el resto del rango de pH. En estos pH extremos, a la menor ligereza de Cy3Glc se agregó a un alto valor de croma. Como consecuencia, Cy3Glc mostró su color más intenso en las condiciones más ácidas y más alcalinas, y su color no fue visualmente perceptible en el pH neutro. A un pH <3, y a partir de un pH de 10 a 11, la cianidina mostró menor estabilidad de color que Cy3Glc. De esta manera pudimos constatar las correlaciones entre los datos de estos colores y las variaciones de estabilidad de la cianidina y la Cy3Glc en todo el rango de pH.
1. Introduction
Anthocyanins (Greek: anthos meaning flower; kyanos meaning blue) are the most important pigments of higher plants, and they represent the largest group of water-soluble pigments in the plant kingdom (Castañeda-Ovando et al., Citation2009). They belong to the widespread class of phenolic compounds that are collectively known as flavonoids (Kong, Citation2003). These pigments are responsible for shiny orange, pink, red, violet, and blue colors, and they can also appear “black” in some circumstances, such as for the flowers and fruit of certain plants (Castañeda-Ovando et al., Citation2009; Clifford, Citation2000). Chemically, anthocyanins are the glycosylated products of anthocyanidins (Brouillard, Citation1982). There is a huge variety of anthocyanins spread throughout Nature (Castañeda-Ovando et al., Citation2009), with the most widespread as cyanidin 3-glucoside (Castañeda-Ovando et al., Citation2009; Kong, Citation2003).
In aqueous solutions, anthocyanins exist in different forms that are maintained in equilibrium. In very acidic solutions at pH ~3 or lower, anthocyanins are present as their red flavylium cations. Increasing the pH of this aqueous medium leads to reduced color intensity because of the decreased concentration of the flavylium cation, as it is converted into its colorless carbinol pseudobase by the nucleophilic attack of the water. At low acidic and neutral to low alkaline pHs (i.e., pH 5–8), deprotonation of the flavylium cation also occurs, which gives rise to the violet/blue quinonoidal forms () (Brouillard, Citation1982). Therefore, at pHs typical of fresh and processed fruit and vegetables, each anthocyanin in aqueous solution will most probably be represented by an equilibrium of a mixture of forms (Torskangerpoll & Andersen, Citation2005).
Figure 1. pH-dependent structural transformations of cyanidin and cyanidin 3-O-β-glucopyranoside (Cy3Glc) in aqueous solution. At C-3: for cyanidin, R = H; for Cy3Glc, R = Glc. AH+ = flavylium cation, A = quinonoidal base, A− = quinonoidal anion, B = carbinol pseudobase and C = chalcone (Rakić et al., Citation2019; Zhao et al., Citation2014).
Figura 1. Transformaciones estructurales dependientes del pH de la cianidina y la cianidina 3-O-β-glucopiranósido (Cy3Glc) en solución acuosa. En C-3: para la cianidina, R = H; para Cy3Glc, R = Glc. AH+ = catión de flavilio, A = base quinonoidal, A− = anión quinonoidal, B = pseudobase de carbinol y C = chalcona (Rakić et al., Citation2019; Zhao et al., Citation2014)
Anthocyanins have been reported to be strong antioxidants and to inhibit inflammation and growth of cancer cells, while also being vasoprotectors with anti-obesity effects. Many of the health benefits associated with berry fruits appear to be due to the high concentrations of anthocyanins that they contain (McGhie & Walton, Citation2007). The anthocyanin content of fruit and vegetables, and their corresponding antioxidant activities, contribute to protective effects against degenerative and chronic diseases, thus also giving them further nephroprotective and anti-inflammatory effects, among others (Castañeda-Ovando et al., Citation2009; Popović, Kocić, Katić, Jović et al., Citation2019; Popović, Kocić, Katić, Zarubica et al., Citation2019; Veljković et al., Citation2017).
Synthetic food colorants are popular in the food industry, due to their low production costs, high tinctorial strengths, and chemical stabilities. However, consumer demand has been driving for the replacement of artificial colorants with naturally derived pigments (Sigurdson et al., Citation2017). Therefore, the development of food colorants from natural sources has become relevant for food companies, so that they can remain competitive in a changing market and in the international marketplace (G. T. Sigurdson et al., Citation2016).
However, several factors restrict the possibilities here. Indeed, the colors provided by colorants can be easily affected by a number of chemical (inter-)reactions that can occur in food products, with the major problem being instability caused by temperature, oxygen, light, and enzymes (Brouillard, Citation1982). A further particular problem is the influence of the ambient pH on their behavior (Brouillard, Citation1982). The resulting color changes represent disadvantages for the use of colorants in food matrixes in which the pH conditions are near neutrality, which are different to those of the maximum color expression of the anthocyanin used (Oliveira et al., Citation2006). With increasing interest in anthocyanins as food colorants, there is the need to better understand how the glucosidic substitution at the cyanidin C-3 position, which produces cyanidin 3-O-β-glucopyranoside (Cy3Glc; the most prevalent anthocyanin in Nature), impacts upon the color of these pigments across the wide pH range that is representative of different foods. Bearing in mind that most widespread anthocyanidin in fruit and vegetables is cyanidin (50%), and the most widespread anthocyanin in Nature is Cy3Glc (Castañeda-Ovando et al., Citation2009; Kong, Citation2003), it is of great importance to know how their color and stability changes over the entire pH range. These data have practical importance as they will contribute to the assessment of the potential use of cyanidin and Cy3Glc as food dyes. To the best of our knowledge, there are no data in the literature for the color and stability variations according to pH for cyanidin and Cy3Glc that cover the entire pH range.
In this study, we investigated how the structural transformations of cyanidin and Cy3Glc caused by pH and the structural modifications of cyanidin as a result of its glucosidation influence their colorimetry and spectrophotometry coordinates and stability. The CIELAB parameters measured here were: Hue angle (hab), Chroma (C*ab; color saturation), Lightness (L*), Redness (a*), and Yellowness (b*). Additionally, the visible absorption spectra (380–900 nm) were recorded. These were determined as the colorimetric and spectrophotometry references for cyanidin and Cy3Glc at pHs from 0.5 to 13.1 (with increases of ~0.5 pH units), to cover the most common pHs in foods. Additionally, the color stabilities of cyanidin and Cy3Glc to these pH changes were calculated as color differences (∆E*ab), to obtain more precise information about their stabilities and changes in color.
2. Materials and methods
2.1. Chemicals and reagents
The chloride salts of cyanidin and Cy3Glc were from Polyphenols Laboratories AS (Sandnes, Norway). Hydrochloric acid and sodium hydroxide were from Merck (Darmstadt, Germany). The aqueous solutions were prepared from Milli-Q water (resistivity >18 MΩ cm; Millipore, Bedford, MA, USA).
2.2. Colorimetric measurements
The chloride salts of cyanidin and Cy3Glc were dissolved in Milli-Q water to 0.2 mmol/L, and these were left to equilibrate in the dark for 10 min at 25°C. Successive pH increases of ~0.5 pH units from pH 0.5 to pH 13.1 were achieved as previously reported (Rakić et al., Citation2019). Briefly, after each addition of an aliquot of a few μL of HCl (2.93·×10−3 mol/L to 12 mol/L) or NaOH (9.8·×10−3 mol/L to 10 mol/L), the solutions were again allowed to equilibrate in the dark for 5 min at 25°C. The pHs were measured using a pH meter (Seven Easy; Mettler Toledo, Schwerzenbach, Switzerlend) equipped with a micro electrode (InLab; Mettler Toledo, Schwerzenbach, Switzerlend). The Commission Internationale de l’Eclairage Lab (CIELAB) parameters were also recorded, as: Hue angle (hab; color change around the color circle); Chroma (C*ab; color saturation); Lightness (L*; lightness); Redness (a*; redness [+a] to greenness [–a]); and Yellowness (b*; yellowness [+b] to blueness [–b]) (Oliveira et al., Citation2006). These were determined using a Chroma meter (CR-400; Konica Minolta, Sensing, Inc., Osaka, Japan), with all of the measurements performed in triplicate.
The color differences, ∆E*ab, take into account the differences between two color points, and these were calculated between the initial pH and each increase in pH, considering the Euclidean distance between the two color points, according to EquationEquation (1)(1)
(1) (Hurtado et al., Citation2009):
The components that make up these color differences (∆E*ab) were obtained according to EquationEquations (2)(2)
(2) to (4), according to Oliveira et al. (Citation2006):
The color difference ∆E*ab has a mean threshold value of ∆E* = 1, and it is used to define perceptible color differences between two solutions (Gonnet, Citation1999).
2.3. Spectrophotometry measurements
The visible absorption spectra of the cyanidin and Cy3Glc solutions (380–900 nm) were recorded after the color measurements for each solution at each pH. The visible absorption spectra were determined using a UV–visible spectrophotometer (Cary 100 Bio; Varian, Mulgrave, Victoria, Australia), with Milli-Q water as the reference, and a resolution of 1 nm. Each spectrum had the solvent spectrum subtracted and was multiplied by the dilution factor.
2.4. Statistics data analysis
All measurements were carried out in triplicate and data are reported as means ±standard deviation (S.D.; n = 3).
3. Results and discussion
Color expression of anthocyanins is dependent on pH (Sigurdson et al., Citation2018). In relatively strong acidic solutions, anthocyanins occur only as their flavylium forms (Brouillard, Citation1982; Brouillard et al., Citation1982; Torskangerpoll & Andersen, Citation2005). However, when the pH increases, each anthocyanin becomes a mixture of various equilibrium forms (Brouillard, Citation1982; Brouillard et al., Citation1982).
The CIELAB uniform color space was used for this colorimetric analysis. The spectral behaviors were analyzed as the changes in the visible spectra at the different pHs. The color variations in the 0.2 mmol/L cyanidin and Cy3Glc aqueous solutions were studied across the wide pH range from pH 0.5 to 13.1, with increases of ~0.5 pH units. This range covers the most common pHs of foods. The CIELAB parameters measured were for Hue angle (hab), Chroma (C*ab; color saturation), Lightness (L*), Redness (a*) and Yellowness (b*). The spectrophotometry results are expressed as the changes in positions of the absorbance maxima in the visible range (λmax-vis). Calculation of the color differences (ΔE*ab; see Methods) showed that these were highly dependent on pH and the glucosidic substituent at the aglycone C-3 position in Cy3Glc (–5).
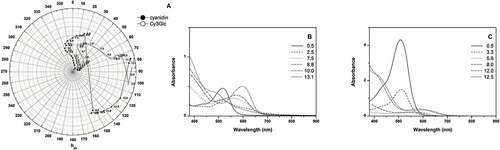
Figure 2. Hue angle (hab) as a function of pH for the aqueous solutions of 0.2 mmol/L cyanidin (●) and cyanidin 3-O-β-glucopyranoside (○) (A);Visible absorption spectra of 0.2 mmol/L cyanidin at pHs from 0.5 to 13.1 (B); Visible absorption spectra of 0.2 mmol/L Cy3Glc at pHs from 0.5 to 12.5 (C).
Figura 2. Ángulo de tonalidad (hab) en función del pH para las soluciones acuosas de cianidina a 0.2 mmol/L (●) y cianidina 3-O-β-glucopiranósido (○) (A); espectros de absorción visibles de 0.2 mmol/L de cianidina a pH de 0.5 a 13.1 (B); espectros de absorción visibles de 0.2 mmol/L de Cy3Glc a pH de 0.5 a 12.5 (C)
3.1. Influence of pH on Hue angle
The Hue angle (hab) is a qualitative attribute of color (Hurtado et al., Citation2009) that is defined in terms of a 360° color wheel. Here, 0°/360° represents purplish-red, 90° represents yellow, 180° represents bluish-green, and 270° represents blue (Stintzing et al., Citation2002). Cyanidin and Cy3Glc followed different patterns for their changes in Hue angle with the pH increases (; ). At the initial lowest pH of 0.5, cyanidin showed reddish hues (hab = 31.4°), while Cy3Glc had orange hues (hab = 43.5°), as previously reported by Torskangerpoll and Andersen (Citation2005). At this lowest pH, the flavylium cation will have been the only structure for both cyanidin and Cy3Glc, and these differences will originate from their corresponding flavylium forms (Rakić et al., Citation2019).
Table 1. Color coordinate differences (components of the color difference, ∆E*ab; see Methods) as a function of pH for the aqueous solution of 0.2 mmol/L cyanidin and cyanidin 3-O-β-glucopyranoside (Cy3Glc), based on the initial values at pH 0.5.
Tabla 1. Diferencias de coordenadas de color (componentes de la diferencia de color, ∆E*ab; véase Métodos) en función del pH para la solución acuosa de cianidina a 0.2 mmol/L y cianidina 3-O-β-glucopiranósido (Cy3Glc), sobre la base de los valores iniciales a pH 0.5
With the pH increases, the cyanidin solution showed lower Hue angles, until pH 2.5 (hab = 1.7°), which when compared with the Hue angle at the initial pH (, ), means that the color of these solutions shifted toward the red pole of the chromatic circle, thereby yielding a redder color. This color difference was easily perceivable in the cyanidin solution. Changes in hue angles were accompanied by changes in the visible spectra of the cyanidin (). At the lowest pH of 0.4, the absorption band in the visible spectra for cyanidin was narrow, with a λmax-vis at 517 nm.
With the pH increases to pH 2.5, there was a change in the spectral band which became broad and a small shoulder at λmax-vis >600 nm appeared. In this pH range, a bathochromic shift in the λmax-vis spectra of cyanidin from 517 nm to 522 nm occurred. For the higher pH values to pH 7.5, this trend was reversed, with higher Hue angles for cyanidin (hab = 359.3°), which means that the color of these solutions then shifted toward the blue pole of the chromatic circle, thereby yielding a purplish-red color. These changes in hue angles were followed by visible spectra changes. The broad absorption band (with λmax-vis at 565 nm) indicated that cyanidin appeared to be present in a few similar equilibrium structures at this pH. Changes in hue angles and spectral changes in this range indicated structural transformations of cyanidin.
Further increases in pH to 8.8 showed a return to the relatively low Hue angles, consequently moving back through the red pole of the chromatic circle. In this pH range, the absorption band became narrower, and shifted from 565 nm to 571 nm. In the pH range from 8.8 to 10.0, there was a dramatic shift of the Hue angle from red (hab = 16.9°) toward green (hab = 155.9°), thus moving the Hue angle toward the green pole of the chromatic circle. In this pH range the absorption band in the visible spectra changed shape, as it became narrower. Also, there was a bathochromic shift in the λmax-vis from 571 nm to 599 nm.
In the more alkaline regions above pH 10.0, the trend was to lower Hue angles again, thereby shifting the color of the solution through the yellow pole of the chromatic circle at pH 13.1 (hab = 77.2°). In the visible spectra, these changes were followed by completely different shapes of the absorption band. Therefore, overall for cyanidin at pH <8.8, the Hue angles defined a red-pink appearance, while at pH >10, the dramatic change saw Hue angles defining green tones, which were confirmed by the spectral changes.
The Hues angles for Cy3Glc were almost constant for pHs from 0.5 (hab = 43.5°) to 3.3 (hab = 45.8°). In this pH range, the Cy3Glc solution had orange hues (), with no spectral changes (λmax-vis from 508 nm to 511 nm) ()). With pH increases to 5.6, the Hue angles dropped, thereby shifting the color to the red pole of the chromatic circle (hab = 9.5°). In visible spectra of Cy3Glc these changes were manifested by a bathochromic shift in the λmax-vis spectra from 511 nm to 524 nm, and there was a change in the spectral band, which became broader.
For these solutions of Cy3Glc at pH >5.6, there was a gradual increase in the Hue angles to pH 12 (hab = 93.0°) and thus the color was displaced toward the yellow pole of the chromatic circle. The visible spectra in this pH range showed a large bathochromic shift in the λmax-vis from 524 nm to 586 nm. The broad absorption band indicated that Cy3Glc was present in a few similar equilibrium structures in this pH range.
In the alkaline range, Cy3Glc maintained these yellow nuances, also for the most alkaline region (pH ˃12.0), with some slightly greener nuances (pH 12.5; hab = 102.6°). The visible spectra here showed a bathochromic shift in the λmax-vis from 586 nm to 603 nm, although the absorption band remained broad. These patterns are in general agreement with those reported by Heredia et al. (Citation1998). Therefore, overall, for Cy3Glc at pH <7.5, the Hue angles appeared orange-red, while at pH >8.0 there was a gradual increase in the Hue angles, with the appearance of yellow, and some green nuances at pH ˃12.0, which were followed by the changes in the visible spectra.
The glucosidic substitution at the C-3 position of cyanidin thus moved the tonalities toward the yellow pole of the chromatic circle and hypsochromically shifted λmax-vis in the visible spectra. It can be noted also that cyanidin showed large variations in its chromatic tonalities according to pH. Comparable effects were seen for Cy3Glc, although with a more restricted amplitude of the changes, with the Hue angles varying from orange-red at lower pHs to yellow at higher pHs. It thus appears that this replacement of the hydrogen atom in the C-3–OH group in cyanidin by the β-D-glucosyl moiety results in a restriction of the chromatic tonalities.
3.2. Influence of pH on Chroma
The Chroma values (color saturation; C*ab) show the distance from the gray tone (i.e., the degree of color saturation) over a scale from 0 to 100 (Torskangerpoll & Andersen, Citation2005). The Chroma is thus the quantitative attribute of the color intensity (Hurtado et al., Citation2009). shows how Chroma varied with pH for these cyanidin and Cy3Glc aqueous solutions. As previously reported by Torskangerpoll and Andersen (Citation2005) for Cy3Glc, the highest Chroma was at the lowest pH, of 0.5 (C*ab = 72.7). At this pH, with cyanidin and Cy3Glc largely as their flavylium cation forms (Rakić et al., Citation2019), for the cyanidin flavylium cation (C*ab = 37.6) the glucosidic substitution in the C-3 position resulted in a large Chroma increase (C*ab = 72.7) (). The Chroma value here for Cy3Glc at the lowest pH was in good agreement with that reported by Heredia et al. (Citation1998).
Figure 3. Chroma (C*ab) as a function of pH for the aqueous solutions of 0.2 mM cyanidin (●) and cyanidin 3-O-β-glucopyranoside (○).
Figura 3. Croma (C*ab) en función del pH para las soluciones acuosas de cianidina a 0.2 mM (●) y cianidina 3-O-β-glucopiranósido (○)
For cyanidin, the Chroma values were relatively low and almost constant across practically the entire pH region, except for the most acidic regions (pH <1.0; C*ab ≈ 36) and the most alkaline region (pH 13.1; C*ab = 34.8). The increase from pH 0.5 to pH 2.0 (C*ab = 17.5) resulted in a loss of just over 20 Chroma units (; ). In contrast, the pH change from 12.0 to 13.1 resulted in an increase in the Chroma by just over 25 units. In the rest of the pH range here (i.e., pH 2.0–12.0), the Chroma was descending but relatively constant (C*ab = 17.5–9.2). Thus cyanidin did not show any really visually perceptible colors (i.e., with C*ab <~20; Gonnet, Citation2001) across almost the entire pH range, except for the very acidic and very alkaline regions.
Anthocyanidins are rarely unstable, and their glycosylation, as the attachment of sugar moieties to the anthocyanidin through O-linkages, improves their stability through various mechanisms (Borkowski et al., Citation2005; Sigurdson et al., Citation2018). These effects can slow the rate of their hydrolysis (i.e., reduced degradation to phenolic acids, aldehydes), and raise their energy of activation for fading by displacing the hydration equilibrium (Zhao et al., Citation2014). Removal of the sugar residue at C-3 destabilizes these pigments, because the associated chalcone that lacks the sugars is an unstable α-diketone (Clifford, Citation2000). This readily degrades to 2,4,6-trihydroxyphenylacetaldehyde and a benzoic acid (Clifford, Citation2000). Therefore, these low Chroma values of cyanidin can be explained by the lack of a glycosidic moiety, which would improve the stability of the aglycone. This leads to the formation of larger amounts of colorless species (which include carbinol pseudobase, chalcones, and the products of their degradation).
For the Cy3Glc solutions, the Chroma started high here (pH ≤2.5; C*ab ~70), with increases in pH then resulting in Chroma decreases (; ). This indicated a loss of color, to the minimum at pH 7.5 to 8.0 (C*ab = 8.9–8.6). This decrease in Chroma was particularly seen for the pH range from 3.3 to 4.7, where ~35 Chroma units were lost (C*ab = 61.7–26.6) (). This was probably caused by the shift of the colored flavylium cation to the colorless carbinol pseudobase, which is formed as a result of nucleophilic addition of water to the positively charged pyrylium ring at C-2. This is consistent with our previous study, where at pH >4.4, Cy3Glc was in a colorless form (Rakić et al., Citation2019). The opposite effect was seen for the pH change from 8.0 to 8.9, where the Chroma increased again, by >15 Chroma units (C*ab = 8.6–24.3). This behavior can be explained by the deprotonation of the remaining quinonoidal bases, with the formation of the resonance-stabilized quinonoidal anions. The Cy3Glc solutions at pHs from 5.9 to 8.0 did not really show any visually perceptible color (i.e., C*ab <~20; Gonnet, Citation2001) (). As indicated above for Cy3Glc at pH >5.6, there were shifts in Hue angle from red to yellow nuances (). This loss of color and appearance of yellowish tones suggests that in this pH range, the carbinol pseudobase and chalcone forms were dominant. At the higher pHs (pH 10–12), the Chroma for Cy3Glc remained largely constant (C*ab ≈ 35), with a further increase for the most alkaline region at pH >12.0 (pH 13.1; C*ab = 60.0).
These cyanidin and Cy3Glc solutions at any measured pH compared to the reference pH (i.e., pH 0.5) were less saturated (i.e., negative Chroma differences; ). For the most acidic and most alkaline regions, Cy3Glc showed the highest Chroma, while for pHs around neutrality, Cy3Glc did not show any really visually perceptible color.
Cyanidin 3-O-β-glucopyranoside generally had significantly higher Chroma than cyanidin across almost the entire pH range here (except around neutrality), while demonstrating more saturated hues. This shows the impact of the 3-glucosylation on the color saturation; namely, the presence of the 3-glucosidic substitution strongly affected the increases in Chroma.
3.3. Influence of pH on Lightness
The Lightness (L*) indicates the darkness (0) to lightness (100) (i.e., from 0, black, to 100, white; Hurtado et al., Citation2009)). The changes in Lightness as a function of pH for cyanidin were very complex (; ). The initial cyanidin Lightness at the lowest pH of 0.5 was 66.8 (). With the pH increase, this lightness decreased (i.e., the colors become darker) until pH 5.0 (L* = 52.9), and then remained low and almost constant from pH 5.0 to 7.5 (L* ≈ 53). Above pH 7.5, there was a further decrease in lightness (i.e., to darker colors) to the minimum at pH ~10.0 (L* = 45.4), where the cyanidin solution was darkest.
Figure 4. Lighness (L*) as a function of pH for the aqueous solutions of 0.2 mmol/L cyanidin (●) and cyanidin 3-O-β-glucopyranoside (○).
Figura 4. Ligereza (L*) en función del pH para las soluciones acuosas de cianidina a 0.2 mmol/L (●) y cianidina 3-O-β-glucopiranósido (○)
As indicated above, for pHs from 8.8 to 10.0, for cyanidin, there was also a shift in the Hue angles from red to greenish tones, while the Chroma was low and almost constant. A possible explanation for this is that in this pH range, the colorless carbinol pseudobase that was formed at lower pHs readily degraded into chalcones, and as these lack the sugars, they are unstable α-diketones (Clifford, Citation2000). These readily degrade to 2,4,6-trihydroxyphenylacetaldehyde and a benzoic acid (Clifford, Citation2000). A further increase in pH resulted in an increase in Lightness, and the cyanidin solutions consequently became lighter, especially in the most alkaline regions, at pH >12 (L* >50). Under the most acidic and most alkaline conditions, these cyanidin solutions had similar and high Lightness, while also showing the highest Chroma values.
The initial Lightness at the lowest pHs for Cy3Glc was lower than for cyanidin (to pH ~4; L* ≈ 45–55, 55–65, respectively), which means that in this pH range, the Cy3Glc solution was much darker (). As previously reported by Heredia et al. (Citation1998), with pH increase, the Lightness of Cy3Glc increased progressively, to reach a maximum between pH 6 and 7 (L* ~60). At the same time, in the pH range from 6.0 to 8.0, Cy3Glc had its lowest Chroma values, and did not show any visually perceptible color, accompanied by a large shift in the Hue angle. This maximum of Lightness, loss of color and appearance of yellowish tones suggested that in this pH range, the carbinol pseudobase and chalcone forms were dominant. At pH >7, the Lightness for Cy3Glc decreased a little (i.e., resulted in a darker color; L* ≈ 40–55), which indicated that other colored forms were being formed. The explanation for this behavior might be that at pH >7 there is further deprotonation of the quinonoidal bases, with the formation of the bluish quinonoidal anions. This conclusion is consistent with the Chroma changes as a function of pH. This further increase in pH and decrease in Lightness for Cy3Glc reached a minimum at pH 11.5 (L* = 41.5). In this most alkaline region, the Lightness started to increase. Thus with Cy3Glc, a symmetric pattern was obtained for the changes in Lightness as a function of pH (), with the maximum at around the center of the pH range (pH 6), in agreement with a previous study by Heredia et al. (Citation1998).
Also of particular interest, the Lightness for the Cy3Glc solution under the most acidic and most alkaline conditions (pH ˂2; pH ˃10) had similar and low values (L* ≈ 45–60); i.e., the Cy3Glc solution was at its darkest in these more extreme regions. This was coupled with its highest Chroma (pH ˂3.9; pH ˃10.0). This resulted in intensively colored solutions under these most acidic and alkaline conditions. Anthocyanins are commercially used in acid solutions, such as carbonated drinks (usually, pH 2.5–3.8) (Timberlake & Henry, Citation1986); in this pH range, Gy3Glc has intensively colored solutions.
In contrast, the Lightness of Cy3Glc reached a maximum between pH 6 and 7; i.e., the Cy3Glc solution was at its lightest in this pH range. This was coupled with its lowest Chroma (pH 6.0–8.0). This was the cause for the loss of color in the neutral pH range; i.e., Cy3Glc solutions do not show visually perceptible colors in neutral media.
Under the most acidic and most alkaline conditions, the cyanidin solution was the lightest. In these extreme regions, the Chroma values for cyanidin were highest, compared to the other pHs, although still lower compared with the Chroma values for Cy3Glc.
Thus, cyanidin and Cy3Glc showed very different patterns for their changes with pH for Lightness. Cy3Glc rapidly lost color with pH increase (i.e., increasing L*), while cyanidin increased in darkness with pH increase (i.e., decreasing L*) (). Differences in the Lightness changes as a function of pH can be attributed to the glucosidic moiety. These data indicate that 3-glucosidic substitution decreases the Lightness under the most acidic and alkaline conditions (pH ˂2; pH ˃10). However, in this case, we did not find any clear pattern that can be related to the impact of the 3-glucosidic substitution on Lightness.
3.4. Influence of pH on color differences
The color differences, ∆E*ab, for cyanidin and Cy3Glc are shown in . As for the reference for the other color coordinates, comparisons of the calculations of these color differences were also referred to those observed at the initial lowest pH of 0.5, where cyanidin and Cy3Glc were in their flavylium forms (i.e., ∆E*ab = 0). Compared with cyanidin, the color differences were higher for Cy3Glc across almost the entire pH range (except for pH <3 and pH 10–11), which indicated the overall lower color stability of Cy3Glc (i.e., higher sensitivity to pH changes) (Hurtado et al., Citation2009) (). Conversely, at pH <3, cyanidin had higher changes in color difference (∆E*ab = 0.9–23.8) than Cy3Glc (∆E*ab = 1.2–6.1), which indicated lower color stability for cyanidin in this region. This is consistent with our previously study that showed low stability of cyanidin and high stability of Cy3Glc at pH 2 (Rakić et al., Citation2015). This greater resistance of Cy3Glc to color changes compared to cyanidin at pH <3 can be explained by the gycosidic moiety of Cy3Glc, which will protect the flavylium cation through steric factors, to restrict hydration and the formation of the colorless carbinol pseudobase. Glycosylation stabilizes the flavylium cation through various mechanisms, including intramolecular H-bonding and modified molecular shape (i.e., resulting in steric hindrance; Borkowski et al., Citation2005). These data are also in agreement with Borkowski et al. (Citation2005), who reported that naturally occurring 3-O-β-glucosylated anthocyanins are more susceptible to water addition than their corresponding aglycons. Over the rest of the pH range in the present study (pH ~4-13.1), cyanidin was shown to be relatively more stable (∆E*ab = 25–45) than Cy3Glc (∆E*ab = 30–60; i.e., smaller changes in ∆E*ab for cyanidin).
Figure 5. Color differences (∆E*ab) relative to the initial values at pH 0.5 as a function of pH for the aqueous solutions of 0.2 mmol/L cyanidin (●) and cyanidin 3-O-β-glucopyranoside (○).
Figura 5. Diferencias de color (∆E*ab) con respecto a los valores iniciales a pH 0.5 en función del pH para las soluciones acuosas de cianidina a 0.2 mmol/L (●) y cianidina 3-O-β-glucopiranósido (○)
Over the lowest pH steps for cyanidin (i.e., pH 0.5–1.5), a large change in the color difference was seen (∆E*ab = 0–16.2), which indicates its low color stability here. Two further large changes in color difference for cyanidin were seen at higher pHs, with an increase from pH 8.8 to 10.0 (∆E*ab = 28.7–43.9), and a decrease from pH 12 to 12.5 (∆E*ab = 37.5–28.9) ().
For the Cy3Glc solution, the four subsequent pH steps from 3.0 to 5.6 each showed very large increases in the color difference (∆E*ab = 6.1–56.5). The next pH steps that showed large changes in the color differences were in low to high alkaline ranges, from pH 8.0 to 10.5 (∆E*ab = 58.4–39.8), from pH 11.0 to 12.5 (∆E*ab = 41.1–57.7), and then to 13.1 (∆E*ab = 47.1).
Overall, these changes in the color differences between the cyanidin solutions of the flavylium colored form (at lowest pH) and the other forms of cyanidin reached a maximum at pH 10.5, with a wide range seen (∆E*ab = 0.9–44.5). The corresponding values for Cy3Glc solution showed a wider range, with the maximum at pH 7.5 (∆E*ab = 1.2–58.4). Therefore, comparing these changes in the color differences it is clear that Cy3Glc was more unstable than cyanidin across almost the entire pH range (except at pH <3 and pH 10–11). Therefore, this glucosidation of cyanidin resulted in larger color differences at pH ˃3 and pH 10–11, and lower color stability of the resulting Cy3Glc.
4. Conclusions
Glucosidic substitution at the C-3 position of cyanidin moved the color tonalities toward the yellow pole of the chromatic circle (i.e., Hue angle). Cyanidin showed large variations in its chromatic tonalities according to pH, while Cy3Glc showed more restricted amplitudes of these nuances. It appears that replacement of the hydrogen atom in C-3–OH group in cyanidin by the β-D-glucosyl moiety results in restrictions to the chromatic tonalities then seen. These changes in Hue angle were accompanied by spectral changes. The 3-glucosidic substitution of cyanidin not only affected λmax-vis, but also altered the shape of the absorbance spectra. The presence of the 3-glucosidic substitution strongly affected the increases in Chroma. Under the most acidic and most alkaline conditions, the cyanidin solution was the lightest. In these extreme pH regions, the Chroma values for cyanidin were at their highest compared with the rest of the pH range here, although they were still low compared with the Chroma values for Cy3Glc. The Cy3Glc solution was darkest under the most acidic and most alkaline conditions. This darker color was coupled with its highest Chroma in these extreme pH regions. As a consequence, Cy3Glc had its most intense color under the most acidic and most alkaline conditions, and did not show visually perceptible colors under the more pH neutral conditions. Under these conditions, there was no clear pattern that could be related to the impact of the 3-glucosidic substitution on Lightness. In the very acidic region (i.e., pH <3) and from pH 10 to 11, cyanidin had lower color stability than Cy3Glc, while in rest of the pH range, the opposite was true. Cy3Glc had low color intensity and low stability in the pH neutral media. There are evident relationships between the color and the chemical composition of these cyanidin and Cy3Glc solutions, such that the replacement of the hydrogen atom at the C-3–OH group in cyanidin with the β-D-glucosyl moiety significantly influences the final color characteristics and stability.
Acknowledgments
This study was supported financially by the Slovenian Research Agency through the Research Programme P4-0121 (NPU) and the bilateral project between the Republic of Slovenia and the Republic of Serbia BI-RS/12-13-015 (NPU, DS). VR was partly financed by the CEPUS SI-8402/2010 bilateral scholarship.
Disclosure statement
The authors declare that they have no conflicts of interest.
Additional information
Funding
References
- Borkowski, T., Szymusiak, H., Gliszczyńska-Swigło, A., & Tyrakowska, B. (2005). The effect of 3-O-β-glucosylation on structural transformations of anthocyanidins. Food Research International, 38(8–9), 1031–1037. https://doi.org/https://doi.org/10.1016/j.foodres.2005.02.020
- Brouillard, R., Iacobucci, G. A., & Sweeny, J. G. (1982). Chemistry of anthocyanin pigments. 9. UV-Visible spectrophotometric determination of the acidity constants of apigeninidin and three related 3-deoxyflavylium salts. Journal of the American Chemical Society, 104(1), 7585–7590. https://doi.org/https://doi.org/10.1021/ja00390a033
- Brouillard, R. (1982). Chemical structure of anthocyanins. In P. Markakis (Ed.), Anthocyanins as food colors (pp. 1–40). Academic Press.
- Castañeda-Ovando, A., De Pacheco-Hernández, M. L., Páez-Hernández, M. E., Rodríguez, J. A., & Galán-Vidal, C. A. (2009). Chemical studies of anthocyanins: A review. Food Chemistry, 113(4), 859–871. https://doi.org/https://doi.org/10.1016/j.foodchem.2008.09.001
- Clifford, M. N. (2000). Anthocyanins – Nature, occurrence and dietary burden. Journal of the Science of Food and Agriculture, 80(7), 1063–1072. https://doi.org/https://doi.org/10.1002/(SICI)1097-0010(20000515)80:7<1063::AID-JSFA605>3.0.CO;2-Q
- Gonnet, J.-F. (1999). Colour effects of co-pigmentation of anthocyanins revisited—2. A colorimetric look at the solutions of cyanin co-pigmented byrutin using the CIELAB scale. Food Chemistry, 66(3), 387–394. https://doi.org/https://doi.org/10.1016/S0308-8146(99)00088-6
- Gonnet, J.-F. (2001). Colour effects of co-pigmentation of anthocyanin revisited—3. A further description using CIELAB differences and assessment of matched colours using the CMC model. Food Chemistry, 75(4), 473–485. https://doi.org/https://doi.org/10.1016/S0308-8146(01)00221-7
- Heredia, F. J., Francia-Aricha, E. M., Rivas-Gonzalo, J. C., Vicario, I. M., & Santos-Buelga, C. (1998). Chromatic characterization of anthocyanins from red grapes -I. pH effect €. Food Chemistry, 63(4), 491–498. https://doi.org/https://doi.org/10.1016/S0308-8146(98)00051-X
- Hurtado, N. H., Morales, A. L., González-Miret, M. L., Escudero-Gilete, M. L., & Heredia, F. J. (2009). Colour, pH stability and antioxidant activity of anthocyanin rutinosides isolated from tamarillo fruit (Solanum betaceum Cav.). Food Chemistry, 117(1), 88–93. https://doi.org/https://doi.org/10.1016/j.foodchem.2009.03.081
- Kong, J. (2003). Analysis and biological activities of anthocyanins. Phytochemistry, 64(5), 923–933. https://doi.org/https://doi.org/10.1016/S0031-9422(03)00438-2
- McGhie, T. K., & Walton, M. C. (2007). The bioavailability and absorption of anthocyanins: Towards a better understanding. Molecular Nutrition and Food Research, 51(6), 702–713. https://doi.org/https://doi.org/10.1002/mnfr.200700092
- Oliveira, J., Fernandes, V., Miranda, C., Santos-Buelga, C., Silva, A., De Freitas, V., & Mateus, N. (2006). Color properties of four cyanidin-pyruvic acid adducts. Journal of Agricultural and Food Chemistry, 54(18), 6894–6903. https://doi.org/https://doi.org/10.1021/jf061085b
- Popović, D., Kocić, G., Katić, V., Jović, Z., Zarubica, A., Janković Veličković, L., Nikolić, V., Jović, A., Kundalić, B., Rakić, V., Ulrih, N. P., Skrt, M., Sokolović, D., Dinić, L., Stojanović, M., Milosavljević, A., Veličković, F., & Sokolović, D. (2019). Protective effects of anthocyanins from bilberry extract in rats exposed to nephrotoxic effects of carbon tetrachloride. Chemico-Biological Interactions, 304(December2018), 61–72. https://doi.org/https://doi.org/10.1016/j.cbi.2019.02.022
- Popović, D., Kocić, G., Katić, V., Zarubica, A., Veličković, L. J., Ničković, V. P., Jović, A., Veljković, A., Petrović, V., Rakić, V., Jović, Z., Ulrih, N. P., Sokolović, D., Stojanović, M., Stanković, M., Radenković, G., Nikolić, G. R., Lukač, А., Milosavljević, A., & Sokolović, D. (2019). Anthocyanins protect hepatocytes against CCL4-induced acute liver injury in rats by inhibiting pro-inflammatory mediators, polyamine catabolism, lipocalin-2, and excessive proliferation of kupffer cells. Antioxidants, 8(10), 451. https://doi.org/https://doi.org/10.3390/antiox8100451
- Rakić, V., Rinnan, Å., Polak, T., Skrt, M., Miljković, M., & Poklar Ulrih, N. (2019). pH-induced structural forms of cyanidin and cyanidin 3-O-β- glucopyranoside. Dyes and Pigments, 165(June2018), 71–80. https://doi.org/https://doi.org/10.1016/j.dyepig.2019.02.012
- Rakić, V., Skrt, M., Miljković, M., Kostić, D., Sokolović, D., & Poklar-Ulrih, N. (2015). Effects of pH on the stability of cyanidin and cyanidin 3-O-β-glucopyranoside in aqueous solution. Hemijska Industrija, 69(5), 511–522. https://doi.org/https://doi.org/10.2298/HEMIND140711072R
- Sigurdson, G. T., Robbins, R. J., Collins, T. M., & Giusti, M. M. (2018, December 1). Impact of location, type, and number of glycosidic substitutions on the color expression of o-dihydroxylated anthocyanidins. Food Chemistry, 268, 416–423. https://doi.org/https://doi.org/10.1016/j.foodchem.2018.06.079
- Sigurdson, G. T., Tang, P., & Giusti, M. M. (2017). Natural colorants: Food colorants from natural sources. Annual Review of Food Science and Technology, 8(1), 261–280. https://doi.org/https://doi.org/10.1146/annurev-food-030216-025923
- Sigurdson, G. T., Robbins, R. J., Collins, T. M., & Giusti, M. M. (2016, October 1). Evaluating the role of metal ions in the bathochromic and hyperchromic responses of cyanidin derivatives in acidic and alkaline pH. Food Chemistry, 208, 26–34. https://doi.org/https://doi.org/10.1016/j.foodchem.2016.03.109
- Stintzing, F. C., Stintzing, A. S., Carle, R., Frei, B., & Wrolstad, R. E. (2002). Color and antioxidant properties of cyanidin-based anthocyanin pigments. Journal of Agricultural and Food Chemistry, 50(21), 6172–6181. https://doi.org/https://doi.org/10.1021/jf0204811
- Timberlake, C. F., & Henry, B. S. (1986). Plant pigments as natural food colours. Endeavour, 10(1), 31–36. https://doi.org/https://doi.org/10.1016/0160-9327(86)90048-7
- Torskangerpoll, K., & Andersen, Ø. M. (2005). Colour stability of anthocyanins in aqueous solutions at various pH values. Food Chemistry, 89(3), 427–440. https://doi.org/https://doi.org/10.1016/j.foodchem.2004.03.002
- Veljković, M., Pavlović, D. R., Stojiljković, N., Ilić, S., Jovanović, I., Poklar Ulrih, N., Rakić, V., Veličković, L., & Sokolović, D. (2017). Bilberry: Chemical profiling, in-vitro and in-vivo antioxidant activity and nephroprotective effect against gentamicin toxicity in rats. Phytotherapy Research, 31(1), 115–123. https://doi.org/https://doi.org/10.1002/ptr.5738
- Zhao, C. L., Chen, Z. J., Bai, X. S., Ding, C., Long, T. J., Wei, F. G., & Miao, K. R. (2014). Structure-activity relationships of anthocyanidin glycosylation. Molecular Diversity, 18(3), 687–700. https://doi.org/https://doi.org/10.1007/s11030-014-9520-z