
ABSTRACT
Dry fermented sausages reduced in pork back-fat and replaced with texturized pea protein (TPP – 0, 10, 15, and 20%) were evaluated for acceptability and sensory properties using a Check-All-That-Apply (CATA) questionnaire under blind and informed conditions. Differences in acceptance were identified in both conditions, indicating that fat reduction and substitution with <15% TPP has a positive impact. Informed liking scores showed no difference from the blind ones. Hence, consumers gave more importance to sensory properties than to label. CATA results indicated that characteristic taste, high-fat amount and delicious can be considered drivers of liking, while acid, off-flavour and low-fat amount are of disliking. Frequency of consumption showed that regular consumers gave higher acceptability to samples, being those with ≥15% TPP less acceptable. Under both conditions, CATA reflected differences for attributes related with fat and texture. Reduction of fat and its replacement with 10% TPP was feasible with no detrimental impact on acceptability.
RESUMEN
La aceptabilidad y las propiedades sensoriales de salchichas curadas fermentadas reducidas en grasa de cerdo y reemplazada con proteína de guisante texturizada (TPP - 0, 10, 15 y 20%) se evaluaron mediante un cuestionario Check-All-That-Apply (CATA) bajo dos condiciones a ciegas e informado. En ambas condiciones se identificaron diferencias en la aceptabilidad, lo que indica que la reducción de grasa y su sustitución con <15% de TPP tiene un impacto positivo. Las puntuaciones de aceptabilidad bajo condición informado no mostraron diferencias con la condición a ciegas. Por tanto, los consumidores dieron más importancia a las propiedades sensoriales que a la información del etiquetado. Los resultados de CATA indicaron que el sabor característico, la cantidad elevada de grasa y delicioso pueden considerarse determinantes de aceptabilidad, mientras que los atributos, ácido, sabor desagradable y cantidad baja en grasa lo son de desagrado. La frecuencia de consumo mostró que los consumidores habituales dieron mayores puntuaciones de aceptabilidad a las muestras, siendo las menos aceptables aquellas con ≥15% TPP. En ambas condiciones, los resultados de CATA reflejaron diferencias en los atributos relacionados con la grasa y la textura. La reducción de la grasa y su reemplazo con un 10% de TPP es factible y no tiene un impacto perjudicial sobre la aceptabilidad.
Introduction
Excessive fat intake has been widely discussed by public health agencies concerned about the increased risk for chronic diseases like obesity, diabetes, hypercholesterolemia, and cardiovascular diseases. They have reported guidelines to aid with an optimal dietary fat intake, which should ideally account for 20 to 35% of the total diet energy (EFSA, Citation2017; WHO, Citation2007). In developed countries, the primary source of fat and saturated fats is from processed foods, especially meat products. Sausages are meat products especially important to the meat industry in Europe, particularly in countries like Germany and those of the Mediterranean area (Spain, Italy, France…), contributing to the diet fat intake. Thus, because of their high fat and sodium content, public health organisations recommend limiting their consumption (Kloss et al., Citation2015).
Moreover, consumers are becoming more demanding, favouring food with healthy and nutritional characteristics. Although many consumers prefer foods with lower fat and energy, they also want foods that taste good (Sampaio et al., Citation2004). Therefore, the food industry faces the challenge of providing nutritious and healthy foods while ensuring that the product has appealing sensory properties (Alejandre et al., Citation2017; Lorenzo et al., Citation2016).
Fat is an essential component of meat products as it provides several features positively related to their sensory and technological quality (Jiménez Colmenero, Citation2000; Mendoza et al., Citation2001).
The reduction of fat in meat products can be achieved by reducing, or partially replacing fat with other compounds like carbohydrates, proteins, or lipid-based substitutes. However, fat reduction affects some important features like salty flavour (Ruusunen, Citation2005), water release during drying (Wirth, Citation1988) or texture (Bloukas et al., Citation1997; Muguerza, Citation2003).
In fermented meat products, a reduction up to 80% total fat is possible from a technological and microbiological point of view (Fernández-Diez et al., Citation2016; Mendoza et al., 2001; Ruiz-Capillas et al., Citation2012). However, in hedonic sensory studies with consumers, many authors have reported that when a greater reduction is applied less acceptable are the products, related to a reduction of juiciness and tenderness, an increase of pungent flavour and an increase of hardness (Fernández-Diez et al., Citation2016; Ruiz-Capillas et al., Citation2012).
Pea protein has been positioned as one of the most viable fat replacer since it possesses good nutritional quality and is regarded as a healthy choice because it is low in calories, has a good protein efficiency ratio, an essential amino acid content, and has potential as a dietary protein fortifier (Owusu-Ansah & Mc Curdy, Citation1991). Still, researchers indicate that legumes protein products like texturized pea protein (TPP) can exhibit weaker gel strength, viscosity, and texture than egg, soy, and meat proteins (Jones, Citation2016). However, new extraction and drying technologies, such as hydrothermal treatments, can improve the functional attributes of pea proteins (Arntfield & Maskus, Citation2011), although there is still little research.
Soy proteins have traditionally been the ingredients used as fat replacers for meat products, like smoked sausages (Rao et al., Citation1984), meatballs, burgers (Perera & America, Citation2011), meat patties (Kassama et al., Citation2003), or ground beef patties (Deliza et al., Citation2002). However, there are no studies regarding the physicochemical and sensorial effects of fat replacement in dry fermented sausages.
Additionally, it is important to consider that during the development or reformulation of food products, the ingredients of the formulation and its effect on consumer acceptance should be considered. Evidence reveals that the provision of nutritional information may allow consumers to switch consumption away from “unhealthy” products in favour of “healthy” food products (Zarkin & Anderson, Citation1992). Several studies have shown that consumer attitudes and beliefs interact with knowledge provided via label information, resulting in differential changes in sensory ratings of labelled test stimuli products (Hellemann et al., Citation1990; Solheim & Lawless, Citation1996; Tuorila, Citation1987).
Thus, the aim of this study was to evaluate the effect of fat reduction and substitution with texturized pea protein on chemical composition, acceptability and sensory characteristics of fuet.
Material and methods
Sample description
Four different fuets (a dry-fermented sausage obtained from a mixture of ingredients based on pork and pork back-fat typical in Spain) were produced following the experimental design showed in . Formulation one (F1) was the control prepared with 60% lean pork and 40% pork back-fat, the other three formulas were prepared with different fat reductions, based on pork back-fat decrease and substitution with TPP. The remaining ingredients (considering that nothing changed on lean pork), the additives (salt, lactose, dextrin, dextrose and species), antioxidants (sodium ascorbate and sodium citrate), preservatives (sodium nitrite and potassium nitrate) and starter culture containing Staphylococcus xylosus were added in equal proportions in all formulations.
Table 1. Formulation of samples.
Tabla 1. Formulación de las muestras
Fuet manufacturing process followed 5 main steps. First, raw meat materials (lean pork and pork back-fat) were homogenised and ground for 1 min in a chilled cutter (2°C). Second, after grounding, the additives, antioxidants, preservatives and starter culture were added to the ground meat and hydrated pea protein and mixed for 1 min. Third, the entire batter was homogenised under vacuum for at least 2 min. The final temperature was less than 14°C in all cases. Fourth, the meat mixture was stuffed into collagen casings of 40–42 mm diameter (Van Hessen) and fifth, the sausages were subjected to drying at 10–12°C and 70–85% HR for 21 days until reaching an Aw below 0.920. All the formulations were developed in a pilot plant (Splendid Foods, S.A., Seva, Spain).
Lean pork meat and pork back-fat were obtained from Patel SAU, a supplier of Splendid Foods, S.A. Salt, lactose, dextrin, dextrose, sodium ascorbate, sodium citrate, sodium nitrite, potassium nitrate, and starter culture were obtained from Cargill SLU (Martorell, Barcelona, Spain). The fat replacer was Peatex® Flakes (AM Nutrition Ingredients, Denmark), composed of 100% yellow peas (Pisum sativum L.). The fat replacer emulsion was prepared by pre-hydrating the texturized pea protein with cold water with a ratio 3:1 (water:texturized pea protein) for 20–30 minutes then it was ready for grinding with the meat.
Proximate composition
Analysis of moisture, ash, protein, fat, and sugar contents were performed according to the Association of Official Analytical Chemists Methods (AOAC International, Citation1997). Moisture content of the samples was determined by the gravimetric method by drying 2 g of the ground sample at 103 ± 2°C to constant weight in an air oven (AOAC official method 950.46). Ash content was determined using a muffle furnace at 550– 600°C for 4 h (AOAC official method 920.153). Fat was determined in a Soxhlet apparatus using petroleum ether as an extraction solvent (AOAC official method 985.15). Total organic nitrogen was determined using the macro Kjeldahl procedure. Protein content of samples was calculated using 6.25 as the conversion factor (AOAC official method 992.15).
Total carbohydrate content was estimated by difference and energy by calculation. Sugars were determined using the Luff-Schoorl method (Instituto Español de Normalización, Citation1984, UNE 34, 199–84). All analyses were performed at the end of the curing process in triplicate using three sausage samples per treatment. All chemicals and solvents were analytical grade, unless otherwise specified.
Consumer test
One-hundred fourteen participants, all consumers of fuet, from 18 to 63 years old, 52% women and 48% men, were recruited from the consumer database set up by the “Research group on Methodology, Methods, Models, and Outcomes of Health and Social Sciences (M3O) (Faculty of Health Sciences and Welfare, The University of Vic-Central University of Catalonia (UVIC-UCC, Vic, Spain)) based on their consumption of the focal products (all consumers).
All consumers took part in two evaluation conditions, blind and informed. In the first session, only the samples were presented (blind condition (B)) to consumers, so they could evaluate their overall acceptability after completing a Check-All-That-Apply (CATA) questionnaire. Acceptability was scored using a nine-point hedonic scale ranging from one (“I extremely dislike”) to nine (“I extremely like”). In the CATA questionnaire, participants were asked to check which among 14 terms list were appropriate when describing each of the fuet samples. These terms were darkness, redness, low-fat amount, high-fat amount, hard, soft, floury, characteristic odour, characteristic taste, delicious, acid, off-odour, off-flavour and distasteful (). The terms were selected based on previous studies (Jorge et al., Citation2015; Pollonio, Citation2015).
Figure 1. Blind condition: (a) Frequency mentioned attributes by CATA in each sample of fuet and (b) Multiple factor analysis (MFA) of CATA attributes and acceptability of fuets with different fat percentage: Plot of MFA correlations among CATA attributes, acceptability and samples.
Attributes with asterisk (*) presented differences (p ≤ .05) between treatments. Sample code: F1 (control): 40% pork back-fat; F2: 30% pork back-fat + 10% texturized pea protein; F3: 25% pork back-fat + 15% texturized pea protein; F4: 20% pork back-fat + 20% texturized pea protein.
Figura 1. Condición a ciegas (sin información): (a) Frecuencia de mención de atributos de CATA en cada muestra de fuet y (b) Análisis de factores múltiples (MFA) de atributos de CATA y aceptabilidad de fuets con diferente porcentaje de grasa: Gráfico de correlaciones MFA entre atributos de CATA, aceptabilidad y muestras.
Atributos con asterisco (*) presentan diferencias (p ≤ .05) entre tratamientos. Código de muestra: F1 (control): 40% grasa de cerdo; F2: 30% grasa de cerdo + 10% proteína de guisante texturizada; F3: 25% grasa de cerdo + 15% proteína de guisante texturizada; F4: 20% grasa de cerdo + 20% proteína de guisante texturizada
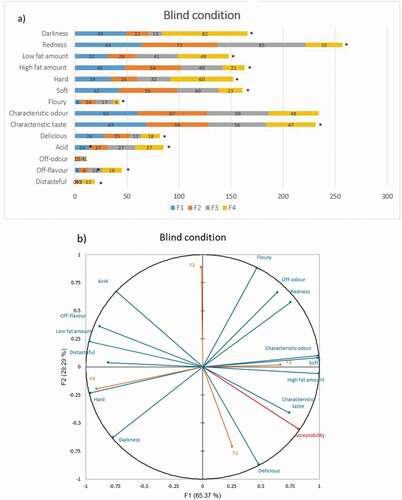
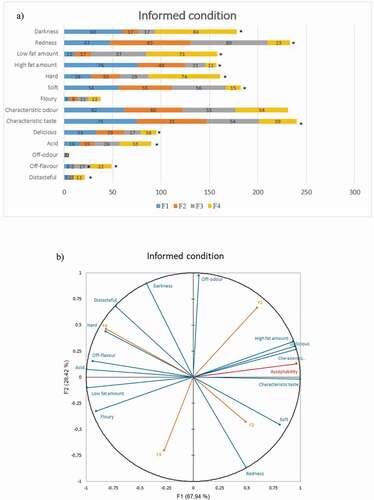
Figure 2. Informed condition: (a) Frequency mentioned attributes by CATA in each sample of fuet and (b) Multiple factor analysis (MFA) of CATA attributes and acceptability of fuets with different fat percentage: Plot of MFA correlations among CATA attributes, acceptability and samples.
Attributes with asterisk (*) presented differences (p ≤ .05) between treatments.Sample code: F1 (control): 40% pork back-fat; F2: 30% pork back-fat + 10% texturized pea protein; F3: 25% pork back-fat + 15% texturized pea protein; F4: 20% pork back-fat + 20% texturized pea protein.
Figura 2. Condición informado: (a) Frecuencia de mención de atributos de CATA en cada muestra de fuet y (b) Análisis de factores múltiples (MFA) de atributos de CATA y aceptabilidad de fuets con diferente porcentaje de grasa: Gráfico de correlaciones MFA entre atributos de CATA, aceptabilidad y muestras.
Atributos con asterisco (*) presentan diferencias (p ≤ .05) entre tratamientos. Código de muestra: F1 (control): 40% grasa de cerdo; F2: 30% grasa de cerdo + 10% proteína de guisante texturizada; F3: 25% grasa de cerdo + 15% proteína de guisante texturizada; F4: 20% grasa de cerdo + 20% proteína de guisante texturizada
Prior to evaluation, consumers were told how the sensory test would be conducted, they filled out a survey about demographic characteristics, meat and sausages consumption habits, willingness to consume meat products reduced in fat, and the willingness to pay more money for these products (). They also completed a questionnaire designed to measure their interest in eating healthy with a multiple scale labelled as “General Health Interest”, proposed by Roininen (Roininen et al., Citation1999). This multi-scale comprised eight statements and the corresponding Likert’s five-point agreement subscales, with the categories ranging from one (strongly disagree) to five (strongly agree). The statements were positive or negative.
Table 2. Demographic characteristics and consumption habits of consumers (n = 114).
Tabla 2. Características demográficas y hábitos de consumo de los consumidores (n = 114)
In the second session, 1 month later, consumers were given the packaging and the corresponding product for tasting (informed condition (I)). In this session they rated both acceptability and CATA questionnaire.
Labels were especially prepared for this study with the aid of the Bizerba program (Intermec PC43t, Joppa, USA), they included an image of the packaging and information about the product type (). All consumers attended the two sessions at the UVIC-UCC Taste Laboratory (Vic, Spain).
Table 3. Main characteristics of samples as declared on label.
Tabla 3. Principales características de las muestras declaradas en el etiquetado
Samples (fuet slices of 3 mm thick) were served at room temperature (20–23°C) in white plastic dishes; mineral water and plain crackers were provided for mouth rinsing. Samples and their packaging were identified with three-digit random codes. To avoid first-position distortions and carry-over effects, the presentation order followed a Williams design for four samples (Macfie et al., Citation1989) within each of the two conditions, and they were presented monadically. The sensory terms listed in CATA were balanced across consumers, following William’s Latin Square experimental design, each consumer received the CATA question with the terms in a different order; this order was modified from sample to sample through the test.
Statistical method
For each formulation, results were expressed as the mean and standard error of the results obtained from the three batches. The difference between the mean of values was determined using analysis of variance (ANOVA); when significant p ≤ .05, the means were separated using Tukey’s test.
The CATA results were analysed by frequency analysis of citations for each sensory term of each treatment. Using SPSS, Cochrans’Q test was performed to find differences between the treatments for each attribute assigned in CATA. The values were evaluated in blind and informed conditions using SPSS, McNemar test. Statistical analysis was carried out with IBM SPSS Statistics V.26.0 (IBMCorp, Armonk, NY, USA) and XLSTAT for Windows (version 2010, Addinsoft, Paris, France).
A multiple-factor analysis (MFA) was performed in the frequency table containing the responses of the CATA questionnaire. This analysis was conducted using XLSTAT with a 5% significance level.
To study the influence of gender, age, consumption frequency, willingness to consume this product, willingness to pay more, and the interest in eating healthy consumers were grouped according to their characteristics: gender (male and female), age group (18–25 years, 26–35 years, and >35 years), and fuet consumption frequency (regular consumers: consumption daily or weekly >3 times per week; occasionally: consumption monthly or occasionally < 2 times per week).
Segmentation of consumers according to their acceptability of samples under conditions was obtained through hierarchical cluster analysis with squared Euclidian distances and Ward’s method. For segments obtained by cluster, Pearson Chi-Square and t-Student analysis were used to study the effect of the age, gender, consume frequency of fuet, willingness to consume this product reduced in fat, willingness to pay more for this product, and interest in eating healthy on acceptability of fuet samples. Significant differences between means were established by Pearson Chi-Square and t-Student (p ≤ .05).
Results and discussion
Proximate composition
The chemical composition and energy level of fuets are summarised in .
Table 4. Chemical composition of samples.
Tabla 4. Composición química de las muestras
While standard sample (F1) has the lowest moisture content (p ≤ .05), the 50% reduced pork back-fat fat sample (F4) shows the highest (p ≤ .05). Similar results were obtained in a sausage and beef samosas where the water content increased with the fat substitution with texturised vegetable protein (Hidayat et al., Citation2017; Omwamba, Citation2014). Higher water content was also found in the other meat products substituted with soy protein (Akesowan, Citation2008).
The results of statistical analyses indicate that the ash content of the samples was significantly (p ≤ .05) affected by TPP addition. Ash content increases with greater pea protein addition, with the highest value for 20% of pea protein added (F4) and the lowest value for the control sample (F1).
The protein content was not significantly affected by increasing the substitution of pork fat with TPP in F2 and F3 (p ≤ .05). However, in F4 protein content increases significantly (p ≤ .05) because of the addition of TPP. In several studies protein content increased with an increase of texturised protein (Hidayat et al., Citation2017).
As expected, the fat content decreases significantly with increasing percentage of pork back-fat replacement and TPP substitution in the fuet formula; F1 presents the highest fat content (p ≤ .05). When comparing with F1, the fat content of F2, F3, and F4 reduces by 3.93%, 10.39%, and 20.13%, respectively. These results are like other studies where fat content decreased significantly (p ≤ .05) with an increase of texturised protein (Akesowan, Citation2008; Hidayat et al., Citation2017; Omwamba, Citation2014; Perera & America, Citation2011). This reduction of fat causes a proportional reduction of energy. Thus, energy decreases significantly with increasing percentage substitution of TPP in the different samples.
If calculated based on dry extract, the reductions correspond to 2.60%, 8.36% and 15.78% respectively, being significant differences between F1, F3 and F4. On the other hand, replacing 10% of the initial pork fat in the F2 formulation by pea protein does not reflect on the final result on dry matter, i.e., this significant reduction in fat is not seen at the analytical level on dry matter.
Carbohydrates increase significantly (p ≤ .05) in F3 and in F4. These results were similar in meatballs and burgers where meat was replaced by TPP (Perera & America, Citation2011).
Overall liking and CATA for fuet
Blind condition
Liking scores varied significantly between samples, with values ranging from 5.54 to 6.48 () suggesting that consumer response to the sensory characteristics of the fuet was different among samples. shows that fuet with ≤ 25% of pork back-fat and ≥ 15% pea protein were less acceptable to consumers, and no differences exist between the control and formulated sample with 10% of pea protein.
Table 5. Overall acceptability mean values of fuet samples evaluated under blind and informed conditions by consumers (n = 114).
Tabla 5. Valores promedio de aceptabilidad global de las muestras de fuet evaluadas a ciegas y con información por los consumidores (n = 114)
CATA results ()) show there were statistically significant differences between samples for the following attributes: darkness (<0.001), redness (<0.001), low-fat amount (0.004), high-fat amount (<0.001), hard (<0.001), soft (<0.001), floury (<0.010), characteristic odour (<0.05), characteristic taste (<0.001), delicious (<0.05), acid (<0.05), off-flavour (<0.05) and distasteful (<0.001). For the control sample, the most common systematic results cited are those for appearance, redness (64), darkness (49) and high-fat amount (48), and characteristic odour (60) from flavour attributes. A greater number of systematic citations for the attribute’s redness (73), high-fat amount (54), characteristic odour (67) and characteristic taste (59) are given to the sample F2. For the sample F3, the attributes redness (85), low-fat amount (41), characteristic odour (59) and characteristic taste (56) are the most cited by consumers. The terms darkness (82), low-fat amount (49), characteristic odour (48), and characteristic taste (47) characterise sample F4. So, there is a clear difference in the perception of the content of fat between samples high in fat, F1 and F2, respect those F3 and F4 considered low in fat. A greater number of the attribute delicious (28) relate to a better acceptance for sample F1, the formulation that corresponds closely to the commercial sample, probably because it was an optimised formulation available in the market for the consumers. In addition, those attributes with negative characteristics like distasteful, off-odour, and off-flavour were less cited in F1. Thus, from a food development perspective, attributes with significant values should be considered when optimising low-fat fuets.
) shows the representation of fuet on the first principal plane (first and second dimensions) obtained from the multiple factor analysis. The first two principal dimensions explain 94.66% of the variability in the experimental data (first dimension: 65.37%; second dimension: 29.29%). The first dimension separates samples according to the type of product (samples with no pea protein or less percentage on the right side and the remaining products on the left), while a second dimension separates the F1 sample on the bottom side from the rest (with different pea protein percentages). On the right side, sample F1 is characterised by the terms characteristic taste and delicious while F2 is described with the terms redness, characteristic odour, soft, and high-fat amount. On the left side, F3 is described as acid and floury and F4 as off-flavour, low-fat amount, distasteful, hard, and darkness.
These results indicate that some terms like characteristic taste, high-fat amount, and delicious are considered drivers of liking, while the terms acid, off-flavour, and low-fat amount are considered drivers of disliking. Thus, the content of fat amount it’s an important parameter when reformulating fuets, because clearly affect the acceptability of the product.
Informed condition
Liking scores varies between samples, like the blind condition test, with values ranging from 5.69 to 6.53 (), indicating that fuets with ≤ 25% of pork back-fat and ≥ 15% pea protein were again those least acceptable to consumers.
CATA results ()) show statistically significant differences between samples for the same attributes than in the blind condition except for the characteristic odour and floury, that are identified with differences under the blind condition.
When consumers are informed, F1’s most common systematic results cited are those related with appearance, high-fat amount (76) and darkness (60), and those with flavour, characteristic taste (75) and characteristic odour (62). The most cited attributes for sample F2 are redness (83), soft (55), characteristic taste (72) and characteristic odour (60). For the sample F3, the attributes redness (80), low-fat amount (57), soft (56), and characteristic odour (55) are most cited by consumers. The terms darkness (84), hard (74), low-fat amount (73), and characteristic odour (54) characterise sample F4. The same trend as in the blind condition, a significantly greater number of citations for the attribute delicious (33) relate to a better acceptance for sample F1, while a significant lower number of citations for the attributes distasteful, off-odour, flavour, and off-flavour are identified.
Regarding the MFA under the informed condition ()) the first two dimensions explains 96.36% of the data variance, showing 67.94% and 28.42% in the first and second dimensions, respectively. ) shows that the distribution of samples and attributes was like the blind conditions. In the MFA graph, F1 and F2 are in the right quadrants, while F3 and F4 are in the left quadrants.
Sample F1 is characterised with high-fat amount, delicious, and characteristic odour. F2 sample is characterised with the terms characteristic taste, soft, and redness. F3 is characterised with floury and low-fat amount, while F4 is characterised with acid, off-flavour, hard, distasteful, and dark.
Therefore, the results under the informed condition indicate, as in the blind condition, that delicious, high-fat amount, characteristic taste, and odour are considered drivers of liking for fuet, while the terms acid, off-flavour, and low-fat amount are drivers of disliking.
Comparison between blind and informed evaluations
When comparing the studied conditions, in all the evaluated samples informed liking scores did not differ significantly from the blind ones (I – B), indicating that information did not affected acceptability scores (). Thus, we surmise that consumers give more importance to the sensory properties of the fuet than to the label information, which could not counteract hedonic liking based on sensory experience. However, in studies with other types of products, such as milk and soybean vanilla beverages (Villegas et al., Citation2008), calorie-reduced yoghurt (Johansen et al., Citation2010), and low-fat spread (Kähkönen et al., Citation1996) an effect of information was clearly identified, indicating that consumers liking scores were dictated by the information on the packaging. The differences in our results could be because of the different motivations that consumers have when consuming these types of products. Unlike other products, sausages like fuet are mainly consumed for its characteristic taste, so consumer liking scores are strongly based on what they perceive when tasting it and hardly affected by information (Khajavi et al., Citation2020).
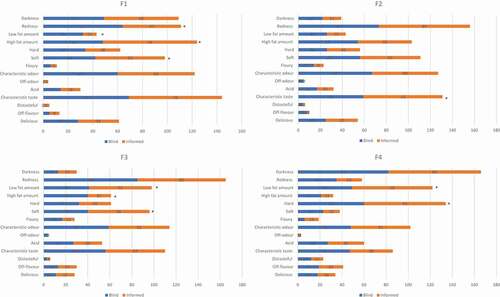
CATA results under the two studied conditions didn’t reflect significant differences for most of the evaluated attributes, except for those related mainly with the content of fat and texture (). In F1 differences identified were in redness, low-fat amount, high-fat amount, and soft. Under the informed condition, consumers evaluated samples less red and low in fat amount while evaluated samples softer and higher in fat. In F2 differences were identified for the characteristic taste, while under the informed condition consumers evaluated samples with a higher characteristic taste. For F3 differences were given for the attributes low-fat amount, high-fat amount and, soft. Under the informed condition, consumers evaluated the samples softer, lower in fat amount, and less in high-fat amount. For F4 differences were identified in low-fat amount and hard. As expected, under the informed condition samples were considered lower in fat and harder.
Figure 3. Comparison of frequency mentioned attributes by CATA in each sample of fuet between conditions (blind and informed).
Attributes with asterisk (*) presented differences (p ≤ .05) between treatments.Sample code: F1 (control): 40% pork back-fat; F2: 30% pork back-fat + 10% texturized pea protein; F3: 25% pork back-fat + 15% texturized pea protein; F4: 20% pork back-fat + 20% texturized pea protein.
Figura 3. Comparación de los atributos de frecuencia mencionados por CATA en cada muestra de fuet entre condiciones (a ciegas e informado).
Atributos con asterisco (*) presentan diferencias (p ≤ .05) entre tratamientos. Código de muestra: F1 (control): 40% grasa de cerdo; F2: 30% grasa de cerdo + 10% proteína de guisante texturizada; F3: 25% grasa de cerdo + 15% proteína de guisante texturizada; F4: 20% grasa de cerdo + 20% proteína de guisante texturizada
Therefore, when the consumer had the labelling information of the ingredients and nutritional facts, the information influenced the specific attributes evaluation under the informed condition. Here specifically, those attributes related to fat content and texture, despite information given, had no effect on acceptability.
Influence of demographic characteristics and consumer habits on acceptability and sensory attributes
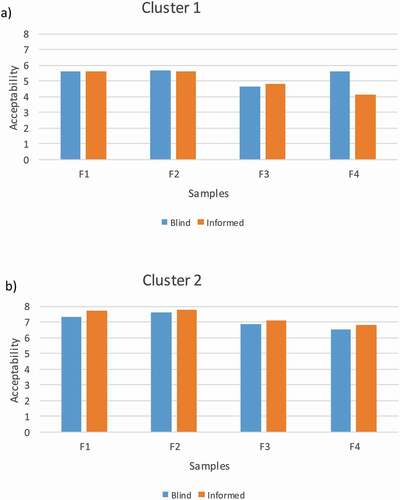
To understand if different preference patterns were related to demographic characteristics or consumer habits (), consumers were segmented according to their fuet acceptability scores, and two groups of consumers were identified: cluster 1 composed by 65 participants and cluster 2 by 45 participants (). Only the influence of fuet frequency of consumption (regular consumers and occasionally consumers) explains differences on acceptability data from both clusters.
Figure 4. Consumer segmentation. Dendrogram obtained from the hierarchical cluster analysis of acceptability data.
Figura 4. Segmentación de los consumidores. Dendograma obtenido del análisis de agrupamiento jerárquico de aceptabilidad
Consumers in cluster 1, which was the largest group of participants, was formed mainly for occasionally consumers of fuet (monthly consumption or <2 times per week) who gave low scores to samples, ranging under blind condition from 4.74 to 5.7 and under informed condition from 4.14 to 5.64 ()). Still, if they did not like very much fuet samples, the differences in acceptability for this cluster followed the same trend as cluster 2, formed by consumers who consumed fuet regularly (daily consumption or >3 times per week); their mean scores under the blind condition are from 6.53 to 7.6 and under informed condition from 6.85 to 7.75 ()). Thus, regular consumers of fuet award significantly higher acceptability values to all samples. Duffy and Bartoshuk obtained similar results, concluding that differences in acceptability responses were not only because of sensory attributes of samples but also to other consumer characteristics, such as consumer habits and individual preferences (Duffy & Bartoshuk, Citation2000). This would confirm that habitual consumption of food increases its acceptability. Luckow & Delahunty observed a significant increase in the acceptability of a series of probiotic beverages after they were consumed daily for a week (Luckow & Delahunty, Citation2004), while Stein et al. found a positive correlation between familiarity and the level of liking in a study on the acceptance of bitter beverages (Stein et al., Citation2003).
Figure 5. Variation in fuet acceptability values for each group of consumers, (a) cluster 1 and (b) cluster 2.
Sample code: F1 (control): 40% pork back-fat; F2: 30% pork back-fat + 10% texturized pea protein; F3: 25% pork back-fat + 15% texturized pea protein; F4: 20% pork back-fat + 20% texturized pea protein.
Figura 5. Variación en la aceptabilidad de fuet para cada grupo de consumidores, (a) grupo1 y (b) grupo 2.
C?digo de muestra: F1 (control): 40% grasa de cerdo; F2: 30% grasa de cerdo + 10% proteína de guisante texturizada; F3: 25% grasa de cerdo + 15% proteína de guisante texturizada; F4: 20% grasa de cerdo + 20% proteína de guisante texturizada
No differences are identified when evaluating CATA attributes for both clusters. Therefore, when the consumer has the labelling information of the ingredients and its nutritional profile, the frequency of consumption of fuet did not explain differences of sensory attributes from cluster 1 and 2.
According to these results, we conclude that segmentation gives additional information, not evident in the global results, however in this case, confirms that reducing fat content and increasing the percentage of TPP, samples are less acceptable for all consumers.
Conclusions
The texturized pea protein evaluated in the present study was technologically feasible to obtain a nutritional improvement, reducing energy level and fat content of fermented dry sausages with a reduced fat content. Formulations F2, F3 and F4 with 10%, 15% and 20% of texturized pea protein respectively, and a replacement of 25%, 37.5% and 50% of pork back-fat, obtained significantly reduced energy levels and total fat decrease. Despite this result, further work should be carried out in order to obtain a significant fat reduction on F2, especially given the good sensorial results obtained by the pea protein.
When comparing conditions, samples informed liking scores showed no significant difference from the blind ones, indicating that information did not affect acceptability. Hence, we can conclude that information in this product has less influence than the sensory properties.
When evaluating CATA attributes, results show that the content of fat amount it’s a determinant parameter when reformulating fuets, because clearly affect the acceptability of the product, both in blind and under informed conditions.
When evaluating the effect of information, labelling has an impact especially for those attributes mainly related with the texture and fat content, despite information given, had no effect on acceptability.
These results confirm the importance of studying the effect of nutritional improvements on product acceptability to understand consumer responses to a new product feature that also will be declared on the labelling.
Acknowledgments
This research was conducted with the support of Industrial Doctorate by the Government of Catalonia with support from The Agency for Management of University and Research Grants (AGAUR) with the agreement 2017 D1039. Moreover, a special acknowledgement to Splendid Foods, S.A. must be made.
Disclosure statement
No potential conflict of interest has been reported by the author(s).
Additional information
Funding
References
- Akesowan, A. (2008). Effect of soy protein isolate on quality of light pork sausages containing konjac flour. African Journal of Biotechnology, 7(24), 4586–4590.
- Alejandre, M., Passarini, D., Astiasarán, I., & Ansorena, D. (2017). The effect of low-fat beef patties formulated with a low-energy fat analogue enriched in long-chain polyunsaturated fatty acids on lipid oxidation and sensory attributes. Meat Science, 134, 7–13. https://doi.org/https://doi.org/10.1016/j.meatsci.2017.07.009
- AOAC International. (1997). Official methods of analysis. In Official methods of analysis (16th ed.).
- Arntfield, S. D., & Maskus, H. D. (2011). Peas and other legume proteins. In Handbook of food proteins (pp. 233–266). Woodhead Publishing.
- Bloukas, J. G., Paneras, E. D., & Fournitzis, G. C. (1997). Effect of replacing pork backfat with olive oil on processing and quality characteristics of fermented sausages. Meat Science, 45(2), 133–144. https://doi.org/https://doi.org/10.1016/S0309-1740(96)00113-1
- Deliza, R., Serna Saldivar, S. O., Germani, R., Benassi, V. T., & Cabral, L. C. (2002). The effects of colored textured soybean protein (TSP) on sensory and physical attributes of ground beef patties. Journal of Sensory Studies, 17(2), 121–132. https://doi.org/https://doi.org/10.1111/j.1745-459X.2002.tb00337.x
- Duffy, V. B., & Bartoshuk, L. M. (2000). Food acceptance and genetic variation in taste. Journal of the American Dietetic Association, 100(6), 647–655. https://doi.org/https://doi.org/10.1016/S0002-8223(00)00191-7
- EFSA. (2017). Dietary reference values for nutrients summary report. EFSA Supporting Publications, 14(12), 15. https://doi.org/https://doi.org/10.2903/sp.efsa.2017.e15121
- Fernández-Diez, A., Caro, I., Castro, A., Salvá, B. K., Ramos, D. D., & Mateo, J. (2016). Partial fat replacement by boiled quinoa on the quality characteristics of a dry-cured sausage. Journal of Food Science, 81(8), C1891–C1898. https://doi.org/https://doi.org/10.1111/1750-3841.13393
- Hellemann, U., Tuorila, H., Lampi, A.-M., & Matuszewska, I. (1990). Hedonic responses and attitudes related to fats used as spreads on bread. Food Quality and Preference, 2(1), 29–38. https://doi.org/https://doi.org/10.1016/0950-3293(90)90028-S
- Hidayat, B. T., Wea, A., & Andriati, N. (2017). Physicochemical, sensory attributes and protein profile by SDS-PAGE of beef sausage substituted with texturized vegetable protein. Food Research, 2(1), 20–31. https://doi.org/https://doi.org/10.26656/fr.2017.2(1).106
- Instituto Español de Normalización. (1984). UNE 34 199-84: Azúcar Determinación de azúcares reductores expresados en azúcar invertido o en D-glucosa (Método de Luff - Schoorl). IRANOR.
- Jiménez Colmenero, F. (2000). Relevant factors in strategies for fat reduction in meat products. Trends in Food Science & Technology, 11(2), 56–66. https://doi.org/https://doi.org/10.1016/S0924-2244(00)00042-X
- Johansen, S. B., Næs, T., Øyaas, J., & Hersleth, M. (2010). Acceptance of calorie-reduced yoghurt: Effects of sensory characteristics and product information. Food Quality and Preference, 21(1), 13–21. https://doi.org/https://doi.org/10.1016/j.foodqual.2009.07.003
- Jones, O. G. (2016). Recent advances in the functionality of non-animal-sourced proteins contributing to their use in meat analogs. Current Opinion in Food Science, 7, 7–13. https://doi.org/https://doi.org/10.1016/j.cofs.2015.08.002
- Jorge, É. D. C., Mendes, A. C. G., Auriema, B. E., Cazedey, H. P., Fontes, P. R., Ramos, A. D. L. S., & Ramos, E. M. (2015). Application of a check-all-that-apply question for evaluating and characterizing meat products. Meat Science, 100, 124–133. https://doi.org/https://doi.org/10.1016/J.MEATSCI.2014.10.002
- Kähkönen, P., Tuorila, H., & Rita, H. (1996). How information enhances acceptability of a low-fat spread. Food Quality and Preference, 7(2), 87–94. https://doi.org/https://doi.org/10.1016/0950-3293(95)00040-2
- Kassama, L. S., Ngadi, M. O., & Raghavan, G. S. V. (2003). Structural and instrumental textural properties of meat patties containing soy protein. International Journal of Food Properties, 6(3), 519–529. https://doi.org/https://doi.org/10.1081/JFP-120021456
- Khajavi, M. Z., Abhari, K., & Hosseini, F. B. (2020). Functional meat products: The new consumer’s demand. Current nutrition & food science, 16( 3), 260–267. https://doi.org/https://doi.org/10.2174/1573401315666190227161051
- Kloss, L., Meyer, J. D., Graeve, L., & Vetter, W. (2015). Sodium intake and its reduction by food reformulation in the European Union — A review. NFS Journal, 1, 9–19. https://doi.org/https://doi.org/10.1016/j.nfs.2015.03.001
- Lorenzo, J. M., Munekata, P. E. S., Pateiro, M., Campagnol, P. C. B., & Domínguez, R. (2016). Healthy Spanish salchichón enriched with encapsulated n − 3 long chain fatty acids in konjac glucomannan matrix. Food Research International, 89(1), 289–295. https://doi.org/https://doi.org/10.1016/j.foodres.2016.08.012
- Luckow, T., & Delahunty, C. (2004). Which juice is ‘healthier’? A consumer study of probiotic non-dairy juice drinks. Food Quality and Preference, 15(7–8), 751–759. https://doi.org/https://doi.org/10.1016/j.foodqual.2003.12.007
- Macfie, H. J., Bratchell, N., Greenhoff, K., & Vallis, L. V. (1989). Designs to blance the effect of order of presentation and firt-order carry-over effects in hall tests. Journal of Sensory Studies, 4(2), 129–148. https://doi.org/https://doi.org/10.1111/j.1745-459X.1989.tb00463.x
- Mendoza, E., Garcı́a, M. L., Casas, C., & Selgas, M. D. (2001). Inulin as fat substitute in low fat, dry fermented sausages. Meat Science, 57(4), 387–393. https://doi.org/https://doi.org/10.1016/S0309-1740(00)00116-9
- Muguerza, E. (2003). Effect of fat level and partial replacement of pork backfat with olive oil on the lipid oxidation and volatile compounds of greek dry fermented sausages. Journal of Food Science, 68(4), 1531–1536. https://doi.org/https://doi.org/10.1111/j.1365-2621.2003.tb09679.x
- Omwamba, M. (2014). Effect of texturized soy protein on quality characteristics of beef samosas. International Journal of Food Studies, 3(1), 74–81. https://doi.org/https://doi.org/10.7455/ijfs/3.1.2014.a7
- Owusu-Ansah, Y. J., & Mc Curdy, S. M. (1991). Pea proteins: A review of chemistry, technology of production, and utilization. Food Reviews International, 7(1), 103–134. https://doi.org/https://doi.org/10.1080/87559129109540903
- Perera, C., & America, R. (2011). Evaluation of meat analogues made with Texturized Pea Protein for their functionality and applications in nutritionally improved meatless formula. In Technical presentation from Roquette to Institute of Food Technologists Conference.
- Pollonio, M. (2015). Check all that apply and free listing to describe the sensory characteristics of low sodium dry fermented sausages: Comparison with trained panel. Food Research International, 76(3), 725–734. https://doi.org/https://doi.org/10.1016/j.foodres.2015.06.035
- Rao, L. O., Draughon, F. A., & Melton, C. C. (1984). Sensory characters of thuringer sausage extended with textured soy protein. Journal of Food Science, 49(2), 334–336. https://doi.org/https://doi.org/10.1111/j.1365-2621.1984.tb12415.x
- Roininen, K., Lähteenmäki, L., & Tuorila, H. (1999). Quantification of consumer attitudes to health and hedonic characteristics of foods. Appetite, 33(1), 71–88. https://doi.org/https://doi.org/10.1006/appe.1999.0232
- Ruiz-Capillas, C., Triki, M., Herrero, A. M., Rodriguez-Salas, L., & Jiménez-Colmenero, F. (2012). Konjac gel as pork backfat replacer in dry fermented sausages: Processing and quality characteristics. Meat Science, 92(2), 144–150. https://doi.org/https://doi.org/10.1016/j.meatsci.2012.04.028
- Ruusunen, M. (2005). Reducing sodium intake from meat products. Meat Science, 70(3), 531–541. https://doi.org/https://doi.org/10.1016/j.meatsci.2004.07.016
- Sampaio, G. R., Castellucci, C. M. N., Pinto E Silva, M. E. M., & Torres, E. A. F. S. (2004). Effect of fat replacers on the nutritive value and acceptability of beef frankfurters. Journal of Food Composition and Analysis, 17(3–4), 469–474. https://doi.org/https://doi.org/10.1016/j.jfca.2004.03.016
- Solheim, R., & Lawless, H. T. (1996). Consumer purchase probability affected by attitude towards low-fat foods, liking, private body consciousness and information on fat and price. Food Quality and Preference, 7(2), 137–143. https://doi.org/https://doi.org/10.1016/0950-3293(95)00045-3
- Stein, L. J., Nagai, H., Nakagawa, M., & Beauchamp, G. K. (2003). Effects of repeated exposure and health-related information on hedonic evaluation and acceptance of a bitter beverage. Appetite, 40(2), 119–129. https://doi.org/https://doi.org/10.1016/S0195-6663(02)00173-3
- Tuorila, H. (1987). Selection of milks with varying fat contents and related overall liking, attitudes, norms and intentions. Appetite, 8(1), 1–14. https://doi.org/https://doi.org/10.1016/S0195-6663(87)80022-3
- Villegas, B., Carbonell, I., & Costell, E. (2008). Effects of product information and consumer attitudes on responses to milk and soybean vanilla beverages. Journal of the Science of Food and Agriculture, 88(14), 2426–2434. https://doi.org/https://doi.org/10.1002/jsfa.3347
- WHO. (2007). WHO European Action plan for food and nutrition Policy 2007-2012.
- Wirth, F. (1988). Technologies for making fat-reduce meat products. What possibilities are there? Fleischwirtschaft, 68(9), 1153–1156.
- Zarkin, G. A., & Anderson, D. W. (1992). Consumer and producer responses to nutrition label changes. American Journal of Agricultural Economics, 74(5), 1202. https://doi.org/https://doi.org/10.2307/1242786