
 ?Mathematical formulae have been encoded as MathML and are displayed in this HTML version using MathJax in order to improve their display. Uncheck the box to turn MathJax off. This feature requires Javascript. Click on a formula to zoom.
ABSTRACT
For shelf-life prolongation, the effect of super-chilling (SC, −1.5 °C) combined with food antistaling agents (FAAs) on the chemical and microbiological proprieties of chicken breast were investigated. The results showed a significant difference (P < .05) in protein solubility in the chicken breast stored under SC plus FAA for 8 and 16 days compared with 4 °C storage; dynamic rheological analysis revealed that they had better gel characteristics than those under SC or 4 °C storage. Moreover, SC with FAA significantly decreased the chicken breast pH, total viable count, total volatile basic nitrogen and thiobarbituric acid reactive substance contents, and electrical conductivity (P < .01), and significantly increased the water-holding capacity (P < .01). Conclusively, SC plus FAA storage is recommended for meat and meat products because of its effectiveness at preserving the quality of fresh chicken meat, providing longer shelf lives than chicken under SC or 4 °C storage.
RESUMEN
el presente estudio investigó el efecto producido en las propiedades químicas y microbiológicas de la pechuga de pollo por el superenfriamiento (SC, −1.5 °C) combinado con agentes antienranciamiento alimentarios (FAA), cuando éstas son sometidas a dicho proceso para prolongar su vida útil. Los resultados dan cuenta de una diferencia significativa (P < .05) en la solubilidad de la proteína de la pechuga de pollo almacenada bajo SC y sujeta a FAA durante 8 y 16 días, en comparación con el almacenamiento a 4 °C. Asimismo, el análisis reológico dinámico permitió constatar que las pechugas sometidas a ambos procesos poseen mejores características de gel que aquellas a las que se aplicó bajo SC o que fueron almacenadas a 4 °C. Además, el SC, en combinación con el uso de los FAA, disminuyó significativamente el pH de la pechuga de pollo, el recuento total de viables, el contenido total de nitrógeno volátil básico y de sustancias reactivas del ácido tiobarbitúrico, así como la conductividad eléctrica (P < .01), al tiempo que elevó significativamente la capacidad de retención de agua (P < .01). En conclusión, debido a su eficacia en la conservación de la calidad de la carne de pollo fresca, se recomienda el almacenamiento SC más el uso de FAA tanto para la carne como para los productos cárnicos, pues proporciona una vida útil más larga que el almacenamiento SC o a 4 °C.
1. Introduction
Chicken production is the most prominent livestock industry in most parts of the world, owing to its low cost and high nutritional value. However, chicken meat is highly perishable, with its shelf-life varying between 4 − 10 days under refrigeration, depending on the degree of post-mortem processing. In addition, chicken meat products contaminated with microorganisms are undesirable from the standpoint of public health, storage quality, and general sensory characteristics (Del et al., Citation2007). Despite research on the preservation of fresh poultry meat and/or poultry products using various antistaling agents (Athinag et al., Citation2010), the standard preservative condition used is mainly refrigeration, which grants the products a shelf-life of only 10–12 days.
Super-chilling (SC), in which the storage temperature is controlled within the zero to the freezing-point range, offers an alternative and promising technique for meat and meat product preservation without resorting to freezing. SC storage has two main features, fast chilling rate stemming from the high heat-exchange capacity and small temperature fluctuation range (± 0.02 °C) owing to strict control, as compared with regular refrigerated storage (± 1 °C). In contrast with standard freezing, SC provides a storage condition that does not physically damage the meat muscle cells, as it prevents ice crystal formation (Zhu et al., Citation2016). SC at nonfreezing temperatures, between the freezing point of water and that of an individual material, can prolong the storage life of fresh food and provide good quality retention (Jing et al., Citation2016).
Food antistaling agent (FAA) paper, pretreated with alcohol and citric acid, has high antibacterial and mildew-proof performances. Moreover, the invisible protective layer made of ethanol and citric acid can kill a variety of mold and putrefying bacteria (Bischoff et al., Citation2000). Moreover, it can help keep the food fresh by absorbing free water and preventing water loss.
Previous researches mainly focused on the effect of SC or antiseptic agents on chicken breasts. However, there is comparatively little information on the effect of their combination on meat quality, especially chicken breast. Therefore, two preservation methods, antiseptic agents combined with SC (−1.5°C), were chosen in this study, and the present study aimed to investigate the effect of FAAs combined with SC (−1.5°C) on the physicochemical, microbiological, and dynamic rheological proprieties of chicken breast meat.
2. Materials and methods
2.1. Animals and sample preparation
Chicken breasts (n = 256) were obtained directly from a local market (Xinxiang, China) on the day of the experiment and immediately transported to the laboratory. Under aseptic conditions, the chicken breasts were cut into six equal sections (approximately 6 cm×10 cm×2.5 cm), weighed (average weight of 150 g ± 20.20 g) and kept in sterile polyethylene trays covered with lids. Six sections from chicken breasts were randomly assigned into three treatments groups, i.e. control (4°C), SC (−1.5°C), and SC combined with four FAAs (−1.5 °C plus FAA) (Shenzhen Chunwang Environmental Protection Technology Co., Shenzhen, China). FAAs were fixed on the lids with double-side tape, avoiding touching the meat samples. Chicken breasts were removed from storage on days 0, 2, 4, 6, 8, 10, 12, 14, 16, 18, 20, and 22 for analysis.
2.2. pH measurement
The pH values were measured using a digital pH meter (model FE20, Mettler Toledo Instrument Inc., Shanghai, China). According to the method proposed by Zhou et al. (Citation2018), a 5-gram sample was homogenized in 50 mL distilled water, and the pH value was determined in triplicate.
2.3. Colorimetric measurements
Color values were measured using a Minolta chroma meter CR-400 (Konica Minolta sensing, Tokyo, Japan). The spectrophotometer was calibrated before analysis with a white standard plate provided by the manufacturer. When opening the packages, the color coordinates of L* (lightness), a* (redness), and b* (yellowness) were recorded at each sampling point. All the tests were performed in triplicate.
2.4. Water-holding capacity (WHC) measurement
WHC was analyzed using centrifugation, cooking, and drip loss measurement according to the method proposed by Zhou et al. (Citation2018), with a slight modification.
Centrifugation loss was measured according to the method proposed by Zhou et al. (Citation2018) with a slight modification. To determine the centrifugation loss, each chicken breast sample (10 g) was placed in a centrifuge tube packaged with absorbing papers and centrifuged at 5000 g for 10 min at 4°C. The centrifugation loss (%) of the meat samples was calculated as follows:
where M1 and M2 are the initial and final weights of the meat, respectively.
Cooking loss was determined by calculating the weight difference before and after cooking (Zhou et al., Citation2018). First, the grounded meat samples (10 g) were put into a retort pouch and incubated at 85°C in a thermostat water bath for 15 min. Then, each meat sample was weighed again after cooling down to room temperature (25 °C). The cooking loss (%) of the meat samples was calculated as follows:
where M1 and M2 are the initial and final weights of the meat, respectively.
Drip loss was measured using the method proposed by Zhou et al. (Citation2017) with slight modification. To determine the drip loss, fresh chicken breast samples (10 g) obtained on 0 d were weighed and recorded as initial weight (W1). The weighed samples were placed into polyethylene plastic bags, labeled, vacuum packaged and stored at 4°C for 24 h. Then the samples were removed from the bags, gently blotted dry, weighed and recorded as W2. The drip loss (%) of meat samples was calculated as follows:
2.5. Microbiological evaluation
Chicken samples (25 g) were homogenized in 225 mL of sterile saline solution (0.85% NaCl) and serially diluted 1/10 with the same solution. A 1 mL aliquot of each diluted sample was spread on Luria-Bertani agar (Haibo Biology Co. Ltd., Qingdao, China) in glass Petri dishes and incubated at 37 °C for 48 h. The results were reported as log 10 CFU/g. All the treatments were repeated twice, and each test was performed in triplicate (M. M. Zhu et al., Citation2020).
2.6. Thiobarbituric acid reactive substances (TBARS) analysis
The thiobarbituric acid (TBA) content was determined as described by Sohaib et al. (Citation2017), with a slight modification. First, the ground meat samples (10 g) were placed in a 100 mL flask and homogenized in 40 mL (8% w/v) of trichloroacetic acid for 15 s (T25; IKA Works, Inc., Wilmington, NC, USA). After 1 h, the samples were centrifuged at 1,610 g for 10 min. Next, the supernatants were filtered through a filter paper and diluted with distilled water up to 50 mL. The filtrate (6 mL) was mixed with 6 mL TBA (0.02 M) and heated at 95 °C for 30 min till the development of a rose-pink color, and then cooled with cold flowing water. After centrifugation at 4472 g for 10 min at room temperature (25 °C), the absorbance of the supernatant was measured at 532 nm using a UV-Vis spectrometer (Purkinje General Instrument, Beijing, China); 6 mL (8% w/v) trichloroacetic acid mixed with 6 mL TBA was used as the blank control. TBA values were calculated from a standard malondialdehyde (MDA) curve with 1,1,1,3-teraetoxipropane and are expressed as mg of MDA per kg of chilled chicken sample.
2.7. Total volatile basic nitrogen (TVB-N) measurements
TVB-N content determination in chilled pork was performed using a semimicro-quantitative nitrogen method according to Chinese standard GB/T 5009.228 (2016). In brief, the grounded samples (20 g) were dissolved in 100 mL trichloroacetic acid and vibrated for 30 min. After filtration, 5 mL impregnation liquids, 5 mL MgO (10 g/L), and 2 drops of dimethicone were added into a Kjeldahl distillation unit. The mixture was distilled in 10 mL of 20 g/L boric acid for 5 min and titrated with 10 mM HCl and methyl red. The TVB-N concentration was evaluated as follows:
TVB-N (mg/100 g) = [(V1− V2) × C × 14 × 100]/[m × 0.1], where V1 and V2 represent the titration volume (mL) of the tested and black samples, respectively; C is the actual concentration of HCl (M); 14 is the molecular weight of nitrogen; m is the weight of the chicken sample (g). The result indicated for each sample is the mean value of three measurements.
2.8. Protein solubility measurement
Protein solubility was determined using a method described by Zhang et al. (Citation2017), with minor modifications. Total protein was extracted from 1 g of the meat sample using 20 mL of ice-precooled 1.1 M potassium iodide (0.1 M potassium phosphate buffer, pH 7.2), whereas sarcoplasmic protein was extracted from 0.25 g sample using 5 mL of ice-precooled 0.025 M potassium phosphate buffer (pH 7.2). The samples were minced, homogenized in an ice bath (5100 g for 20 s) thrice, vibrated at 4°C overnight, and then centrifuged at 1000 g (4°C) for 20 min. The protein concentration in the supernatants was measured using the Biuret method. The difference in value between total and sarcoplasmic protein solubility was expressed as myofibrillar protein solubility and represented as mg/g.
2.9. Electrical conductivity measurement
Electrical conductivity was evaluated by applying a conductivity meter (Mettler Seven Compact Co., Shanghai, China) in accordance with the method of Yang et al. (Citation2013). Briefly, chicken meat (10 g) was minced and homogenized in 100 mL of distilled water. Then, the conductivity electrode was inserted directly until a stable reading was obtained.
2.10. Dynamic rheological assessment
The rheological differences between thawed and fresh samples were characterized using the HAAKE MARS 40 rheometer (Thermo Scientific, Waltham, MA, USA) with a cone-plate geometry (0.5 mm gap). The measurement started at 20 °C and was run at a heating rate of 2 °C/min, over the range of 20–80 °C, according to Yasin et al. (Citation2015). A constant strain amplitude of 10% was chosen to cut the samples at 0.1 Hz. The variation of storage modulus (G’) and temperature was recorded.
2.11. Statistical analysis
Statistical analysis of the data was carried out using the Statistical Package for Social Sciences (SPSS) (SPSS 20.0, IBM Corp., Armonk, NY, USA). One-way analysis of variance was performed, and significant differences among treatments were compared using Duncan’s multiple range test. P-values < 0.05 were considered statistically significant. All experiments were conducted in quadruplicate, and all values are expressed as means with their standard deviation.
3. Results and discussion
3.1. pH data
The pH data are shown in . The pH initially decreased and then gradually increased under the different storage conditions. The pH of samples with SC plus FAA was lower (P < .05) than that of samples stored with SC alone on days 4, 6, 10, 14, and 16. The pH under 4 °C reached 6.88 on day 8, exceeding the acceptable pH 6.7 limit implemented by the Chinese hygienic standard (GB2707-2016) for fresh livestock meat. In contrast, the maximum pH of the samples stored with SC alone and SC plus FAA was 6.2 and 6.09, respectively. The increase in pH of the stored fresh chicken breasts could be attributed to the growth of microorganisms on the surface of the meat, a phenomenon that induced the degradation of different nutrients such as fats and amino acids (Zhao et al., Citation2019). In addition, the FAAs tested included edible alcohol and citric acid, which can lower the pH values of meat and prevent the multiplication of most bacteria (Bischoff et al., Citation2000; Kanellos & Burriel, Citation2005).
Figure 1. Changes in pH of chicken breast storage in 4 °C, SC and SC plus FAAs (4 °C: storage in 4°C, SC: storage in −1.5 °C, SC plus FAAs: storage in −1.5 °C combined with food antistaling agents).
Figura 1. Cambios en el pH de la pechuga de pollo almacenada a 4 °C, SC y SC más FAA (4 °C: almacenamiento a 4 °C; SC: almacenamiento a −1.5°C; SC más FAA: almacenamiento a −1.5°C combinado con agentes antienranciamiento alimentarios)
3.2. Colorimetric data
The changes in chicken meat color during storage are shown in . The L* and a* values significantly decreased in all groups, whereas the b* parameter increased during storage (P < .05). The results are consistent with the findings of Juan et al. (Citation2018) and Kim et al. (Citation2015). This observation could be attributed to the oxidation of myoglobin that resulted in the formation of metmyoglobin in the background of decreased metmyoglobin reducing activity, resulting from the binding of the heme iron of myoglobin to the citric acid or the inhibition of pink pigment formation in response to acidification (Adeyemi et al., Citation2015; Kieffer et al., Citation2000). Redness reduction in chicken products during storage is believed to be due to lipid and pigment oxidation with time. Overall, this outcome may be supported by the higher moisture content and lower expressible drip induced by the citric acid treatment (Bojarska et al., Citation2003).
Table 1. Changes in colorimetric measurements of chicken breast storage in 4 °C, SC and SC plus FAAs.
Tabla 1 Cambios en las mediciones colorimétricas de la pechuga de pollo almacenada a 4 °C, SC y SC más FAA
3.3. WHC data
The centrifugation, cooking, and drip loss parameters were significantly increased in the samples stored under 4 °C as compared with those treated with SC and SC plus FAA during storage (P < .05; ). On day 8, the centrifugation, cooking, and drip loss parameters of the samples treated with SC plus FAA were 21.73%, 22.65%, and 3.56%, respectively, compared with 32.13%, 30.67%, and 11.03% in the samples under 4 °C storage. Similar to the findings reported by Shao (Citation2015), these results show that the combination of SC and FAA may improve the WHC of chicken breast meat.
Figure 2. Changes in WHC of chicken breast storage in 4 °C, SC and SC plus FAAs (4 °C: storage in 4°C, SC: storage in −1.5 °C, SC plus FAAs: storage in −1.5 °C combined with food antistaling agents, (a): Centrifugation, (b): Cooking loss, (c): Drip loss).
Figura 2. Cambios en la WHC [capacidad de retención de agua] de la pechuga de pollo almacenada en 4 °C, SC y SC más FAAs (4 °C: almacenamiento a 4°C; SC: almacenamiento a −1.5 °C; SC más FAA: almacenamiento a −1.5 °C combinado con agentes antienranciamiento alimentarios; a: centrifugación, b: pérdida por cocción; c: pérdida por goteo)
![Figure 2. Changes in WHC of chicken breast storage in 4 °C, SC and SC plus FAAs (4 °C: storage in 4°C, SC: storage in −1.5 °C, SC plus FAAs: storage in −1.5 °C combined with food antistaling agents, (a): Centrifugation, (b): Cooking loss, (c): Drip loss).Figura 2. Cambios en la WHC [capacidad de retención de agua] de la pechuga de pollo almacenada en 4 °C, SC y SC más FAAs (4 °C: almacenamiento a 4°C; SC: almacenamiento a −1.5 °C; SC más FAA: almacenamiento a −1.5 °C combinado con agentes antienranciamiento alimentarios; a: centrifugación, b: pérdida por cocción; c: pérdida por goteo)](/cms/asset/ee541c8c-da4f-4dad-b214-d01806ca3314/tcyt_a_1989493_f0002_b.gif)
The factors affecting the water holding capacity include the formation and extent of internal pressure during freezing, irreversibility of water removal from cells (extent of water resorption), physiological status of the tissue, and intrinsic water-binding prior to partial freezing (Kaale & Eikevik, Citation2015). This beneficial outcome may be attributed to the inhibition of proteolytic enzymes derived from the chicken and microorganisms, which are known to contribute to muscle tissue spoilage and water loss in response to the icy temperature along with the citric acid and ethanol (Khare et al., Citation2016). Therefore, the results indicated that the fresh chicken breasts treated with SC plus FAA during storage would maintain better WHC.
3.4. Microbiological analysis results
In the microbiological evaluation, the total viable count (TVC) was significantly different (P < .01) among the various treatments ()). Initial TVC of all samples was about 3.5 lg colony-forming units (CFU)/g, which indicated good quality of the starting material. After 6 days, the highest TVC was observed in the samples (5.98 lg CFU/g) stored at 4 °C, whereas SC plus FAA-treated samples had the lowest TVC (only 4.23 lg CFU/g). On day 16, the TVC reached 6.39 and 5.18 lg CFU/g in samples stored with SC alone and SC plus FAAs, respectively. The good inhibitory effect observed, which was similar to data reported by Zhu et al. (Citation2016) and Kim et al. (Citation2015), suggests that the application of FAAs with the control freezing-point temperature could extend the shelf-life of chicken breast meat. Temperature is very important for microbiological growth. The control freezing-point temperature can inhibit the growth of microbiota (Yamane, Citation2009). Moreover, the FAAs used included citric acid and ethanol, which prolonged the shelf life of ready-to-cook barbecue chicken meat. (Khaledian et al., Citation2019).
Figure 3. Changes in total viable count, TBARS, TVB-N and electrical conductivity of chicken breast storage in 4 °C, SC and SC plus FAAs (4 °C: storage in 4°C, SC: storage in −1.5 °C, SC plus FAAs: storage in −1.5 °C combined with food antistaling agents, (a): total viable count, (b): TBARS, (c): TVB-N, (d): electrical conductivity).
Figura 3. Cambios en el recuento viable total, TBARS, TVB-N y conductividad eléctrica de la pechuga de pollo almacenada a 4 °C, SC y SC más FAA (4 °C: almacenamiento a 4 °C; SC: almacenamiento a −1.5 °C; SC más FAA: almacenamiento a −1.5 °C combinado con agentes antienranciamiento alimentarios; (a): recuento viable total; (b): TBARS; (c): TVB-N; (d): conductividad eléctrica)
3.5. TBARS data
TBARS values represent lipid oxidation content and are used as an important indicator to assess the quality of meat products. The treatment (P < .01) and storage time (P < .01) had a significant effect on TBARS formation ()). Chicken breasts treated with SC and FAAs exhibited significantly lower TBARS values than SC alone-treated samples (P < .01), and 4 °C-stored controls showed the highest values. A significant increase in TBARS was observed with storage time, possibly due to the production of TBARS as a secondary product of lipid oxidation from the decomposition of oxidized lipid molecules via lipid hydroperoxides (Brannan, Citation2008). The lowest TBARS values of SC with FAA-treated samples, which corresponded with the results of Khare et al. (Citation2016), may be attributed to the synergistic effect of ice temperature with ethanol and citric acid on lipid peroxidation. Low-temperature storage can affect oxidative rancidity and may contribute to lipid oxidation inhibition (Zhu et al., Citation2015).
3.6. TVB-N production
TVB-N, which is mainly composed of trimethylamine (TMA), dimethylamine (DMA), ammonia, and other compounds, is primarily produced by the activity of microbial enzymes during the degradation of proteins and nonprotein nitrogenous compounds (Yi et al., Citation2011). TVB-N formation in different tested chicken breasts is shown in ). At storage onset, the TVB-N values of chicken breasts were 7.26, 6.97, and 6.54 mg/100 g for 4 °C, SC alone, and SC with FAA groups, respectively. The growth rate of TVB-N was lower in SC with FAA samples than in the other treatment groups, suggesting that both the temperature and FAA effects were significant. Significant differences (P < .05) in the TVB-N production rate were observed from day 4 onward between the 4 °C and SC, and SC plus FAA-treated samples. The TVB-N content of 4 °C and SC-alone treated samples increased by an average of 2.26 and 1.24 mg/day, respectively, whereas it only increased by 0.83 mg/day in the SC plus FAA treatment group. The results and the trend of TVB-N production observed in this study were similar to those reported by Khare et al. (Citation2016). TVB-N, which is highly associated with the amino acid decarboxylase activity of microorganisms during storage, is widely used as an index to assess the quality and shelf-life of poultry and poultry products (Balamatsia et al., Citation2007). Furthermore, TVB-N is widely used as a reference index for assessing the spoilage and shelf life of the meat products (Zhao et al., Citation2019). Zhu et al. (Citation2016) found that TVB-N and microbial counts (mesophilic and psychrotrophic) were highly correlated. The TVB-N values for chicken breast samples after 6, 14, and 20 days of storage under 4 °C, SC alone, and SC plus FAA, respectively, exceeded the upper limit values of 20 mg/100 g.
3.7. Protein solubility
The effects of different storage conditions on protein solubility are presented in . The protein solubility decreased significantly with the storage duration (P < .05), and the total, sarcoplasmic, and myofibrillar protein solubility significantly differed among the three storage treatments. The decline rate of the total protein was 4.42% per day in the sample under 4 °C, followed by 2.09% in the SC group and 1.46% in SC with FAA-treated samples. The fastest rate of sarcoplasmic protein decline was observed in the 4 °C treated sample (4.23% per day) followed by SC storage (2.03% per day), and the lowest was in the SC with FAA samples (1.49% per day). Further analysis showed significant differences (P < .01) between the treatment at 4 °C and the other two treatments on day 8 and between the treatment at SC alone and SC with FAA from day 14. The samples under 4 °C also showed the fastest myofibrillar protein decline rate (4.51% per day), followed by those of SC alone-storage (2.10% per day), and those treated with SC plus FAA had the lowest decline rate (1.58% per day). The results showed that SC with FAA treatment delays protein solubility decline rate compared with refrigeration and SC-alone treatments. Protein solubility is often used as an indicator of protein denaturation and low WHC (Bowker & Zhuang, Citation2015). Protein denaturation in the chicken breast meat was determined by an increase in MFI during storage. Additionally, myofibril fragmentation is associated with the degree of proteolysis during meat storage (Kaewthong et al., Citation2019).
Table 2. Changes in protein solubility of chicken breast storage in 4 °C, SC and SC plus FAAs.
Tabla 2 Cambios en la solubilidad de la proteína de la pechuga de pollo almacenada a 4 °C, SC y SC más FAA
3.8. Electrical conductivity
The electrical conductivity of different treatments is shown in ). The different treatments (P < .01) and storage time (P < .01) had a significant effect on the electrical conductivity of meat samples. From day 4, the electrical conductivity of the 4 °C treated samples was higher than that of SC alone and SC plus FAA treatments. From day 10, the electrical conductivity of the SC group was higher than that of SC plus FAA samples. These results show that the electrical conductivity of chicken meat can be significantly decreased under SC and FAA combination treatment compared with refrigeration and SC-alone storage. Moreover, the electrical conductivity can be used to evaluate meat freshness. During storage, meat and meat products produce abundant conductive material due to the activity of enzymes and microorganisms, leading to increased electrical conductivity (Marta et al., Citation2010). According to Yang et al. (Citation2013), the electrical conductivity is positively correlated with the TVB-N. Accordingly, in the present study, the electrical conductivity observed showed a similar trend to that observed in the TVB-N value.
3.9. Dynamic rheological test
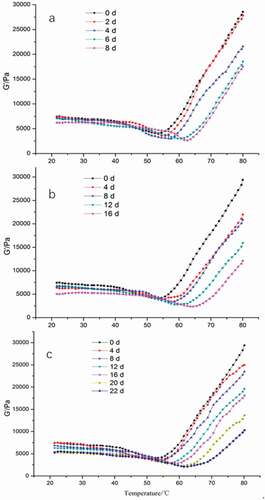
Currently, the dynamic rheological test is used to assess the heat-induced gelation of myofibrillar proteins, which reflects the overall protein quality (Visessanguan et al., Citation2000; Zhu et al., Citation2015). Herein, the storage modulus (G’), in particular, was used to measure the deformation in energy stored in the chicken meat during the shear process, which reflects the elastic behavior of the samples (Ali et al., Citation2015). G’ changes in chicken samples subjected to different storage conditions are presented in . The observed changes in G’ were divided into three stages: gel formation, gel weakening, and gel strengthening zone. For all samples, G’ exhibited similar curves at different storage periods, with a slow decrease at the beginning, followed by a rapid drop to the minimum value due to degradation, oxidation, or fragmentation of the myofibrillar proteins (Kang et al., Citation2014a; Miller et al., Citation2020) and a rapid increase to the maximum value triggered by the formation of an elastic gel network, which contributed to enhanced gel strength (Kang et al., Citation2016, Citation2014b). However, the minimum and maximum G’ values were lower with increased storage time, whereas the temperature of the minimum value was increased. At the same storage time-point (example day 8), the minimum and maximum G’ values of the 4 °C treated samples were the lowest (2636.05 and 18558 Pa, respectively), whereas those of the SC with FAA were the highest (3779.37 and 23525.66 Pa, respectively). On the same day, the minimum G’ value temperature was 62 and 54 °C for the 4 °C and SC plus FAA groups, respectively. Altogether, the results showed that the proteins of the chicken breast samples stored in SC with FAA were more sensitive and susceptible to heat denaturation than the 4 °C refrigerated samples. Furthermore, the G’ value in this study was higher compared with the loss modulus (G”) values, demonstrating that the behavior of the samples was solid-like and the deformations were essentially elastic (Rao, Citation2014).
Figure 4. Changes in elastic modulus (G′) of chicken breast storage in 4 °C, SC and SC plus FAAs (4 °C: storage in 4°C, SC: storage in −1.5 °C, SC plus FAAs: storage in −1.5 °C combined with food antistaling agents).
Figura 4. Cambios en el módulo elástico (G′) de la pechuga de pollo almacenada a 4 °C, SC y SC más FAA (4 °C: almacenamiento a 4 °C; SC: almacenamiento a −1.5 °C; SC más FAA: almacenamiento a −1.5 °C combinado con agentes antienranciamiento alimentarios)
4. Conclusion
Based on microbial and biochemical analyses, the combination of SC with FAA seems to represent a better approach to maintain the freshness of chicken breast meat compared with storage under 4 °C and treatment with FAA. In addition, the SC and FAA combination could prevent pH increase, TVB-N and TBARS production, and maintain the color of chicken breast meat for 22 days. Hence, SC with FAA may halt chicken breast meat deterioration and extend the shelf-life of this meat, thereby reducing losses, benefiting both the chicken meat industry and individuals who consume chicken products.
Disclosure statement
No potential conflict of interest was reported by the author(s).
References
- Adeyemi, K. D., Sabow, A. B., Shittu, R. M., Karim, R., Karsani, S. A., & Sazili, A. Q. (2015). Impact of chill storage on antioxidant status, lipid and protein oxidation, color, drip loss and fatty acids of semimembranosus muscle in goats. CyTA - Journal of Food, 14(5), 1–10. https://doi.org/https://doi.org/10.1080/19476337.2015.1114974
- Ali, S., Zhang, W., Rajput, N., Khan, M. A., Li, C. B., & Zhou, G. H. (2015). Effect of multiple freeze–thaw cycles on the quality of chicken breast meat. Food Chemistry, 173, 808–814. https://doi.org/https://doi.org/10.1016/j.foodchem.2014.09.095
- Athinag, N., Vasilikii, G., & Ioannisn, S. (2010). Combined natural antimicrobial treatments (EDTA, lysozyme, rosemary and oregano oil) on semi cooked coated chicken meat stored in vacuum packages at 4°C: Microbiological and sensory evaluation. Innovative Food Science & Emerging Technologies, 11(1), 187–196. https://doi.org/https://doi.org/10.1016/j.ifset.2009.09.004
- Balamatsia, C. C., Patsias, A., Kontominas, M. G., & Savvaidis, I. N. (2007). Possible role of volatile amines as quality-indicating metabolites in modified atmosphere-packaged chicken fillets: Correlation with microbiological and sensory attributes. Food Chemistry, 104(4), 1622–1628. https://doi.org/https://doi.org/10.1016/j.foodchem.2007.03.013
- Bischoff, W. E., Reynolds, T. M., Sessler, C. N., Edmond, M. B., & Wenzel, R. P. (2000). Handwashing compliance by health care workers: The impact of introducing an accessible, alcohol-based hand antiseptic. Archives of Internal Medicine, 160(7), 1017–1021. https://doi.org/https://doi.org/10.1001/archinte.160.7.1017
- Bojarska, U., Bartura, J., & Cierach, M. (2003). The effect of measurement site on the evaluation of tom breast muscle colour. Wageningen Agricultural University the Netherlands Esprit Project Nr, 126 (1998), 567–575. doi:https://doi.org/10.1053/j.gastro.2003.11.061.
- Bowker, B., & Zhuang, H. (2015). Relationship between water-holding capacity and protein denaturation in broiler breast meat1. Poultry Science, 94(7), 1657–1662. https://doi.org/https://doi.org/10.3382/ps/pev120
- Brannan, R. G. (2008). Effect of grape seed extract on physicochemical properties of ground, salted, chicken thigh meat during refrigerated storage at different relative humidity levels. Journal of Food Science, 73(1), 36–40. https://doi.org/https://doi.org/10.1111/j.1750-3841.2007.00588.x
- Del, R. E., Panizomorán, M., Prieto, M., Alonsocalleja, C., & Capita, R. (2007). Effect of various chemical decontamination treatments on natural microflora and sensory characteristics of poultry. International Journal of Food Microbiology, 115(3), 268–280. https://doi.org/https://doi.org/10.1016/j.ijfoodmicro.2006.10.048
- Jing, L., Wang, Y., Wang, R., Wang, C., & Wu, D. (2016). Effects of controlled freezing-point storage on quality of fresh-cut Broccoli. Advance Journal of Food Science and Technology, 12(6), 317–325. https://doi.org/https://doi.org/10.19026/ajfst.12.2967
- Juan, D. U., Liu, L., Huang, X., & Liu, Y. (2018). Study on quality changes of chilled chicken during storage. Farm Products Processing, 447 (1), 6–9. doi:https://doi.org/10.16693/j.cnki.1671-9646(X).2018.01.002.
- Kaale, L. D., & Eikevik, T. M. (2015). The influence of superchilling storage methods on the location/distribution of ice crystals during storage of Atlantic salmon (Salmo salar). Food Control, 52(2015), 19–26. https://doi.org/https://doi.org/10.1016/j.foodcont.2014.12.022
- Kaewthong, P., Pomponio, L., Carrascal, J. R., Knøchel, S., Wattanachant, S., & Karlsson, A. H. (2019). Changes in the quality of chicken breast meat due to superchilling and temperature fluctuations during storage. Journal of Poultry Science, 4(56), 325–332. doi:https://doi.org/10.2141/jpsa.0180106.
- Kanellos, T. S., & Burriel, A. R. (2005). The in vitro bactericidal effects of the food decontaminants lactic acid and trisodium phoshate. Food Microbiology, 22(6), 591–594. https://doi.org/https://doi.org/10.1016/j.fm.2004.11.013
- Kang, Z. L., Li, B., Ma, H. J., & Chen, F. S. (2016). Effect of different processing methods and salt content on the physicochemical and rheological properties of meat batters. International Journal of Food Properties, 19(7), 1604–1615. https://doi.org/https://doi.org/10.1080/10942912.2015.1105819
- Kang, Z. L., Zou, Y. F., Xu, X. L., Zhu, C. Z., Wang, P., & Zhou, G. H. (2014a). Effect of various amounts of pork and chicken meat on the sensory and physicochemical properties of Chinese-style meatball (kung-wan). Food Science & Technology Research, 19(6), 963–970. https://doi.org/https://doi.org/10.3136/fstr.19.963
- Kang, Z. L., Zou, Y. F., Xu, X. L., Zhu, C. Z., Wang, P., & Zhou, G. H. (2014b). Effect of a beating process, as a means of reducing salt content in Chinese-style meatballs (kung-wan): A physico-chemical and textural study. Meat Science, 96(1), 147–152. https://doi.org/https://doi.org/10.1016/j.meatsci.2013.06.019
- Khaledian, Y. M., Pajohi‐Alamoti, B., & Bazargani‐Gilani, B. (2019). Development of cellulose nanofibers coating incorporated with ginger essential oil and citric acid to extend the shelf life of ready‐to‐cook barbecue chicken. Journal of Food Processing and Preservation, 43(10), e14114. https://doi.org/https://doi.org/10.1111/jfpp.14114
- Khare, A. K., Abraham, R. J. J., Rao, V. A., & Babu, R. N. (2016). Utilization of carrageenan, citric acid and cinnamon oil as an edible coating of chicken fillets to prolong its shelf life under refrigeration conditions. Veterinary World, 9(2), 166–175. https://doi.org/https://doi.org/10.14202/vetworld.2016.166-175
- Kieffer, K. J., Claus, J. R., & Wang, H. (2000). Inhibition of pink color development in cooked, uncured ground Turkey by the addition of citric acid. Journal of Muscle Foods, 11(3), 235–243. https://doi.org/https://doi.org/10.1111/j.1745-4573.2000.tb00428.x
- Kim, J., Hong, G., Lim, K., Park, W., & Lee, C. (2015). Influence of citric acid on the pink color and characteristics of sous vide processed chicken breasts during chill storage. Korean Journal for Food Science of Animal Resources, 35(5), 585–596. https://doi.org/https://doi.org/10.5851/kosfa.2015.35.5.585
- Marta, C. G., Patricia, B., Fidel, T., & Pedro, F. (2010). Low-frequency dielectric spectrum to determine pork meat quality. Innovative Food Science & Emerging Technologies, 11(2), 376–386. https://doi.org/https://doi.org/10.1016/j.ifset.2010.01.011
- Miller, D. K., Acevedo, N. C., Lonergan, S. M., Sebranek, J. G., & Tarté, R. (2020). Rheological characteristics of mechanically separated chicken and chicken breast trim myofibril solutions during thermal gelation. Food Chemistry, 307, 125557. https://doi.org/https://doi.org/10.1016/j.foodchem.2019.125557
- National Standard of Food Safety. (2016). Test method for total volatile basic nitrogen in food (GB 5009.228). The National Health and Family Planning Commission.
- Rao, M. A. (2014). Rheological behavior of processed fluid and semisolid foods. In M. A. Rao (Ed.), Rheological behavior of processed fluid and semisolid foods. Rheology of fluid, semisolid, and solid foods (pp. 231–329). Springer US.
- Shao, L. (2015). Study on properties of freezing-point storage and quality kinetic during storage for chicken breast. Anhui agricultural university.
- Sohaib, M., Anjum, F. M., Arshad, M. S., Imran, M., Imran, A., & Hussain, S. (2017). Oxidative stability and lipid oxidation flavoring volatiles in antioxidants treated chicken meat patties during storage. Lipids in Health & Disease, 16(1), 27–36. https://doi.org/https://doi.org/10.1186/s12944-017-0426-5
- The state administration of quality supervision inspection and quarantine and the National standardization management committee (GB2707(2016)). Chinese hygienic standard of fresh and frozen meat.
- Visessanguan, W., Ogawa, M., Nakai, S., & An, H. (2000). Physicochemical changes and mechanism of heat-induced gelation of arrow tooth flounder myosin. Journal of Agricultural & Food Chemistry, 48(4), 1016–1023. https://doi.org/https://doi.org/10.1021/jf9900332
- Yamane, A. (2009). Development of controlled freezing-point storage of foods. Nippon Shokuhin Kogyo Gakkaishi, 29(1), 51–53. doi:https://doi.org/10.1515/eujal-2014-0027.
- Yang, X. J., Zhang, X., Zhao, J. Y., Wang, G. J., Xiao, Y., & Tao, L. L. (2013). Application of conductivity evaluate pork freshness. Modern Food Science & Technology, 29(5), 1178–1180. doi:https://doi.org/10.13982/j.mfst.1673-9078.2013.05.050.
- Yasin, H., Babji, A. S., & Ismail, H. (2015). Optimization and rheological properties of chicken ball as affected by κ-carrageenan, fish gelatin and chicken meat. LWT - Food Science and Technology, 66, 79–85. https://doi.org/https://doi.org/10.1016/j.lwt.2015.10.020
- Yi, S., Li, J., Zhu, J., Lin, Y., Fu, L., Chen, W., & Li, X. (2011). Effect of tea polyphenols on microbiological and biochemical quality of collichthys fish ball. Journal Science and Food Agriculture, 91(9), 1591–1597. https://doi.org/https://doi.org/10.1002/jsfa.4352
- Zhang, X., Gao, T., Song, L., Zhang, L., Jiang, Y., Li, J. L., Gao, F., & Zhou, G. H. (2017). Effects of different thawing methods on the quality of chicken breast. International Journal of Food Science and Technology, 52(9), 1–9. https://doi.org/https://doi.org/10.1111/ijfs.13488
- Zhao, S., Li, N., Li, Z., He, H., & Ma, H. (2019). Shelf life of fresh chilled pork as affected by antimicrobial intervention with nisin, tea polyphenols, chitosan, and their combination. International Journal of Food Properties, 22(1), 1047–1063. https://doi.org/https://doi.org/10.1080/10942912.2019.1625918
- Zhou, Y., Wang, W., Ma, F., Li, P. J., & Chen, C. G. (2018). High-pressure pretreatment to improve the water retention of sodium-reduced frozen chicken breast gels with two organic anion types of potassium salts. Food and Bioprocess Technology 11(1), 1–10. doi:https://doi.org/10.1007/s11947-017-2023-z.
- Zhu, M. M., Peng, Z. Y., Lu, S., Hong-Ju He, H. J., Kang, Z. L., Ma, H. J., Zhao, S. M., & Wang, Z. R. (2020). Physicochemical properties and protein denaturation of pork longissimus dorsi muscle subjected to six microwave-based thawing methods. Foods, 9(26), 1–16.
- Zhu, Y., Ma, L., Yang, H., Xiao, Y., & Xiong, Y. L. (2016). Super-chilling (−0.7°C) with high CO2 packaging inhibits biochemical changes of microbial origin in catfish (Clarias gariepinus) muscle during storage. Food Chemistry, 206, 182–190. https://doi.org/https://doi.org/10.1016/j.foodchem.2016.03.053
- Zhu, Y., Zhang, K., Ma, L., Huo, N., Yang, H., & Hao, J. (2015). Sensory, physicochemical, and microbiological changes in vacuum packed channel catfish (Clarias lazera) patties during controlled freezing-point storage. Food Science & Biotechnology, 24(4), 1249–1256. https://doi.org/https://doi.org/10.1007/s10068-015-0160-6