
ABSTRACT
This study aimed to investigate the acute effect of 100 grams of germinated brown rice (GBR) intake on plasma glucose and insulin, serum levels of peptide YY (PYY) and neuropeptide Y (NPY), as well as appetite perception in healthy subjects compared to white rice (WR). Compared to WR (p < .05, all), serum NPY was lower at 60 minutes and 120 minutes after GBR ingestion and further decreased after 120 minutes (p < .05) compared to the baseline levels. Neither GBR nor WR had any effect on PYY, glucose, or insulin levels. Decreased hunger and increased fullness after ingestion were reported in both instances but did not differ between the rice types. In conclusion, we revealed novel evidence that GBR decreased serum NPY levels, while both GBR and WR decreased hunger and increased the perception of fullness. These results suggest that GBR might slow down the subjects’ appetites through the NPY effect.
Introduction
The prevalence of overweight and obesity has progressively increased worldwide, particularly in developed countries (Afshin et al., Citation2017). Obesity, classified by body mass index (BMI), increases health risks, including diabetes mellitus and cardiovascular diseases (Piché et al., Citation2020), in both adults and children (Afshin et al., Citation2017; Dallman, Citation2010). The prevention of obesity by promoting negative energy balance – less energy intake than energy expenditure – is the most challenging method for reducing body weight in obese individuals (Foster-Schubert et al., Citation2008). Additionally, reducing appetite is another way to lose body weight (“Weight Loss Agents,”, Citation2012).
The gut-brain axis produces several hormones that modulate appetite and metabolism, resulting in changes in energy homeostasis (Stocker & Cawthorne, Citation2008). Gut-brain hormones are categorized into two groups: orexigenic hormones such as neuropeptide Y (NPY) and anorexigenic hormones such as peptide YY (PYY), cholecystokinin (CCK), glucagon-like peptide 1 (GLP-1), oxyntomodulin (OXM), and pancreatic polypeptide (PP) (Morton et al., Citation2006; Perry & Wang, Citation2012). NPY is the most potent orexigenic peptide produced and secreted by the brain, especially in the cortex, hippocampus, hindbrain, and hypothalamus. It is primarily synthesized in the arcuate nucleus (ARC) (Morton et al., Citation2006). It is also synthesized and distributed in peripheral organs, including adipose tissues (Sitticharoon et al., Citation2013), and peripheral noradrenergic neurons (Tan et al., Citation2018). In contrast, PYY is an anorexigenic hormone released by the L cells in the small intestine (Kirchner et al., Citation2010) in response to food intake. PYY(1–36) is secreted into the bloodstream and degraded by dipeptidyl peptidase 4 (DPP-4) to form PYY(3–36) (Sanger & Lee, Citation2008). PYY shares structural similarities with NPY and operates through Y receptors. PYY (3–36) has a strong affinity for the Y2 receptor on the NPY/AgRP neurons in the hypothalamus, inhibiting NPY/AgRP neurons and decreasing appetite (Murphy & Bloom, Citation2006). Therefore, the relationship between NPY and PYY suggests that both play a key role in appetite regulation and food intake, but they perform opposite functions (Holzer et al., Citation2012). NPY increase appetite, resulting in increased food intake, while PYY attenuate appetite, resulting in decreased food intake (Holzer et al., Citation2012).
Rice is a staple food in Asian countries. Among the variety of rice types, white rice (WR) is predominantly consumed worldwide (Fukagawa & Ziska, Citation2019). WR not only provides major calories (Fukagawa & Ziska, Citation2019) but is also a good source of macronutrients and micronutrients, including carbohydrates, proteins, lipids, dietary fibres, vitamins, and minerals (Hashimoto et al., Citation2022). However, a previous study showed that greater consumption of WR was associated with a higher risk of type 2 diabetes (Sun et al., Citation2010), probably because of its high glycemic index (Kunyanee et al., Citation2022). Therefore, other rice varieties that have a more positive effect on health could be an interesting alternative.
Germinated brown rice (GBR), a popular variety, is made by soaking brown rice. Soaking softens the outer bran layer and increases water absorption, making it easy to cook. Furthermore, GBR exhibited high levels of nutrients, such as γ-aminobutyric acid (GABA) (Boonpattararuksa et al., Citation2016; Toyoizumi et al., Citation2021), γ-oryzanol, dietary fiber, phenolics, vitamins, acylated steryl-β-glucoside (Boonpattararuksa et al., Citation2016), and amino acids such as aspartic acid (Asp), glutamic acid (Glu), serine (Ser), asparagine (Asn), glycine (Gly), arginine (Arg), alanine (Ala), proline (Pro), tyrosine (Tyr), valine (Val), and methionine (Met) (Toyoizumi et al., Citation2021). A study in healthy young subjects showed that GBR lowers postprandial blood glucose without increasing insulin levels at 60 minutes and 120 minutes after meals (Ito et al., Citation2005), suggesting its benefit in the prevention of hyperinsulinemia. GBR treatment in high-fat diet-induced obese mice has been shown to decrease body weight gain, triglyceride levels, and total cholesterol levels but not food intake compared to high-fat diet-induced obese control mice (Ho et al., Citation2012). Moreover, GBR reduced blood cholesterol levels in type 2 diabetic rats (Imam et al., Citation2013) and rabbits who were fed a high-cholesterol diet (Mohd Esa et al., Citation2011). Collectively, GBR has been shown to have reductive effects on body weight gain, blood glucose, and lipid levels in both healthy and obese models. However, its impact on hormones changes that regulate appetite and fullness in the acute response of humans is still unknown. Therefore, this study aimed to investigate the acute effect of GBR in two gut-brain hormones, NPY and PYY, which regulate hunger and satiety in healthy participants.
Materials and methods
Subjects
The study protocol was approved by the Ubon Ratchathani University Research Ethics Committee (UBU-REC-125/2563) and registered in the Thai Clinical Trials Registry (registration no. TCTR20220503005) in accordance with the International Helsinki Declaration guidelines. This study was performed at the Faculty of Pharmaceutical Sciences Laboratory, Ubon Ratchathani University, Thailand. The sample size was calculated based on alpha and beta errors as 0.05 and 0.2, respectively. The power calculation was set as 0.8. All participants signed an informed consent form prior to the study. Thai subjects aged 19–50 years were recruited from the Muangsrikai district and invited to visit the Faculty of Pharmaceutical Sciences Laboratory for a screening assessment to ensure that they were healthy, not pregnant, and had no food or rice bioactive substance allergies. The subjects’ anthropometric measurements, including body weight and height, were determined during the screening process. Additionally, their body mass index (BMI) was calculated; subjects who had a BMI between 18.5–22.9 kg/m2 were recruited for our study. A total of 14 people applied for screening, and 10 finalists (8 women and 2 men) were recruited to participate in the study. There were no dropouts or missed appointments. All the participants consume white rice as their staple food. Female participants attended the experiment on days 1–3 of their menstrual cycle to avoid hormonal variations during the phases of the female menstrual cycle, which could be a confounding factor in the study. Subjects with a history of gastrointestinal illnesses, abdominal surgery, diabetes mellitus, dyslipidemia, or endocrine abnormalities were excluded. Before the trial, all subjects were evaluated for complete blood count (CBC), fasting blood glucose, lipid profiles, and kidney profiles to confirm their health.
Study design
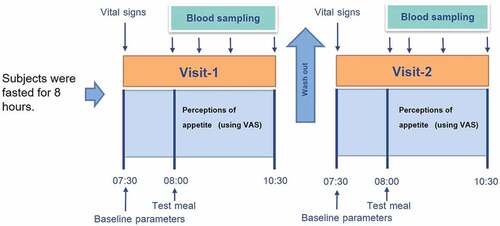
This was a randomized, open-label, within-subject crossover study. The experimental protocol is illustrated in . Subjects attended the experiment on two occasions, one week apart, from 07.00 am − 07.30 am after an 8-h overnight fast. Vital signs were measured after 15 minutes of resting, and blood samples were collected at any time point during the experiment. For the subject allocation, they were required to pick drawing cards (labelled WR and GBR) prepared by the researchers, allowing subjects to receive the test meals in random order.
Figure 1. The experimental protocol.
Test meals
GBR originating from Khao Dawk Mali 105 or fragrant Thai Jasmine rice and WR originating from Thai Jasmine rice were used for test meals. Each rice was purchased from the same manufacturer (DoiKham Co., Ltd. Bangkok, Thailand). Both GBR and WR were prepared by a research assistant. To prepare it, 100 grams of unwashed rice was taken and mixed with water. The water-to-rice ratio was as recommended by the rice cooker’s manufacturer.
The rice was cooked with a rice cooker (Panasonic SR-DF101) for 40 and 50 minutes for WR and GBR, respectively, and with a power of 750 Watts. After the rice was cooked, it was allowed to cool for 5 minutes. Then, both GBR and WR were served as test meals at room temperature. The test meals composed of 100 grams of both GBR (394 kcal of total energy, 6.6 grams of protein, 2.6 grams of fat, 80 g of carbohydrate, and 1.2 grams of dietary fibre) and WR (379 kcal of total energy, 6.9 grams of proteins, 0.4 grams of fat, 83 g of carbohydrate, and 0.4 grams of dietary fibre) served with seasoning sauce and 150 mL water.
Blood collections
All subjects were required to fast for eight hours before the tests. Venous blood samples of the subjects were obtained before the trial (T0), after eight hours of fasting, and 30 minutes (T30), 60 minutes (T60), and 120 minutes (T120) after the test meal consumption. For glucose and insulin analyses, blood samples were collected in sodium fluoride and chilled heparin tubes. For NPY and PYY analyses, blood samples were obtained in uncoagulated tubes. The blood tubes were immediately placed on ice and centrifuged at 3,500 rpm for ten minutes at 4°C to separate the serum. Then, the serum was aliquoted and kept at −70°C until hormonal analysis.
Determination of glucose, insulin, NPY, and PYY levels
Plasma glucose and insulin concentrations were determined by the pathological laboratory (Ubon Central Lab, Ubon Ratchathani) using an enzymatic hexokinase technique and electrochemiluminescence immunoassay (ECLIA), respectively. Serum NPY and PYY levels were measured using commercial enzyme immunoassay (EIA) kits following the manufacturer’s instructions. The detection range was 0–100 ng/mL for both NPY and PYY. The minimum detectable concentration was 0.11–1.39 ng/mL for NPY and 0.10–1.34 ng/mL for PYY. The intra-assay and interassay variations were 9.22% and 9.40%, respectively, for NPY; the intra-assay and interassay variations were 6.17% and 6.25%, respectively, for PYY. Optical density (O.D.) was determined using a PerkinElmer multimode plate reader (PerkinElmer Inc., Waltham, Massachusetts, U.S.A) at 450 nm.
Perceptions of appetite
Appetite and satiety perceptions were assessed before the trial (T0), evaluated at eight hours of fasting, and 30 minutes (T30), 60 minutes (T60), and 120 minutes (T120) after the test meal consumption using a 100 mm visual analogue scale (VAS) (Flint et al., Citation2000). The VAS consists of two questionnaires: one for subjective ratings of hunger (ranging from not hungry at all to the hungriest I have ever been) and another for subjective ratings of fullness (not full at all to very full) (Supplementary material 1). All participants completed their appetite and satiety assessments using the VAS questions.
Statistical analyses
All data are expressed as the mean ± standard error of the mean (SEM) and were analysed using SPSS version 23 software (SPSS Inc., Chicago, Illinois, U.S.A). Plasma glucose and insulin, serum NPY and PYY concentrations, and appetite and satiety VAS were determined at various time periods using a repeated-measures analysis of variance (ANOVA) with Bonferroni correction. The trapezoidal rule was used to determine the cumulative areas under the curve (AUCs) for plasma glucose and insulin, serum NPY and PYY, and appetite and satiety VAS. An independent t-test was used to compare differences in values. p < .05 was considered statistically significant.
Results
Subject characteristics
The baseline characteristics of the subjects are presented in . Ten subjects (two men and eight women), aged 25 ± 2.28 years ranging from 21–44 years with a BMI of 20.2 ± 0.45 kg/m2 ranging from 19–22.5 kg/m2, completed both study visits. The baseline mean systolic blood pressure (SBP) and diastolic blood pressure (DBP) of the subjects were 103.2 ± 2.57 mmHg and 71.7 ± 2.53 mmHg, respectively. Baseline fasting blood levels were 84.4 ± 1.5 mg/dL for glucose, 209.3 ± 12.75 mg/dL for total cholesterol, and 63.6 ± 6.73 mg/dL for triglycerides. The CBC results of red blood cells (RBC), white blood cells (WBC), haemoglobin (Hb), hematocrit (Hct), and platelets were 4.69 ± 0.11 106/μL, 7.1 ± 0.47 103/μL, 13.51 ± 0.47 g/dL, 41 ± 1.27%, and 264.88 ± 21.72 103/μL, respectively. The liver function presented aspartate transaminase (AST), alanine aminotransferase (ALT), and alkaline phosphatase (ALP) levels of 20.13 ± 2.27, 23 ± 6.36, and 57.25 ± 4.57 IU/L, respectively. For renal function, blood urea nitrogen (BUN) was 12.11 ± 1.62 mg/dL, and creatinine (Cr) was 0.76 ± 0.06 mg/dL.
Table 1. The participant characteristics.
Plasma glucose and insulin levels
The results showed that there was no significant effect of treatment or time-on plasma glucose or insulin. There were no differences in plasma glucose and insulin levels between the ingestion of WR and GBR at any time point (, respectively); they significantly increased at T30, T60, and T120 when compared to T0 (p < .05, all). The AUCs of plasma glucose and insulin over time were not different between the WR and GBR (, respectively).
Figure 2. Plasma glucose and insulin after meal ingestion. The plasma glucose (a), the AUC of plasma glucose (b), the plasma insulin (c), and the AUC of plasma insulin (d). Data are expressed as the mean ± SEM. #p < .05 compared to baseline. NS; Not significant difference.
Serum NPY and PYY levels
The results showed a significant effect of treatment and time on serum NPY. Serum NPY levels after GBR ingestion were significantly lower at T120, while those at T30 and T60 did not differ from T0 (). At T60 and T120, the serum NPY levels after GBR ingestion were significantly lower than those after WR ingestion (all p < .05) (). The serum NPY levels after WR ingestion were comparable at various time points (). The AUC over time of serum NPY after GBR ingestion was also significantly lower than that after WR ingestion (p < .05, ). There was no significant treatment or time effect for serum PYY, and there was no difference in the serum PYY levels at various time points between GBR and WR ingestion (). Additionally, the AUC of serum PYY over time was not different between WR and GBR ingestion ().
Figure 3. Serum NPY and PYY after meal ingestion. The serum NPY (a), AUC of serum NPY (b), serum PYY (c), and AUC of serum PYY (d). Data are expressed as the mean ± SEM. *p < .05 compared to WR, #p < .05 compared to baseline. NS; Not significant difference.
Appetite and satiety perceptions by VAS questionnaires
Hunger was significantly decreased at T30, T60, and T120 when compared to T0 in both WR and GBR (p < .05, all) (). In contrast, the perception of fullness was significantly increased at T30, T60, and T120 when compared to T0 in both WR and GBR (p < .05, all) (). The AUCs of hunger and fullness perception were comparable between WR and GBR (, respectively).
Figure 4. The hunger and fullness perception were evaluated by VAS questionnaires. The hunger perception (a), the AUC of hunger perception (b), the fullness perception (c), and the AUC of fullness perception (d). Data are expressed as the mean ± SEM. #p < .05 compared to baseline. NS; Not significant difference.
Discussion
Consumption of GBR is increasing among Thai people (Boonpattararuksa et al., Citation2016). It is softer than brown rice and is nutrient-dense (Toyoizumi et al., Citation2021). This is the first study to investigate the effects of GBR on alterations in hormone levels that regulate appetite, including NPY and PYY, at various time points after ingestion compared to WR in healthy subjects. Moreover, we also examined the changes in blood glucose and insulin levels after ingesting GBR compared to WR, as well as the hunger and satiety after ingestion. We revealed the novel finding that serum NPY levels declined after two hours of GBR ingestion when compared to its levels before ingestion. These results suggest that consumption of GBR may decrease the subjects’ appetites. We also found that the decreased NPY postprandial levels observed after GBR ingestion were consistent with the self-report of subjects, evaluated by VAS questionnaires, reporting decreased hunger and increased fullness after receiving GBR at T30 onwards, suggesting its effect on decreased appetite. The decrease in serum NPY might be due to the high carbohydrate content in the GBR on alterations of the postprandial plasma NPY. A previous study (Sedlackova et al., Citation2012) showed that the consumption of a high-carbohydrate breakfast in the form of a white bread roll (90 g) and strawberry jam (50 g), which is comprises of 81.9 grams of carbohydrates, 8.8 grams of proteins, and 3.4 grams of fats with 383.36 kcal for total energy, decreased postprandial plasma NPY measured at 60, 90, and 150 minutes of the test meal in both healthy controls and bulimia nervosa patients when compared to the fasting levels. The parallel results might be due to the similar components and total energy of the GBR used in this study and the high-carbohydrate breakfast used in the previous study. Notably, only GBR decreased NPY, even though WR also contains high carbohydrate content. We hypothesized that the high content of proteinogenic amino acids, including GABA, present in the GBR (Toyoizumi et al., Citation2021) might have affected the decreased postprandial NPY hormone. However, no studies have reported it yet, hence it requires additional investigation. The serum NPY levels were lower after one hour and two hours of consuming GBR than WR. In addition, the AUC for serum NPY over time was lower after GBR ingestion compared to WR ingestion. These results suggest that the consumption of GBR might decrease NPY levels more effectively than WR. A previous study showed that serum NPY levels were positively correlated with waist circumference and with all parameters of visceral adipocytes, including the area, width, and height of the visceral adipocytes (Chatree et al., Citation2018). Taken together, these data might suggest that lowered serum NPY after GBR ingestion might be involved in lowered visceral fat, indicating that choosing GBR could be useful to promote a healthy living. Hence, healthy adults might benefit from switching WR with GBR as a staple food. However, we found no differences in hunger and fullness perceptions reported by the subjects between GBR and WR ingestion. Hunger and fullness are regulated by various pathways, not only via the NPY effect (Hopkins et al., Citation2000). Even though the serum NPY was significantly lower after GBR ingestion, the hunger and fullness perception of GBR did not show any significant differences when compared with WR. This could be due to role of stomach in the regulation of food intake, which is mediated by gastric motor and sensory functions. Gastric motor function is controlled by an interconnected network of endogenous and exogenous neuroendocrine signals (Cifuentes et al., Citation2021). In healthy men, stomach emptying and accommodation are related to appetite sensations, satiation, and satiety signals. During the filling phase of the stomach, accommodation maintained low intragastric pressure until a critical level of stretch was reached and triggered vagal afferents that activated hypothalamic neurons and induced the feeling of fullness, as well as tonic contractions of the fundus and peristaltic contractions of the remainder of the stomach (Cifuentes et al., Citation2021). A previous study demonstrated that the antral area, stomach emptying, and calorie intake were dependent on the nutrient contents of preload. Fullness was directly associated with the antral area, the suppression of hunger, and energy intake, while hunger was inversely related to those factors (Sturm et al., Citation2004). In our study, we used equivalent amounts of GBR and WR; we hypothesized that they might stretch the antral area of the stomach to the same degree, leading to comparable satiety.
In this study, we evaluated the hunger and fullness of volunteers at different time points by 100-mm VAS. The question at 0 mm was “not hungry at all” or “not full at all”, while at 100 mm, it was “hungriest I have ever been” or “very full”; the questionnaires are provided in the annexe. An advantage of the VAS method is that it is a simple scale that provides an easy way for subjects to rate their answers. On the other hand, interval level measurement could not be done, and the results were subject-reported outcomes. Although VAS has some shortcomings, it is a widely accepted instrument to measure health-specific outcomes (Khadka et al., Citation2022).
Nevertheless, further studies regarding the long-term effects of GBR ingestion, compared to WR ingestion, on NPY levels and hunger perceptions might be required for better understanding.
This is the first study to investigate the effects of GBR on PYY hormone levels. We proved that serum PYY levels had a tendency to increase in the first 30 minutes (mean ± SEM = 670.87 ± 44.37 pg/mL for the T30 time point and 633.08 ± 45.09 for the T0 time point), although there was no statistically significant difference when compared between the time points. Serum PYY levels did not differ among the time points or between GBR and WR ingestion. The AUC of serum PYY over time was comparable between WR and GBR ingestion. These results suggest that GBR and WR may not affect the postprandial PYY levels. Although PYY is known to decrease appetite and increase fullness after meals (Karra et al., Citation2009), in our study, we found that serum PYY levels did not change after the test meals of either GBR or WR. Nutrient composition influences PYY release (De Silva & Bloom, Citation2012). A previous study reported that high-protein intake containing 711.2 kcals or 65.3% protein provided the greatest release of PYY and induced satiety in both normal-weight and obese subjects (Batterham et al., Citation2006). A similar result was found in healthy men in a previous study; it showed that the intraduodenal infusion of three kcal/min lipid- and protein-stimulated PYY release, especially lipids, had a greater effect than protein (Ullrich et al., Citation2015). In our study, the amount of protein and lipid in the test meals were small and lower than those in previous studies, which might have led to no impact on PYY release. Hence, we hypothesized that the decreased hunger and increased fullness of the subjects in this study might be due to the influence of decreased NPY action. NPY, the most potent orexigenic peptide, is synthesized and secreted by various tissues in both central and peripheral organs, including the hypothalamus of the brain (Beck, Citation2006), adipose tissue (Sitticharoon et al., Citation2013), adrenal medulla (Cavadas et al., Citation2002), sympathetic ganglia, and tissues receiving dense sympathetic innervations (Tan et al., Citation2018). Nutrients in the GBR might decrease NPY secretion in many tissues; therefore, they might have significantly decreased serum NPY, leading to the reduced hunger observed in this study rather than the action of PYY.
Further, we found that plasma glucose and insulin levels increased after the ingestion of both GBR and WR for 30 minutes and tended to decrease after ingestion for 60 and 120 minutes. There were no differences in postprandial glucose and insulin levels after the ingestion of GBR and WR at any time points. These results suggest that GBR and WR increased blood glucose and insulin levels similarly. The probabilistic mechanism of comparable postprandial glucose levels after GBR and WR ingestion might be because of their similar ability in stimulating pancreatic β-cells to secrete insulin, as we found similar levels of insulin after ingestion of both GBR and WR. A physiological function of insulin is facilitating glucose uptake into muscle and fat cells via glucose transporter 4 after meals (Kolb et al., Citation2020). These results are similar to those of a previous study, conducted among overweight and obese subjects, which showed that the blood glucose levels did not differ between the group that ingested brown rice and the group that ingested white rice (Kazemzadeh et al., Citation2014). However, our results are different Ito et al. (Citation2005), which revealed that pre-GBR and brown rice had a lowered postprandial blood glucose response after 120 minutes of ingestion when compared to white rice ingestion, suggested by the area under the curve in healthy subjects (Ito et al., Citation2005). The different results might be due to the different subject models and glycemic index of the rice. The decrease in postprandial blood glucose response after receiving pre-GBR of the subjects observed in the previous study (Ito et al., Citation2005) might be because of the lower glycemic index of pre-GBR (54.4 ± 5.1 for GBR vs. 74.6 ± 6.2 for WR). However, this study did not evaluate the glycemic indices of GBR and WR. We reported that the carbohydrate content (in 100 g of rice) of GBR was 80.3 grams and that of WR was 82.95 grams. The similar carbohydrate contents of our GBR and WR might lead to similar glycemic index values, thus resulting in comparable blood glucose levels after rice ingestion. High-fibre diets are known to slow gastric emptying and modify the postprandial glycemic response (Muangchan et al., Citation2021). In addition to dietary fibre, the transportation of food into the small intestine, which is the rate of digestion and absorption, also known as the rate of appearance of exogenous glucose or glucose influx rate from the intestine (RaE), is a determinant of postprandial glycemic response as well (Boers et al., Citation2019). Moreover, the postprandial glycemic response is also dependent on several metabolic processes, including the rate of endogenous glucose production (EGP) and glucose uptake by tissues (Boers et al., Citation2019). Therefore, it could be suggested that the postprandial glycemic response is determined by dietary diet, RaE, EGP, and glucose uptake by tissues (Boers et al., Citation2019; Muangchan et al., Citation2021). A previous study found that a high-fiber wheat food, pasta, slowed the glucose influx rate from the intestine; however, the control diet (low fiber diet) and pasta (high fiber diet) ingestion showed a comparable glycemic response in healthy men (Eelderink et al., Citation2012). These results suggested that diet fiber cannot always predict a slowed glycemic response. Other factors, including RaE, EGP, and glucose uptake by tissues, might influence it (Boers et al., Citation2019; Eelderink et al., Citation2012). Further, we hypothesized that RaE, EGP, and glucose uptake by tissues might be comparable in both GBR (high fibre diet) and WR ingestion. However, further studies regarding these hypotheses are needed.
Our study still has some limitations. First, the test meals were not blinded and because the color of GBR and WR are different, volunteers knew what kind of rice they ate. It was only random for the subjects to consume each type of rice, so this may have affected the subjects’ expectations and resulted biased answering of the VAS questionnaires. Second, we controlled only the amount of rice and not the energy levels of the two types of rice. The total energy levels of the two types of rice were not equal since this study aimed to investigate the effect of rice consumption in daily quantities. Third, there are several orexigenic and anorexigenic hormones controlling appetite that we could not measure because of the limited budget for this experiment. Hence, further studies are required for better understanding of these areas. Finally, the experiment could not be performed in a repeatable fashion since multiple blood collections might be an ethical issue; this might have affected the accuracy and reliability of the results.
In conclusion, we revealed novel evidence that the ingestion of GBR decreased serum NPY levels but had no effect on serum PYY levels. The decrease in hunger and increase in fullness of the participants might be due to the influence of decreased NPY. GBR ingestion did not reduce blood glucose and insulin levels. These results suggest that GBR reduces appetite through NPY action but has no effect on blood glucose levels. A decrease in appetite can lead to reduced eating habits and obesity. To summarise, our findings disclose that GBR might be a better choice over WR in terms of the decreased appetite, which is caused by the NPY effect. Consuming GBR rather than WR might promote a healthy lifestyle in individuals who wish to reduce and/or maintain their body weight. Further studies on the long-term effects of GBR on alterations in serum NPY and PYY levels are needed.
Geolocation information
The experiments in this work were performed at the Division of Biopharmacy, Faculty of Pharmaceutical Sciences, Ubon Ratchathani University, Ubon Ratchathani, Thailand and Princess Srisavangavadhana College of Medicine, Chulabhorn Royal Academy, Bangkok, Thailand.
Acknowledgements
The authors would like to thank Kanteera Muangchoo for providing the equipment for running the EIA experiment.
Disclosure statement
No potential conflict of interest was reported by the author(s).
Data availability statement
The datasets used and/or analysed during the current study are available from the corresponding author upon reasonable request. https://doi.org/10.1080/19476337.2023.2188903.
Additional information
Funding
References
- Afshin, A., Forouzanfar, M. H., Reitsma, M. B., Sur, P., Estep, K., Lee, A., Marczak, L., Mokdad, A. H., Moradi Lakeh, M., Naghavi, M., Salama, J. S., Vos, T., Abate, K. H., Abbafati, C., Ahmed, M. B., Al-Aly, Z., Alkerwi, A., Al-Raddadi, R., Amare, A. T., & Murray, C. J. L. (2017). Health effects of overweight and obesity in 195 countries over 25 years. The New England Journal of Medicine, 377(1), 13–27. https://doi.org/10.1056/NEJMoa1614362
- Batterham, R. L., Heffron, H., Kapoor, S., Chivers, J. E., Chandarana, K., Herzog, H., Le Roux, C. W., Thomas, E. L., Bell, J. D., & Withers, D. J. (2006). Critical role for peptide YY in protein-mediated satiation and body-weight regulation. Cell Metabolism, 4(3), 223–233. https://doi.org/10.1016/j.cmet.2006.08.001
- Beck, B. (2006). Neuropeptide Y in normal eating and in genetic and dietary-induced obesity. Philosophical Transactions of the Royal Society B: Biological Sciences, 361(1471), 1159–1185. https://doi.org/10.1098/rstb.2006.1855
- Boers, H. M., Alssema, M., Mela, D. J., Peters, H. P. F., Vonk, R. J., & Priebe, M. G. (2019). The rate of glucose appearance is related to postprandial glucose and insulin responses in adults: A systematic review and meta-analysis of stable isotope studies. The Journal of Nutrition, 149(11), 1896–1903. https://doi.org/10.1093/jn/nxz150
- Boonpattararuksa, J., Songchitsomboo, S., Akkaravessapong, P., Wongpiyachon, S., Wasusun, A., & Komindr, S. (2016). Effects of two pre-germinated brown rice of Thailand on postprandial blood glucose and insulin responses in type 2 diabete. Food and Applied Bioscience Journal, 4(3), 138–150.
- Cavadas, C., Ribeiro, C. A., Cotrim, M., Mosimann, F., Brunner, H. R., & Grouzmann, E. (2002). Catecholamine and neuropeptide Y secretion from human adrenal chromaffin cells: Effect of nicotine and KCl. Annals of the New York Academy of Sciences, 971(1), 332–334. https://doi.org/10.1111/j.1749-6632.2002.tb04488.x
- Chatree, S., Sitticharoon, C., Maikaew, P., Uawithya, P., & Chearskul, S. (2018). Adipose Y5R mRNA is higher in obese than non-obese humans and is correlated with obesity parameters. Experimental Biology and Medicine, 243(9), 786–795. https://doi.org/10.1177/1535370218774889
- Cifuentes, L., Camilleri, M., & Acosta, A. (2021). Gastric sensory and motor functions and energy intake in health and obesity—Therapeutic implications. Nutrients, 13(4), 1158. https://doi.org/10.3390/nu13041158
- Dallman, M. F. (2010). Stress-induced obesity and the emotional nervous system. Trends in Endocrinology & Metabolism, 21(3), 159–165. https://doi.org/10.1016/j.tem.2009.10.004
- De Silva, A., & Bloom, S. R. (2012). Gut hormones and appetite control: A focus on PYY and GLP-1 as therapeutic targets in obesity. Gut and Liver, 6(1), 10–20. https://doi.org/10.5009/gnl.2012.6.1.10
- Eelderink, C., Moerdijk-Poortvliet, T. C., Wang, H., Schepers, M., Preston, T., Boer, T., Vonk, R. J., Schierbeek, H., & Priebe, M. G. (2012). The glycemic response does not reflect the in vivo starch digestibility of fiber-rich wheat products in healthy men. The Journal of Nutrition, 142(2), 258–263. https://doi.org/10.3945/jn.111.147884
- Flint, A., Raben, A., Blundell, J. E., & Astrup, A. (2000). Reproducibility, power and validity of visual analogue scales in assessment of appetite sensations in single test meal studies. International Journal of Obesity, 24(1), 38–48. https://doi.org/10.1038/sj.ijo.0801083
- Foster-Schubert, K. E., Overduin, J., OPrudom, C. E., Liu, J., Callahan, H. S., Gaylinn, B. D., Thorner, M. O., & Cummings, D. E. (2008). Acyl and total ghrelin are suppressed strongly by ingested proteins, weakly by lipids, and biphasically by carbohydrates. The Journal of Clinical Endocrinology & Metabolism, 93(5), 1971–1979. https://doi.org/10.1210/jc.2007-2289
- Fukagawa, N. K., & Ziska, L. H. (2019). Rice: Importance for global nutrition. Journal of Nutritional Science and Vitaminology, 65(Supplement), S2–3. https://doi.org/10.3177/jnsv.65.S2
- Hashimoto, M., Hossain, S., Matsuzaki, K., Shido, O., & Yoshino, K. (2022). The journey from white rice to ultra-high hydrostatic pressurized brown rice: An excellent endeavor for ideal nutrition from staple food. Critical Reviews in Food Science and Nutrition, 62(6), 1502–1520. https://doi.org/10.1080/10408398.2020.1844138
- Holzer, P., Reichmann, F., & Farzi, A. (2012). Neuropeptide Y, peptide YY and pancreatic polypeptide in the gut-brain axis. Neuropeptides, 46(6), 261–274. https://doi.org/10.1016/j.npep.2012.08.005
- Hopkins, M., Blundell, J., Halford, J., King, N., & Finlayson, G. (2000). The regulation of food intake in humans. In K. R. Feingold, B. Anawalt, A. Boyce, G. Chrousos, W. W. de Herder, K. Dhatariya, K. Dungan, J. M. Hershman, J. Hofland, S. Kalra, G. Kaltsas, C. Koch, P. Kopp, M. Korbonits, C. S. Kovacs, W. Kuohung, B. Laferrère, M. Levy, E. A. McGee, R. McLachlan, J. E. Morley, M. New, J. Purnell, R. Sahay, F. Singer, M. A. Sperling, C. A. Stratakis, D. L. Trence, & D. P. Wilson (Eds.), Endotext (pp. 1–46). MDText.com, Inc.
- Ho, J. N., Son, M. E., Lim, W. C., Lim, S. T., & Cho, H. Y. (2012). Anti-obesity effects of germinated brown rice extract through down-regulation of lipogenic genes in high fat diet-induced obese mice. Bioscience, Biotechnology, and Biochemistry, 76(6), 1068–1074. https://doi.org/10.1271/bbb.110666
- Imam, M. U., Ismail, M., Omar, A. R., & Ithnin, H. (2013). The hypocholesterolemic effect of germinated brown rice involves the upregulation of the apolipoprotein A1 and low-density lipoprotein receptor genes. Journal of Diabetes Research, 2013, 134694. https://doi.org/10.1155/2013/134694
- Ito, Y., Mizukuchi, A., Kise, M., Aoto, H., Yamamoto, S., Yoshihara, R., & Yokoyama, J. (2005). Postprandial blood glucose and insulin responses to pre-germinated brown rice in healthy subjects. The Journal of Medical Investigation, 52(3–4), 159–164. https://doi.org/10.2152/jmi.52.159
- Karra, E., Chandarana, K., & Batterham, R. L. (2009). The role of peptide YY in appetite regulation and obesity. The Journal of Physiology, 587(1), 19–25. https://doi.org/10.1113/jphysiol.2008.164269
- Kazemzadeh, M., Safavi, S. M., Nematollahi, S., & Nourieh, Z. (2014). Effect of brown rice consumption on inflammatory marker and cardiovascular risk factors among overweight and obese non-menopausal female adults. International Journal of Preventive Medicine, 5(4), 478–488.
- Khadka, J., Schoneveld, P. G., & Pesudovs, K. (2022). Comparing the measurement properties of visual analogue and verbal rating scales. Ophthalmic and Physiological Optics, 42(1), 205–217. https://doi.org/10.1111/opo.12917
- Kirchner, H., Tong, J., Tschöp, M. H., & Pfluger, P. T. (2010). Ghrelin and PYY in the regulation of energy balance and metabolism: Lessons from mouse mutants. American Journal of Physiology-Endocrinology and Metabolism, 298(5), E909–919. https://doi.org/10.1152/ajpendo.00191.2009
- Kolb, H., Kempf, K., Röhling, M., & Martin, S. (2020). Insulin: Too much of a good thing is bad. BMC Medicine, 18(1), 224. https://doi.org/10.1186/s12916-020-01688-6
- Kunyanee, K., Van Ngo, T., Kusumawardani, S., & Lungsakul, N. (2022). Ultrasound-chilling assisted annealing treatment to produce a lower glycemic index of white rice grains with different amylose content. Ultrasonics Sonochemistry, 87, 106055. https://doi.org/10.1016/j.ultsonch.2022.106055
- Mohd Esa, N., Abdul Kadir, K. K., Amom, Z., & Azlan, A. (2011). Improving the lipid profile in hypercholesterolemia-induced rabbit by supplementation of germinated brown rice. Journal of Agricultural and Food Chemistry, 59(14), 7985–7991. https://doi.org/10.1021/jf201323x
- Morton, G. J., Cummings, D. E., Baskin, D. G., Barsh, G. S., & Schwartz, M. W. (2006). Central nervous system control of food intake and body weight. Nature, 443(7109), 289–295. https://doi.org/10.1038/nature05026
- Muangchan, N., Khiewvan, B., Chatree, S., Pongwattanapakin, K., Kunlaket, N., Dokmai, T., & Chaikomin, R. (2021). Riceberry rice (Oryza sativa L.) slows gastric emptying and improves the postprandial glycaemic response. The British Journal of Nutrition, 128(3), 1–9. https://doi.org/10.1017/s0007114521003494
- Murphy, K. G., & Bloom, S. R. (2006). Gut hormones and the regulation of energy homeostasis. Nature, 444(7121), 854–859. https://doi.org/10.1038/nature05484
- Perry, B., & Wang, Y. (2012). Appetite regulation and weight control: The role of gut hormones. Nutrition & Diabetes, 2(1), e26. https://doi.org/10.1038/nutd.2011.1021
- Piché, M. E., Tchernof, A., & Després, J. P. (2020). Obesity phenotypes, diabetes, and cardiovascular diseases. Circulation Research, 126(11), 1477–1500. https://doi.org/10.1161/circresaha.120.316101
- Sanger, G. J., & Lee, K. (2008). Hormones of the gut–brain axis as targets for the treatment of upper gastrointestinal disorders. Nature Reviews, Drug Discovery, 7(3), 241–254. https://doi.org/10.1038/nrd2444
- Sedlackova, D., Kopeckova, J., Papezova, H., Hainer, V., Kvasnickova, H., Hill, M., & Nedvidkova, J. (2012). Comparison of a high-carbohydrate and high-protein breakfast effect on plasma ghrelin, obestatin, NPY and PYY levels in women with anorexia and bulimia nervosa. Nutrition & Metabolism, 9(1), 52. https://doi.org/10.1186/1743-7075-9-52
- Sitticharoon, C., Chatree, S., & Churintaraphan, M. (2013). Expressions of neuropeptide Y and Y1 receptor in subcutaneous and visceral fat tissues in normal weight and obese humans and their correlations with clinical parameters and peripheral metabolic factors. Regulatory Peptides, 185, 65–72. https://doi.org/10.1016/j.regpep.2013.06.015
- Stocker, C. J., & Cawthorne, M. A. (2008). The influence of leptin on early life programming of obesity. Trends in Biotechnology, 26(10), 545–551. https://doi.org/10.1016/j.tibtech.2008.06.004
- Sturm, K., Parker, B., Wishart, J., Feinle-Bisset, C., Jones, K. L., Chapman, I., & Horowitz, M. (2004). Energy intake and appetite are related to antral area in healthy young and older subjects. The American Journal of Clinical Nutrition, 80(3), 656–667. https://doi.org/10.1093/ajcn/80.3.656
- Sun, Q., Spiegelman, D., van Dam, R. M., Holmes, M. D., Malik, V. S., Willett, W. C., & Hu, F. B. (2010). White rice, brown rice, and risk of type 2 diabetes in US men and women. Archives of Internal Medicine, 170(11), 961–969. https://doi.org/10.1001/archinternmed.2010.109
- Tan, C. M. J., Green, P., Tapoulal, N., Lewandowski, A. J., Leeson, P., & Herring, N. (2018). The role of neuropeptide Y in cardiovascular health and disease. Frontiers in Physiology, 9, 1281. https://doi.org/10.3389/fphys.2018.01281
- Toyoizumi, T., Kosugi, T., Toyama, Y., & Nakajima, T. (2021). Effects of high-temperature cooking on the gamma-aminobutyric acid content and antioxidant capacity of germinated brown rice (Oryza sativa L.). CyTA - Journal of Food, 19(1), 360–369. https://doi.org/10.1080/19476337.2021.1905721
- Ullrich, S. S., Otto, B., Hutchison, A. T., Luscombe-Marsh, N. D., Horowitz, M., & Feinle-Bisset, C. (2015). Comparative effects of intraduodenal protein and lipid on ghrelin, peptide YY, and leptin release in healthy men. American Journal of Physiology-Regulatory, Integrative and Comparative Physiology, 308(4), R300–304. https://doi.org/10.1152/ajpregu.00504.2014
- Weight Loss Agents. (2012). Livertox: Clinical and research information on drug-induced liver injury. National Institute of Diabetes and Digestive and Kidney Diseases.