
 ?Mathematical formulae have been encoded as MathML and are displayed in this HTML version using MathJax in order to improve their display. Uncheck the box to turn MathJax off. This feature requires Javascript. Click on a formula to zoom.
ABSTRACT
Whey is a source of protein of high nutritional value. In this work, the effects of block cryoconcentration assisted by centrifugation and vacuum evaporation on the physicochemical properties and in vitro digestibility of whey were determined. In vitro digestibility analysis was performed by evaluating the degrees of protein hydrolysis of the fresh, evaporated and cryoconcentrated whey protein samples from the third cycle. The results showed that the samples after the second and third cryoconcentration cycles had no significant differences in protein or lactose content. The in vitro digestibility analysis indicated that the protein obtained by cryoconcentration showed better gastrointestinal digestibility than that obtained by evaporation, with values of 68.2% and 55.4%, respectively. This study demonstrates that block cryoconcentration assisted by centrifugation is an efficient and novel technique that enables the preparation of concentrated protein solutions of high nutritional and biological value.
1. Introduction
The dairy industry is one of the most important sectors of the economy in industrialized and developing countries. Approximately 90% of all milk used in the cheese industry is disposed of as whey, which retains approximately 55% of the total milk ingredients, such as lactose (4.5–5%), soluble proteins (0.6–0.8%), lipids (0.4–0.5%) and mineral salts (8–10% dry matter) (Sánchez et al., Citation2011). Whey proteins are not the most abundant fraction, but they are the most interesting in economic and nutritional terms. Specifically, they account for approximately 20% of milk proteins, and their main components are β-lactoglobulin (β-LG) and α-lactoalbumin, which constitute 10% and 4%, respectively, of all milk proteins. They also contain other proteins, such as lactoferrin, lactoperoxidase, immunoglobulins, and glycomacropeptides (Panesar & Kennedy, Citation2012). In addition, whey protein has a high degree of digestibility and, therefore, a high biological value due to the presence of amino acids such as leucine, tryptophan, lysine and sulfur (Kaur et al., Citation2020; Panesar & Kennedy, Citation2012).
Whey is defined as “the liquid substance obtained by separation of milk clot in cheese making” and is a green translucent liquid obtained from milk after the precipitation of casein. There are several types of whey, depending mainly on the elimination of casein. The first, called sweet, is based on coagulation by rennin at pH 6.5. The second, called acidic, results from the fermentation process or the addition of organic acids or mineral acids to coagulate casein, as in the production of fresh cheeses (Korotkiy et al., Citation2021; Parra Huertas, Citation2009). Due to its high-water content, whey is usually concentrated for subsequent use in the food industry. This is usually done by evaporation techniques that concentrate 50 to 60% of the total whey solids. However, during evaporation, the whey is subjected to temperatures of 70–75°C for more than two hours, resulting in complete denaturation of the whey proteins. Moreover, this behavior is due to the fact that whey proteins are thermolabile due to their low phosphorus and proline content and high content of sulfur amino acids, which causes destabilization and activation of sulfhydryl (−SH) groups. In addition, β-lactoglobulin undergoes several conformational modifications, which greatly affect the degree of protein digestibility (Balde & Aider, Citation2019). Membrane filtration processes can be used at temperatures below 70°C to economically concentrate serums to concentrations of 20–25% total solids. Higher concentrations are difficult to achieve due to membrane fouling (Belén et al., Citation2015).
An alternative technology for the concentration of this byproduct is the freeze concentration process. Freeze concentration is based on partial or total freezing of the liquid feed followed by separation by gravity thawing or other techniques, resulting in an ice fraction and a concentrated thawed residual solution. Due to the use of this method in the food industry, it is possible to concentrate high-quality liquids, as well as to revalue nutrients and components of high biological value, such as proteins and lactose, from byproducts that are considered waste for use in various sectors of the food industry (Yañez-Ñeco et al., Citation2021). The simplest technique for whey concentration by freezing is block cryoconcentration, which is based on two steps: controlled freezing followed by passive or controlled assisted thawing. To preserve quality, several studies on different fruit juices, vegetables, tea and coffee extracts have highlighted concentration by block freezing (cryoconcentration) as the most efficient method. In the case of the above studies, the aromatic profile, color and nutritional value were well preserved by this concentration technique compared to other techniques. For milk and its derivatives, cryoconcentration was used to remove part of the water, and a macroscopic evaluation of the final product indicated, in general, good preservation of the product quality (Balde & Aider, Citation2019).
Several studies have been conducted on cryoconcentration of dairy products, for example Balde and Aïder (Citation2017), showed that cryoconcentration of milk by gravitational thawing produced a highly soluble skim milk powder with high whiteness. On the other hand, Aider et al. (Citation2008) studied gravitational and microwave-assisted thawing during cryoconcentration of whey where they showed that microwave-assisted thawing was the more efficient and faster procedure; meanwhile Quinteros (Citation2020) showed that agitated progressive cryoconcentration of whey was efficient to obtain a high-quality whey concentrate. However, the studies reported above examine the impacts on the processing conditions and their physical characterization of the product obtained, but do not focus on showing the physicochemical properties and nutritional quality of the whey cryoconcentrate. Considering the above information, this work aimed to determine the effects of block cryoconcentration assisted by centrifugation and vacuum evaporation on the physicochemical properties and in vitro digestibility of whey.
2. Materials and methods
2.1 Materials
The whey used in this research work was provided by a dairy company in the city of Chillán, Ñuble Region, Chile, which originated from the manufacture of fresh cheese by enzymatic coagulation (sweet whey, pH 6.5, initial soluble solids concentration of 7.7 °Brix) and was collected in food-grade plastic containers and stored at −4°C prior to pretreatment. The whey was pretreated to remove possible traces of coagulated casein (cheese) and fat from cheese production and to obtain higher protein and lactose yields in the concentration process. The procedure described by Souza et al. (Citation2008) was followed with slight modifications. Forty-five milliliters of whole whey were placed in 50 ml plastic centrifuge tubes, and the whey was centrifuged in a centrifuge (Centurion Scientific) operated at 20°C for 20 min at 1700 rpm using a filter (0.8 mm mesh). The traces of fat and casein were separated from the whey (cheese), and a clean whey of greenish transparent color that was ready for concentration was obtained. The filtered whey was stored in food-grade plastic containers at a temperature of −4°C until processing.
2.2 Concentration procedures
2.2.1 Concentration by centrifugal block freezing
Cryoconcentration of whey was performed according to the methodology of Casas-Forero et al. (Citation2020) with various modifications. Serum (45 ml) was added to 50 ml centrifuge tubes and frozen at −20°C for 12 h. The frozen samples were centrifuged (Hettich D-7853, Tuttlingen, Germany) at 20°C for 30 min at 6000 rpm, which forced the separation of the concentrated fraction and the ice fraction. The cryoconcentrate from the first cycle was reserved and used for the second cycle, and subsequently, that from the second cycle was used for the third cycle. The process was performed in triplicate, and the mean values of each of its properties were reported.
2.2.2 Vacuum evaporation procedure
The whey sample was concentrated with a rotary evaporator (Rotavapor R-100, Büchi Labortechnik AG, Flawil, Switzerland) according to the parameters used in the industry (70°C for 2 h). Three replicates of concentration by evaporation were carried out, and the mean values of the properties were reported.
2.3 Physicochemical properties
Total soluble solids (TSSs) were analyzed using a PAL-1 digital refractometer (Atago Inc., Tokyo, Japan) and expressed in units of °Brix. Titratable acidity was measured by titration with NaOH (0.1 N). Samples were diluted in distilled water and titrated with phenolphthalein (pH = 8.1 ± 0.1). The titratable acidity was expressed as g lactic acid/l of the sample. The density of each sample was measured by the flotation method according to Zúñiga and Aguilera (Citation2009) and the results were expressed in kg/m3. The lactose content was determined by high-performance liquid chromatography (HPLC) using an LDC Analytical Constant Metric 3200 solvent delivery system (Manchester, Pennsylvania, U.S.A) with a RI MERCK RI-71 refractive index detector, Waters TM 717 plus autosampler, and Waters TM temperature control Module II column oven.
2.4 Proximal composition
The proximate compositions of the samples, such as the protein, fat, carbohydrate, moisture and ash contents, were analyzed according to the methods established by the Association of Official Analytical Chemists (AOAC, Citation2012). The protein content was determined by the Kjeldahl method; for the calculation of total nitrogen, a conversion factor of 6.38 was used (De Vries et al., Citation2017). The fat content was determined using the Soxhlet method.
Carbohydrate content was determined by sugar profiling using the AOAC 984.22:1995 technique with high performance liquid chromatography (HPLC) modifications. For this purpose, an analytical Constant Metric® 3200 solvent delivery system LDC (Manchester, Pennsylvania, U.S.A) high performance chromatograph with a MERCK RI-71 RI refractive index detector, a Waters TM 717 plus autosampler and a Waters TM Module II column oven with temperature control was used. The column used for the process was a Merck Purospher STAR-NH 2 250 × 4.6 mm (5 μm) cartridge Merck Purospher STAR-NH 2 250 × 4.6 mm (5 μm) with precolumn. The integration of the chromatographic peaks was performed using Clarity® integrator software.
The total ash was measured after ash was placed in a muffle furnace at 550°C for 20 h, and the moisture content was determined by oven drying at 105°C to a constant weight. The sample analysis was performed in triplicate.
2.5 Amino acid content
The amino acid composition of each sample was determined by high-performance liquid chromatography (HPLC) using an LDC Analytical Constant Metric 3200 solvent delivery system (Manchester, Pennsylvania, U.S.A) with prior hydrolysis of the sample and derivatization of the amino acids.
2.6 Attenuated total reflectance Fourier transform infrared spectroscopy (FTIR-ATR)
FTIR spectra of the samples were obtained using an IR Prestige-21 spectrometer (Shimadzu 21 Corporation Pte. Ltd., Kyoto, Japan). Fifty microliters of each sample was placed on ATR glass. Sixty-four scans were performed in the absorption mode with a resolution of 4.0 cm−1 at wavelengths between 4000–400 cm−1. The amide I region was analyzed to remove noise, and the resulting spectra were smoothed with the Savitsky-Golay function at 9 points. The normalized second-derivative spectra were obtained with IR Solution software version 1.10 (Creon Lab Control AG, Shimadzu Corporation Pte. Ltd., Kyoto, Japan). Then, Origin version 9.0 PRO software (Origin Lab Corporation, Northampton, U.S.A) fits were made to the Gaussian curves in the second-derivative IR spectra. The contribution of each of the secondary structures present in the samples was calculated from the area under the relative peaks of the assigned bands within the spectra.
2.7 In vitro dynamic simulation of human gastroduodenal digestion
The determination of sample digestion was performed using the methodology proposed by Levi and Lesmes (Citation2014). First, 60 ml of pepsin simulated gastric fluid at a ratio of 1000 U/ml was added to a gastric bioreactor along with 40 ml of the sample, the pH was adjusted to 4.5 and the temperature to 37°C, and then the process was started using control software. The software was programmed to obtain a gastric pH gradient from 4.5 to 1.2 with intermittent agitation at 200 rpm. In addition, the software controlled the passage of the digesta from the gastric bioreactor to the duodenum 10 min after the start of the digestive process. The duodenal bioreactor was prefilled with 10 ml of simulated duodenal fluid and maintained at a temperature of 37°C and a pH of 6.1, while bile secretion was controlled by the software. Pancreatic enzymes (trypsin and α-chymotrypsin) were added at two time points, the first at 10 min and the second at 50 min after the start of the duodenal process. The total duration of the digestion process was set to 2 h, and samples were collected every 30 min from both bioreactors. The samples were stored at −20°C until further use.
2.8 Determination of the degree of hydrolysis (DH)
The degree of hydrolysis was determined according to the methodology proposed by Nielsen et al. (Citation2001) with the OPA method. The L-serine calibration curve was prepared in a concentration range of 50–200 mg/ml (Nielsen et al., Citation2001). The analysis was performed by mixing 200 µl of the sample with 1.5 ml of the OPA reagent and then allowing the mixture to react for 3 min, and the absorbance of the samples was measured at 340 nm. The free amino groups in the samples were calculated by the following equation and expressed as serine amino equivalents (serine NH2).
where the values of the constants were α equal to 1 and β equal to 0.4 (Nielsen et al., Citation2001). The htot was determined using the concentration of each amino acid present in the sample.
2.9 Statistical analysis
The obtained results were analyzed using Statgraphics Centurion XVI statistical software (Statistical Graphics Corp., Herdon, VA, U.S.A). Each experiment was performed in triplicate. Fisher’s LSD test was used to minimize significant differences with a 95% confidence interval.
3. Results and discussion
3.1 Concentration by centrifugal block freezing of whey
shows the linear increase in the solid concentration (°Brix) in the concentrated (thawed) and ice fractions of the cryoconcentration process. The whey was concentrated from 7.7 °Brix (initial whey) to 30.0 °Brix in three cryoconcentration cycles, and the retention of solutes in the ice fraction in the third cycle reached 12.06 °Brix. A linear regression equation was obtained (R2 = 0.99). Similar behavior was observed in other studies using other forms of whey cryoconcentration. Quinteros (Citation2020) reported whey solid concentrations from 7.4 to 29.1 °Brix by agitated progressive cryoconcentration. Sánchez et al. (Citation2011) reported whey solids concentrations from 9.1 to 21.8 °Brix by falling film cryoconcentration, showing a steady increase in soluble solids over time. Aider et al. (Citation2007) reported whey solids concentrations from 6.93 to 35% by block cryoconcentration in four cycles, showing that no significant differences were observed between the third and fourth concentration cycle. The same solids concentration behavior has also been observed in previous studies with sugar solutions (glucose, fructose and sucrose) (Raventós et al., Citation2007) and must (Hernández et al., Citation2010) using different cryoconcentration techniques.
Figure 1. Evolution of the solids content (°brix) in the concentrate and of the ice fraction as a function of the cryoconcentration cycles.
The efficiency of the cryoconcentration process (n) is directly related to the concentration of solids in the ice fraction: the lower the concentration of solids in the ice fraction is, the higher the efficiency of the process. The highest process efficiency was recorded in the first cryoconcentration cycle (80.94%); in the third cryoconcentration cycle, the process efficiency decreased significantly, reaching a value of 60.68%. This was because increasing the solid content in the solution increased the viscosity, reducing the efficiency of the process and increasing the amount of solids retained in the ice fraction (Aider et al., Citation2008). Under these conditions, the solutes accumulated at the ice-liquid interface, due to concentration polarization, moved by diffusion toward the concentrated phase; therefore, these solutes were more easily retained in the formed ice (Belén et al., Citation2015). In addition, the increase in viscosity influenced the crystallization phenomenon, as ice crystal growth rates are affected by the presence of compounds such as lactose, which is a cryoprotective substance used to protect biological tissues, aqueous solutions and proteins from freezing (Blanquet et al., Citation2005). These results show how the whey cryoconcentration process is a suitable technique to concentrate the soluble solids present in milk, encompassing the presence of proteins, carbohydrates and other compounds of interest that could be retained in the concentrated fraction.
3.2 Physicochemical properties
shows the physicochemical parameters of the fresh whey, evaporated concentrate and cryoconcentrated and ice fractions from the three cryoconcentration cycles. The density of the solution significantly influenced the efficiency of the serum concentration process. Notably, the higher the density of the solution was, the more difficult it was to carry out the freezing process. According to the results, when moving from one concentration cycle to the next, the content of total suspended solids increased in both the concentrated solutions and ice fractions, contributing to significant increases in the densities of the solutions. Similar results were reported by Aider et al. (Citation2007) for whey concentration using gravity-assisted cryoconcentration.
Table 1. Physicochemical parameters of fresh, evaporated, concentrated and their ice fractions whey.
shows the total protein contents of the fresh whey, evaporated concentrate and cryoconcentrate of both fractions (concentrate and ice). An analysis of the obtained results showed that increasing the number of cryoconcentration cycles had significant effects on the protein contents of the concentrated fractions. The initial protein content in the serum was 0.89 ± 0.02 g/100 g of sample. By the centrifugation-assisted block cryoconcentration process, the protein was concentrated by up to 3.7 times, reaching a value of 3.22 ± 0.23 g/100 of sample in the third cryoconcentration cycle and showing no significant differences in protein content in the second and third cycles. The above results are since whey proteins have the capacity to bind a large number of water molecules due to the presence of hydrogen bonds. Therefore, increasing the cryoconcentration cycles increases the protein content in the concentrated solution, decreasing the interstitial water available for freezing (Aider et al., Citation2007).
In the ice fraction, the protein content varied between 0.36 ± 0.004 g/100 g of sample and 0.91 ± 0.06 g/100 g of sample between the first and third cycles. Similar results were reported by Belén et al. (Citation2018) on the concentration of sweet whey, with 0.94 g/100 g of protein in the initial sample, using three-phase layer cryoconcentration. A protein concentration of 3.82 g/100 g of sample was reached in the third stage, and in the ice fraction, the protein concentration varied from 0.59 to 0.79 g/100 g of sample between the first and third stages.
The lactose concentrations in the fresh serum, evaporated concentrate and cryoconcentrated of the concentrated and ice fractions are shown in . The initial lactose content in the serum was 3.78 ± 0.02 g/100 g of sample; because of cryoconcentration and evaporation, contents of 6.18 ± 0.09 g/100 g of sample and 7.22 ± 0.69 g/100 g of sample, respectively, were obtained in the first cycle. After the first cryoconcentration cycle, the lactose content in the concentrated solution increased significantly compared to that of the fresh serum, reaching 8.19 ± 0.46 g/100 g of sample in the second cycle, while the ice retained a minimal amount of lactose (1.17 ± 0.05 g/100 g of sample). In the third cryoconcentration cycle, the lactose content decreased significantly in the concentrate (1.17 ± 0.05 g of sample), and in the ice fraction, the lactose retention increased (3.96 ± 0.37 g of sample). Similar behaviors have been reported (Aider et al., Citation2007; Belén et al., Citation2018; Quinteros, Citation2020; Sánchez et al., Citation2011) with different whey cryoconcentration techniques.
3.3 Proximal composition
lists the proximate compositions of the fresh whey samples and the evaporated concentrated and concentrated fractions from the third cycle; the moisture contents of the samples were 92.64, 69.92 and 77.32 g/100 g of sample, respectively. The fat content of the whey increased significantly in the evaporated concentrated whey, while it showed no change in the cryoconcentrated whey fraction. These results show that during the evaporative concentration process, as the water was removed, the fat became more concentrated in the concentrated solution, whereas in the cryoconcentration process, fat was retained in the ice fraction and not in the concentrated solutions.
Table 2. Proximal composition of fresh, evaporated and cryoconcentrated cycle 3 whey.
The ash content increased significantly in both the evaporation concentrated and cryoconcentrated solutions. Related results were reported by Balde and Aïder (Citation2017), who observed no significant differences in ash content when using any of the concentration techniques under study. In addition, the carbohydrate content of the fresh whey was 4.70 g/100 g of sample, and high contents of this component were present in both the whey concentrated by evaporation and the cryoconcentrated whey. Notably, the whey concentrated by evaporation showed the highest carbohydrate content, at 21.32 g/100 g of sample.
3.4 Amino acid content
The amino acid compositions of proteins from both the fresh whey and whey concentrated by evaporation and cryoconcentration are shown in . Whey proteins contain both essential and nonessential amino acids in high concentrations compared to vegetable proteins (Yasmin et al., Citation2013). In all cases, the content of each amino acid was higher in the cryoconcentrated solution, highlighting that although the evaporation concentration method managed to concentrate the protein, much of the nutritional value of the protein was lost. The content of essential amino acids in the cryoconcentrated solution was triple that of the fresh whey, demonstrating the potential of the cryoconcentration process to obtain concentrated protein solutions of high nutritional and biological quality. Branched-chain amino acids such as isoleucine stand out from a nutritional point of view, as they participate in protein synthesis and metabolic homeostasis, stimulate insulin release, and are used as biomarkers for diseases such as diabetes (Rohini et al., Citation2018). Leucine has been identified as an amino acid of particular interest, as it is involved in translation initiation in muscle protein synthesis, so it has been speculated that the anabolic efficiency of a protein is related to its leucine content (Ha & Zemel, Citation2003). In addition, it has been suggested that branched-chain amino acids decrease tryptophan absorption in the central nervous system, reducing protein synthesis and delaying fatigue. Sulfur amino acids such as methionine also contribute to tissues in the synthesis of peptides and proteins, helping with the functioning of the immune system (Ayunta et al., Citation2019). The cryoconcentrated solution samples presented a high glutamine content (0.22 g/100 g of sample), which is of vital importance because it provides the energy necessary for cell division to occur in enterocytes and leukocytes (Master & Macedo, Citation2021).
Table 3. Amino acid content of fresh, evaporated and cryoconcentrated cycle 3 whey.
3.5 Attenuated total reflectance Fourier transform infrared spectroscopy (FTIR-ATR)
The secondary structure of the protein was analyzed by FTIR analysis. The amide I band was chosen to be studied since it is the main area of protein absorption, which enabled us to evaluate the effects of the different concentration methodologies on the structural conformation of the protein. shows the changes in the secondary structures of the samples. It was observed that the concentration process of the samples affected the intensities of different bands, showing the changes that occurred in the structures.
Figure 2. FT-IR spectra of protein secondary structure in fresh, evaporated and cryoconcentrated whey.
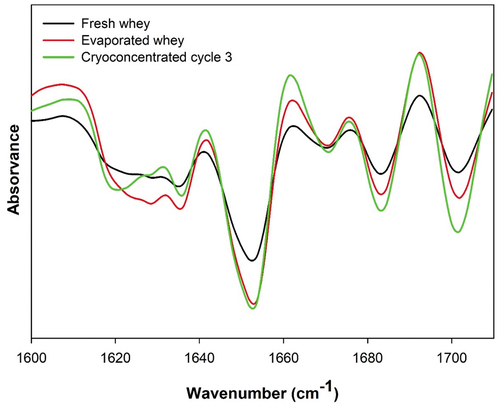
The peaks between 1618–1621 cm−1 were attributed to intermolecular β-sheet structures, and they were of higher intensity for both the fresh and cryoconcentrated serum samples, showing the aggregation of proteins at the intermolecular level. The intramolecular β-sheet structures showed a peak between 1625–1636 cm−1, and a peak shift was observed in the samples concentrated by evaporation. This behavior indicated an intermolecular nonaggregate state, which was closer to the native β-sheet conformation. Notably, an increase in the β-sheet content occurred because as the hydrophilic residues of the α-helix formed hydrogen bonds with water molecules, a helical stretch occurred, which increased the intensity of the twist in β-lactoglobulin. The β-sheet antiparallel intramolecular and β-sheet antiparallel bands were observed at approximately 1683 cm−1 and 1701 cm−1 and resulted from dipolar coupling between the carbonyl oscillators. A peak was also observed at 1669 cm−1, which was attributed to β-turn structures, which were present in a higher proportion in the fresh serum.
The fresh serum was characterized by proteins rich in α-helical structures, which represented 48.39% of the total area of secondary structures (). In contrast, the solutions concentrated by evaporation showed an increase in the presence of intramolecular sheet structures (49.36%), while in the cryoconcentrated solutions, the α-helix was the predominant structure (42.73%). Similar results were reported by Balde and Aider (Citation2019), in a study of the effects of sterilization on the properties of cryoconcentrated skim milk.
Table 4. Percentages of protein secondary structure of fresh, evaporated and cryoconcentrated cycle 3 whey.
3.6 Determination of gastrointestinal digestibility in vitro
Whey protein hydrolysates have an excellent nutritional quality, and whey in its native form is difficult to hydrolyze, so various treatments have been proposed to increase its susceptibility to enzymatic hydrolysis (Almeida et al., Citation2015). shows the effects of various concentration methods on the in vitro gastrointestinal digestibility of whey proteins. The degree of protein hydrolysis in all samples increased steadily with time.
Figure 3. Degree of hydrolysis of fresh, evaporated and cryoconcentrated cycle 3 whey. (a) gastric process; (b) intestinal process.
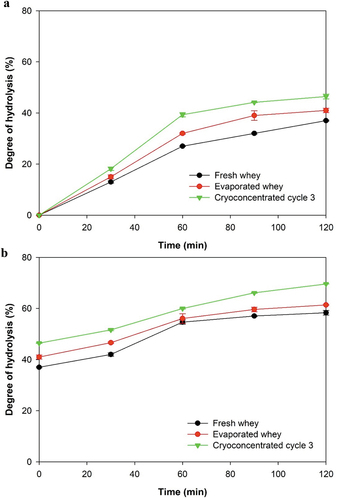
In the gastric phase, the fresh whey sample showed the lowest degree of hydrolysis compared to the concentrated samples. The lowest hydrolysis degree was recorded in the fresh whey samples because a higher proportion of larger particles prevented the diffusion of pepsin into the fresh whey protein molecules (Bhat et al., Citation2021). After 120 min of gastric processing, the sample concentrated by cryoconcentration presented the highest degree of hydrolysis at 43%, while the sample concentrated by evaporation showed a hydrolysis degree of only 38%. These results show that thermal processing negatively affects protein quality and therefore protein digestibility, highlighting that according to Lacroix et al. (Citation2008) the higher the whey processing temperature is, the greater the negative impact on digestibility.
The evaluation of the intestinal phase revealed significant differences between the evaporated and cryoconcentrated samples. The fresh serum presented the lowest degree of hydrolysis. This may have been related to the greater accessibility of the enzyme due to changes in the structure of the proteins such that sites were exposed that enabled a greater action of the enzyme. These results agree with those obtained by Almeida et al. (Citation2015) who highlighted the high biological value of whey proteins. In addition, Tang et al. (Citation2009) highlighted that whey protein ingestion stimulates muscle protein synthesis by increasing the content of branched-chain essential amino acids, which may be related to the speed with which whey proteins are digested.
4. Conclusions
Centrifugation-assisted block cryoconcentration is an efficient and novel technique for concentrating protein solutions. In this study, cryoconcentrated solutions showed high contents of total dissolved solids that increased significantly as the number of concentration cycles increased. The concentrated fraction showed higher amounts of lactose and protein than the ice fraction. In addition, the last cryoconcentration cycle resulted in a high retention rate of essential amino acids, and the bands of the secondary structures of the protein were of higher intensity. Likewise, a digestibility study showed that the proteins obtained by cryoconcentration presented a higher degree of hydrolysis than the proteins from fresh whey and concentrated by evaporation. Therefore, the present study confirms that by using block cryoconcentration as a protein concentration technique, proteins with improved physicochemical properties and high nutritional value can be obtained.
Acknowledgments
Belissa Cochachín-Carrera gratefully acknowledges the financial support provided by the PhD scholarship (2018) and scholarship for participation in national and international events (2022) through the Graduate School of the Universidad del Bío-Bío.
Disclosure statement
No potential conflict of interest was reported by the author(s).
References
- Aider, M., De Halleux, D., & Akbache, A. (2007). Whey cryoconcentration and impact on its composition. Journal of Food Engineering, 82(1), 92–102. https://doi.org/10.1016/j.jfoodeng.2007.01.025
- Aider, M., De Halleux, D., & Melnikova, I. (2008). Gravitational and microwave-assisted thawing during milk whey cryoconcentration. Journal of Food Engineering, 88(3), 373–380. https://doi.org/10.1016/j.jfoodeng.2008.02.024
- Almeida, C. C., Monteiro, M. L. G., da Costa-Lima, B. R. C., Alvares, T. S., & Conte-Junior, C. A. (2015). In vitro digestibility of commercial whey protein supplements. LWT-Food Science and Technology, 61(1), 7–11. https://doi.org/10.1016/j.lwt.2014.11.038
- Association of Official Analytical Chemist. (2012). Association of official analytical chemist AOAC. Official methods of analysis (19th ed.). AOAC International.
- Ayunta, C. A., Quinzio, C. M., Puppo, M. C., & Iturriaga, L. B. (2019). Physicochemical properties of caprine and commercial bovine whey protein concentrate. Journal of Food Measurement and Characterization, 13(4), 2729–2739. https://doi.org/10.1007/s11694-019-00194-5
- Balde, A., & Aïder, M. (2017). Effect of cryoconcentration, reverse osmosis and vacuum evaporation as concentration step of skim milk prior to drying on the powder properties. Powder Technology, 319, 463–471. https://doi.org/10.1016/j.powtec.2017.07.016
- Balde, A., & Aider, M. (2019). Impact of sterilization and storage on the properties of concentrated skim milk by cryoconcentration in comparison with vacuum evaporation and reverse osmosis concentration. Journal of Food Process Engineering, 42(5), e13130. https://doi.org/10.1111/jfpe.13130
- Belén, F., Hernández, E., Auleda, J. M., & Raventós, M. (2015). Una alternativa a la gestión de aguas residuales de queserías: crioconcentracion en capa.
- Belén, F., Hernández Yáñez, E., & Raventós Santamaria, M. (2018). Management of cheese whey by film freeze concentration. Environmental Engineering and Management Journal, 17(6), 1373–1383. https://doi.org/10.30638/eemj.2018.136
- Bhat, Z. F., Morton, J. D., Bekhit, A. E. D. A., Kumar, S., & Bhat, H. F. (2021). Processing technologies for improved digestibility of milk proteins. Trends in Food Science & Technology, 118, 1–16. https://doi.org/10.1016/j.tifs.2021.09.017
- Blanquet, S., Garrait, G., Beyssac, E., Perrier, C., Denis, S., Hébrard, G., & Alric, M. (2005). Effects of cryoprotectants on the viability and activity of freeze-dried recombinant yeasts as novel oral drug delivery systems assessed by an artificial digestive system. European Journal of Pharmaceutics and Biopharmaceutics, 61(1–2), 32–39. https://doi.org/10.1016/j.ejpb.2005.03.009
- Casas-Forero, N., Orellana-Palma, P., & Petzold, G. (2020). Influence of block freeze concentration and evaporation on physicochemical properties, bioactive compounds and antioxidant activity in blueberry juice. Food Science and Technology, 40(suppl 2), 387–394. https://doi.org/10.1590/fst.29819
- de Vries, A., Wesseling, A., van der Linden, E., & Scholten, E. (2017). Protein oleogels from heat-set whey protein aggregates. Journal of Colloid and Interface Science, 486, 75–83. https://doi.org/10.1016/j.jcis.2016.09.043
- Ha, E., & Zemel, M. B. (2003). Functional properties of whey, whey components, and essential amino acids: Mechanisms underlying health benefits for active people. The Journal of Nutritional Biochemistry, 14(5), 251–258. https://doi.org/10.1016/S0955-2863(03)00030-5
- Hernández, E., Raventós, M., Auleda, J. M., & Ibarz, A. (2010). Freeze concentration of must in a pilot plant falling film cryoconcentrator. Innovative Food Science & Emerging Technologies, 11(1), 130–136. https://doi.org/10.1016/j.ifset.2009.08.014
- Kaur, R., Panwar, D., & Y Panesar, P. S. (2020). Enfoque biotecnológico para la valorización del suero de leche para productos de valor agregado. In M. R. Kosseva & C. Webb (Eds.), Food industry wastes: Assessment and recuperation of commodities (2nd ed., pp. 275–302). Academic Press, Elsevier. ISBN: 978-0128171219.
- Korotkiy, I. A., Korotkaya, E. V., Neverov, E. N., Plotnikov, I. B., & Efremov, D. A. (2021, September). Separatory freezing and cryoconcentration of milk and whey. IOP Conference Series: Earth and Environmental Science, 852(1), 012052. IOP Publishing. https://doi.org/10.1088/1755-1315/852/1/012052/meta
- Lacroix, M., Bon, C., Bos, C., Léonil, J., Benamouzig, R., Luengo, C., Fauquant, J., Tomé, D., & Gaudichon, C. (2008). Ultra high temperature treatment, but not pasteurization, affects the postprandial kinetics of milk proteins in humans. The Journal of Nutrition, 138(12), 2342–2347. https://doi.org/10.3945/jn.108.096990
- Levi, C. S., & Lesmes, U. (2014). Bi-compartmental elderly or adult dynamic digestion models applied to interrogate protein digestibility. Food & Function, 5(10), 2402–2409. https://doi.org/10.1039/c4fo00478g
- Master, P. B. Z., & Macedo, R. C. O. (2021). Effects of dietary supplementation in sport and exercise: A review of evidence on milk proteins and amino acids. Critical Reviews in Food Science and Nutrition, 61(7), 1225–1239. https://doi.org/10.1080/10408398.2020.1756216
- Nielsen, P. M., Petersen, D., & Dambmann, C. J. J. O. F. S. (2001). Improved method for determining food protein degree of hydrolysis. Journal of Food Science, 66(5), 642–646. https://doi.org/10.1111/j.1365-2621.2001.tb04614.x
- Panesar, P. S., y Kennedy, J. F. (2012). Enfoques biotecnológicos para la adición de valor del suero. Reseñas críticas en biotecnología, 32(4), 327–348.
- Parra Huertas, R. A. (2009). Lactosuero: importancia en la industria de alimentos. Revista facultad nacional de agronomía Medellín, 62(1), 4967–4982.
- Quinteros, G. J. (2020). Estudios de concentración de lactosuero mediante crioconentración progresiva agitada [ Master’s thesis, Universitat Politècnica de Catalunya]. http://hdl.handle.net/2117/327075
- Raventós, M., Hernández, E., Auleda, J., & Ibarz, A. (2007). Concentration of aqueous sugar solutions in a multi-plate cryoconcentrator. Journal of Food Engineering, 79(2), 577–585. https://doi.org/10.1016/j.jfoodeng.2006.02.017
- Rohini, A., Agrawal, N., Kumar, H., & Kumar, V. (2018). Emerging role of branched chain amino acids in metabolic disorders: A mechanistic review. PharmaNutrition, 6(2), 47–54. https://doi.org/10.1016/j.phanu.2018.01.003
- Sánchez, J., Hernández, E., Auleda, J. M., & Raventós, M. (2011). Freeze concentration of whey in a falling-film based pilot plant: Process and characterization. Journal of Food Engineering, 103(2), 147–155. https://doi.org/10.1016/j.jfoodeng.2010.10.009
- Souza, R. R., Gimenes, M. L., Costa, S. C., & Müller, C. M. (2008). Eliminación de grasas del suero de queso para obtener proteínas y lactosa. Información tecnológica, 19(2), 41–50. https://doi.org/10.4067/S0718-07642008000200006
- Tang, J. E., Moore, D. R., Kujbida, G. W., Tarnopolsky, M. A., & Phillips, S. M. (2009). Ingestion of whey hydrolysate, casein, or soy protein isolate: Effects on mixed muscle protein synthesis at rest and following resistance exercise in young men. Journal of Applied Physiology. https://doi.org/10.1152/japplphysiol.00076.2009
- Yañez-Ñeco, C. V., Cervantes, F. V., Amaya Delgado, L., Ballesteros, A. O., Plou, F. J., & Arrizon, J. (2021). Synthesis of β(1 → 3) and β(1 → 6) galactooligosaccharides from lactose and whey using a recombinant β-galactosidase from Pantoea anthophila. Electronic Journal of Biotechnology, 49, 14–21. https://doi.org/10.1016/j.ejbt.2020.10.004
- Yasmin, A., Butt, M. S., Sameen, A., & Shahid, M. (2013). Physicochemical and amino acid profiling of cheese whey. Pakistan Journal of Nutrition, 12(5), 455. https://doi.org/10.11/420.4007&rep=rep1=&type=pdf
- Zúñiga, R. N., & Aguilera, J. M. (2009). Structure–fracture relationships in gas-filled gelatin gels. Food Hydrocolloids, 23(5), 1351–1357. https://doi.org/10.1016/j.foodhyd.2008.11.012