1,404
Views
1
CrossRef citations to date
0
Altmetric
Research Article

Determination and pharmacokinetic study of isothiouronium-modified pyrimidine-substituted curcumin analog (1G), a novel antitumor agent, in rat plasma by liquid chromatography–tandem mass spectrometry

, , , , , , & show all
Pages 1505-1512 | Received 17 Jan 2019, Accepted 27 Mar 2019, Published online: 16 Apr 2019

Abstract

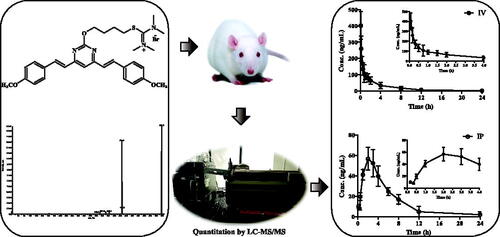
1G, a novel derivative of curcumin, exhibits promising anticancer activities in various cancer cell lines. To support its further pharmacological studies, a liquid chromatography–tandem mass spectrometry method was developed and validated in accordance with FDA's Guidance. After extraction by protein precipitation, analytes were separated by a 4.5 min gradient elution (water/0.1% formic acid and methanol) on a reverse-phase C18 column at 40 °C. The multiple reaction monitoring mode was used for quantification on a triple quadrupole mass spectrometer with positive ionization. The assay was linear over the concentration range of 5–1000 ng/mL with a correlation coefficient (r) greater than 0.99. Values of intra- and inter-day precision and accuracy were satisfactory, i.e. <10.1% for precision and within ± 14.5% for accuracy. No obvious matrix effect was observed. Recovery of the analyte was higher than 95.3%. 1G was stable during the whole analytic process. The validated method was successfully applied to the pharmacokinetic study of 1G after intravenous and intraperitoneal administration in rats. Favorable pharmacokinetic profiles were demonstrated, including good abdominal absorption (F = 62.58%), moderate clearance and high extravascular distribution. Results indicated that as a novel antitumor agent, 1G exhibited acceptable pharmacokinetic properties for further in vivo pharmacologic evaluation.

View correction statement:
Correction

Introduction

Curcumin (1,7-bis (4-hydroxy-3-methoxyphenyl)-1,6-heptadiene-3, 5-dione; also called diferuloylmethane, ) is a polyphenolic phytochemical extracted from the root of Curcuma longa, commonly called turmeric. Numerous studies have shown the antioxidant [Citation1,Citation2], anti-inflammatory [Citation3,Citation4], antimalarial [Citation5,Citation6] and neuroprotective properties [Citation7,Citation8] of curcumin. Moreover, cell culture experiments have shown the antitumor activity of curcumin in various human cancer cell lines, such as leukemia [Citation9], esophageal cancer [Citation10], gastric cancer [Citation11], liver cancer [Citation12], lung cancer [Citation13] and cervical cancer [Citation14]. Despite the potential therapeutic effects of curcumin, clinical applications are restricted by its poor bioavailability, rapid metabolism, low solubility and extensive rapid excretion [Citation15–20]. These inherent problems prompted us to synthesize novel isothiouronium-modified pyrimidine-substituted curcumin analogs [Citation21–23] with improved pharmacokinetic profiles.

Figure 1. Chemical structure of curcumin.

Figure 1. Chemical structure of curcumin.

Out of all the derivates, 1G ((E,E)-2-(4-(4,6-bis(4-methoxystyryl)pyrimidin-2-yloxy)butyl)- 1,1,3,3-tetramethylisothiouronium hydrobromide) has shown improved anticancer activity. The IC50 values of 1G treatment for 48 h in four human cancer cell lines A549 (lung), H1299 (lung), HCT116 (colon) and HT29 (colon) were 2.26 μM, 7.49 μM, 3.00 μM and 5.97 μM, respectively [Citation23]. Based on the superior biological activity, 1G was selected for further development as a potential anti-tumor lead.

It is well known that pharmacokinetic study plays an important role in drug development as it assists in predicting and elucidating a variety of events linked to efficacy and toxicity of a drug [Citation24–26]. To further explore the pharmacokinetic profile of 1G, a rapid and sensitive liquid chromatography–tandem mass spectroscopy (LC–MS/MS) method was developed in this study for quantification of 1G in rat plasma. After validation in terms of selectivity, linearity, precision, accuracy, extraction recovery, matrix effect and stability, this method was applied to the pharmacokinetic study of 1G in rats after intravenous administration and intraperitoneal injection. The pharmacokinetic data of this study will support optimization of dosing regimens for future preclinical efficacy studies.

Materials and methods

Reagents and chemicals

1G (, purity > 99%) and the internal standard (IS) 1 D ((E,E)-4-(4,6-bis(4-methoxystyryl)pyrimidin-2-yloxy)butyl carbamimidothioate hydrobromide) (, purity >99%) were synthesized and purified according to the previously described procedures [Citation23]. Methanol (MeOH, LC-MS-grade) and Formic acid (HCOOH, HPLC-grade) were purchased from TEDIA (Fairfield, Lowa, USA). All the other reagents were of analytical grade. Polyethylene glycol 400 (PEG400), Poly (propylene glycol) 400 (PG400) and DMSO were obtained from Nanjing Chemical Reagent Co. (Nanjing, China). Water was purified using ultra-pure water system (Millipore, Bedford, MA, USA). Blank plasma was purchased from Chundu Biotechnology Co., Ltd. (Wuhan, Hubei, China) and was stored at −80 °C.

Figure 2. Chemical structures of 1G (A) and IS (B).

Figure 2. Chemical structures of 1G (A) and IS (B).

Instrumentations and conditions

Analysis was performed using an AB ACIEX API 4000 triple-quadrupole mass spectrometer (Framingham, MA, USA) with an electrospray ionization (ESI) source interfaced with an Agilent 1290 Infinity II (Palo Alto, CA, USA) HPLC system with a G7120A pump, a G4212-60008 inline degasser, a G7167B autosampler and a G7116B column oven. Analyst software, version 1.6.3 (AB Sciex) was used for instrument control and for data acquisition and processing.

HPLC separation was carried out using a Welch Ultimate AQ-C18 (100 × 2.1 mm, 3 μm) column at 40 °C. The mobile phase, which was mixed with solvent A (H2O, containing 0.1% HCOOH) and solvent B (MeOH), was gradient elution at a flow rate of 0.4 ml/min. The elution condition was 40% solvent B for 1.0 min, ascended to 95% B at 1.01 min, held for 2 min, re-equilibrated to 40% B in 0.01 min and maintained for 1.5 min. Total running time was 4.5 min. The injection volume was 2 μL.

Analyte and IS detection was performed in positive ESI mode. Source dependent parameters were optimized by flow infusion analysis: nebulizer gas (55 Psi), auxiliary gas (55 Psi), curtain gas (20 Psi), ion spray voltage (5500 eV) and temperature (550 °C). Compound dependent parameters were manually optimized as follows: an entrance potential of 10 V and a cell exit potential of 13 V for both 1G and IS. Collision energies of 35 V and 24 V and declustering potential of 60 V and 50 V were used for 1G and IS, respectively. The multiple reaction monitoring (MRM) mode was used for quantification, with the transitions set at m/z 547.2 → 415.1 for 1G and m/z 491.2 → 361.2 for IS ().

Figure 3. Product ion mass spectrum of 1G (A) and IS (B).

Figure 3. Product ion mass spectrum of 1G (A) and IS (B).

Preparation of stock solutions and standards

The stock solutions of 1G and the IS were prepared individually by dissolving 5.0 mg of 1G or 5.0 mg of 1D in 10.0 ml of MeOH, respectively. A set of 1G working solutions containing 50, 100, 200, 500, 1000, 2000, 5000 and 10,000 ng/mL were prepared by serial dilution using MeOH. A working solution of the IS was prepared by diluting the stock solution with MeOH by a factor of 500 to a final concentration of 1 μg/mL. All stock solutions and working solutions were stored at −20 °C when not in use.

The calibration standard samples at various concentrations (5, 10, 20, 50, 100, 200, 500 and 1000 ng/mL) were prepared by spiking 5 μL of corresponding 1G working solutions to 45 μL of blank rat plasma. Quality control (QC) samples at three different levels (low, 10 ng/mL; medium, 100 ng/mL; high, 500 ng/mL) for method validation were prepared similarly.

Sample preparation

Plasma samples were thawed to room temperature before processing. To a 50 μL aliquot of plasma sample, 5 μL of the IS working solution was added. The sample was deproteinized by adding 95 μL of MeOH and vortexed for 3 min. After centrifugation at 13,400 rpm for 5 min, 2 μL of the supernatant was injected to the LC-MS/MS system.

Method validation

Method validation in rat plasma was performed following the FDA's Guidance for Industry: Bioanalytical Method Validation [Citation27]. The LC-MS/MS method was fully validated for specificity, linearity, precision, accuracy, recovery, matrix effect and stability.

Specificity

The specificity of this method was assessed by analyzing six different lots of blank rat plasma and comparing them with corresponding plasma samples spiked with 1G and IS.

Linearity

The linearity of 1G in rat plasma ranging from 5 to 1000 ng/mL was detected. The calibration graph was plotted based on the peak area ratios (y) of 1G to the IS against the respective nominal concentrations (x), and the curves were calculated by least squares linear regression with a (1/x2) weighting factor. The lower limit of quantification (LLOQ) was required to be analyzed with accuracy of 80–120% and allowed a precision of 20% or less.

Precision and accuracy

In order to evaluate the precision and accuracy of the method, QC samples at three concentration levels (10, 100 and 500 ng/mL) were analyzed in five replicates on three separate days. The precision was defined as relative standard deviation (RSD) while the accuracy was defined as relative error (RE). Acceptable criteria included precision within 15% RSD and accuracy within ± 15%.

Recovery and matrix effect

Recovery and matrix effect were performed at three QC concentrations. The recovery of 1G was assessed by comparing peak area ratios of blank matrix samples spiked with analyte with deproteinized blank matrix samples spiked with analyte (n = 5). The matrix effect was tested by calculating the peak area ratios of deproteinized blank matrix samples spiked with analyte with those of the neat standard solutions (n = 5).

Stability

The stability of 1G in rat plasma was conducted at three QC levels (n = 5) under different conditions (time and temperature). For short-term and long-term stability, plasma samples were kept at 25 °C for 6 h and −20 °C for 1 month before sample preparation. For freeze-thaw stability assay, samples were investigated after three freeze-thaw cycles (−20 to 25 °C). For post-preparative stability evalution, the processed samples were kept in autosampler at ambient temperature for 24 h before analysis. Samples were considered to be stable if the bias between the concentrations of 0 h and those of different storage conditions was within ± 15%.

Method application

To validate the applicability of the established method, the pharmacokinetics of 1G were studied in SD rats following single intravenous administration and intraperitoneal injection. The animal study protocol was approved by the Ethic Committee of Laboratory Animals of the Affiliated Hospital of Qingdao University. Twelve healthy Sprague-Dawley rats (male, 185–215 g) were purchased from Beijing Vital River Experimental Animal Co. Ltd (Beijing, China) and were applied in this experiment. The animals were maintained in air-conditioned animal quarters with alternating 12 h light/dark cycles at a room temperature of 22 ± 2 °C and a relative humidity of 50 ± 10%. The rodents were given a commercial rat chow and water ad libitum and were fasted for 12 h prior to pharmacokinetic study. A dose of 5 mg/kg were selected based on our previous studies on its efficacy and toxicology (unpublished data). Formulation was prepared using PEG400: PG400: DMSO: saline (30:30:1:39, v/v/v/v) to give a concentration of 2 mg/mL. Study was performed following single intravenous administration or single intraperitoneal injection of 1G at 5 mg/kg. For intravenous administration experiment, blood samples (0.2 ml) were collected at 0 (pre-dose), 5, 10, 20, 30 and 45 min, and 1, 1.5, 2, 4, 8, 12 and 24 h after dosing. For intraperitoneal injection experiment, blood samples were collected at 0 (pre-dose), 10, 20 and 30 min, and 1, 2, 3, 4, 6, 8, 12 and 24 h after dosing. Samples were centrifuged at 4500 rpm for 15 min at 4 °C to give 50 μL of plasma. These samples were processed as described in part 2.4 and stored at −20 °C prior to analysis.

Pharmacokinetics analysis

DAS pharmacokinetic software Data Analysis System, version 3.0.2 was used for pharmacokinetic analysis of 1G concentrations. A non-compartmental model was applied for analysis of the data following intravenous administration and intraperitoneal injection of 1G. The peak plasma concentration (Cmax), time to reach the maximum concentrations (Tmax), half-life (t1/2), apparent volume of distribution (Vz), clearence (CLz) and area under the concentration-time curve (AUC) could all be obtained.

Results and discussion

Optimization of mass spectrometric conditions

The positive ionization mode was chosen for the detection of 1G and 1D (IS) because the analytes produced a stronger signal in this mode than in the negative ionization mode. [M + H]+ was shown to be the parent ion for both 1G and IS in full-scan of Q1 mode, m/z 547.2 for1G and m/z 491.2 for IS. The most abundant product ions were m/z 415.1 for 1G and m/z 361.2 for IS. Therefore, the MRM transitions of m/z 547.2 → 415.1 for 1G and 491.2 → 361.2 for IS were selected for quantification. Mass spectrometric parameters like fragmentor voltage, collision energy were optimized to obtain higher sensitivity and greater stability.

Optimization of chromatographic conditions

The isocratic mobile phases with different concentrations of MeOH or ACN were tested and they were found to be unsatisfactory due to the peak broadening and irreproducibility effect. To overcome these problems, a gradient flow was employed. Further studies indicated that the better peak shape could be obtained by adding 0.1% HCOOH to water phase. Therefore, modified mobile phases (solvent A: water containing 0.1% HCOOH; solvent B: MeOH) were ultimately selected to achieve higher method sensitivity. In addition, gradient elution was applied to reduce interference of endogenous substance.

Selection of internal standard

It is important to select the correct IS for developing a reliable bioanalytical method, especially for LC-MS/MS method. General speaking, analogs of the analyte are usually used as the IS. In this study, the pyrimidine-substituted curcumin analog 1D, which was the homolog of 1G, was selected as IS because of its similar recovery, retention time and matrix effect.

Optimization of extraction process

Liquid-liquid extraction and protein precipitation were investigated to extract analytes from the plasma samples, and both showed good extraction performance. Compared with the complexity of liquid-liquid extraction, protein precipitation was simpler and more time saving. To avoid a symmetric and spread-out peak shapes, MeOH was chosen as the precipitation solvent and was compatible with the mobile phase. At the same time, symmetrical peak shapes of 1G and the IS were produced. It also produced a clean narrower chromatogram for the plasma sample.

Method validation

Specificity

The specificity of the assay was examined using the described mass spectrometric parameters and chromatographic conditions. The representative MRM chromatograms of a blank rat plasma (), a blank rat plasma spiked with 1G and IS () and a plasma sample obtained 10 min after intravenous administration of 1G and IS () are shown in . The peak at 3.59 min which was well separated from the test compounds should be an endogenous substance in the plasma. No significant peaks interfering the quantitation of the analytes were detected in plasma matrix. The retention time of 1G and the IS were 2.04 min.

Figure 4. Representative MRM chromatograms of 1G (1) and IS (2) in rat plasma samples: (A) blank plasma sample; (B) blank plasma sample spiked with 1G (5 ng/mL, LLOQ) and IS (100 ng/mL); and (C) plasma sample at 10 min after an intravenous administration of 5 mg/kg 1G.

Figure 4. Representative MRM chromatograms of 1G (1) and IS (2) in rat plasma samples: (A) blank plasma sample; (B) blank plasma sample spiked with 1G (5 ng/mL, LLOQ) and IS (100 ng/mL); and (C) plasma sample at 10 min after an intravenous administration of 5 mg/kg 1G.

Linearity

The calibration curves for 1G were linear over the concentration range of 5–1000 ng/mL. The correlation coefficient (r) was greater than 0.99. Besides LLOQ, the back-calculated concentration of individual calibrators used to determine the calculation curve ranged from 88.6% to 112.4% of the true value. The LLOQ, defined as the lowest concentration analyzed with accuracy within ± 20% and precision ≤ 20%, was 5 ng/mL for 1G in rat plasma. And the signal to noise ratio of 1G at LLOQ was >10.

Precision and accuracy

Results of precision and accuracy of this method are shown in . The values for the intra- and inter-day precision ranged from 7.3% to 9.1% and from 6.8% to 10.1%, respectively. The values for the intra- and inter-day accuracy ranged from 91.4% to 114.5% and from 85.6% to 114.5%, respectively. The results were all within the acceptable limits according to FDA guidelines indicating that this method was reproducible for the determination of analytes in rat plasma.

Table 1. Intra- and inter-day precision and accuracy of the method for 1G in rat plasma (n = 5).

Recovery and matrix effect

The extraction recoveries of 1G from rat plasma were determined to be 100.8 ± 5.4%, 95.3 ± 4.9% and 98.3 ± 4.5% for the low, medium and high-level QC samples, respectively. The effect of matrix on ionization was 93.9 ± 4.6%, 94.3 ± 2.2% and 96.1 ± 2.7% for the three QC concentration samples, respectively. Recovery and matrix effect of IS were calculated to be 101.1 ± 2.7% and 96.6 ± 1.8%, respectively. The data indicated that the matrix effect could be neglected and the results are summarized in .

Table 2. Recovery and matrix effect of the method for 1G and IS in rat plasma (n = 5).

Stability

listed the stability data of 1G in rat plasma stored under different conditions. No significant sample loss was observed during the 6 h storage at room temperature, one-month storage at −0 °C, three freeze-thaw cycles (−20 °C → 25 °C), or 24 h storage in autosampler at ambient temperature. The concentration deviations between 0 h and different storage conditions were less than ±10.9%, indicating that 1G was stable under the various storage and analysis conditions required for the experiment.

Table 3. Stability of the method for 1G in rat plasma (n = 5).

Pharmacokinetic data analysis

The validated LC-MS/MS method was successfully applied to a preliminary pharmacokinetic study of 1G in male SD rats. The concentration–time curves of 1G following single-dose intravenous administration and intraperitoneal injection at 5 mg/kg are shown in . The corresponding pharmacokinetic parameters obtained are displayed in . After intraperitoneal injection, the average Cmax occurred at 2.17 h. The Mean Cmax of intravenous and intraperitoneal administration routes was 402.17 and 57.61 ng/mL, respectively. Areas under the concentration-time curves indicated that the systemic availability of intraperitoneal route was approximately 62.58%. Results showed that 1G was eliminated from plasma at a moderate rate after administration. The mean t1/2 for intravenous and intraperitoneal injections was 4.06 and 3.03 h, respectively. The average CLz was 9.92 and 14.48 L/h/kg, respectively. The mean Vz of 1G (intravenous administration: 62.91 L/kg; intraperitoneal injection: 61.87 L/kg) was significantly higher than the average total body water volume of rats (0.67 L/kg) [Citation28], indicating that 1G was widely distributed in tissues.

Figure 5. Mean concentration–time curves of 1G following single-dose intravenous administration (A) and intraperitoneal injection (B) at 5 mg/kg in rats (mean ± SD, n = 6).

Figure 5. Mean concentration–time curves of 1G following single-dose intravenous administration (A) and intraperitoneal injection (B) at 5 mg/kg in rats (mean ± SD, n = 6).

Table 4. Pharmacokinetic parameters of 1G following single-dose intravenous administration and intraperitoneal injection at 5 mg/kg in rats (n = 6).

Conclusion

In conclusion, we have developed and validated a sensitive, specific, rapid and reproducible LC–MS/MS method to quantify 1G in rat plasma. Several notable advantages of this new method made it attractive, including convenient sample preparation by single-step protein precipitation, simple mobile phase composition, short run time for high throughput analysis, high sensitivity to determine very low concentration of the analyte in plasma. The assay has been successfully applied to a pharmacokinetic study of 1G in rats, demonstrating its practical use for future ADMET (absorption, distribution, metabolism, elimination and toxicity) study of 1G in biological matrix. The pharmacokinetic data obtained in this study showed that 1G possessed favorable in vivo pharmacokinetic profiles, including good abdominal absorption, moderate clearance and high extravascular distribution. These results would provide important information for its further development as a novel anti-tumor agent. As a promising preclinical candidate for the treatment of tumors, more studies should be conducted on 1G in the future.

Disclosure statement

No potential conflict of interest was reported by the authors.

Additional information

Funding

This work was supported by the Beijing Medical and Health Foundation under Grant B17106-023 and the Affiliated Hospital of Qingdao University under Grant 2198.

References

  • Yao M, Yang L, Wang J, et al. Neurological recovery and antioxidant effects of curcumin for spinal cord injury in the rat: a network meta-analysis and systematic review. J Neurotrauma. 2015;32:381–391.
  • Alves TF, Chaud MV, Grotto D, et al. Association of silver nanoparticles and curcumin solid dispersion: antimicrobial and antioxidant properties. AAPS PharmSciTech. 2018;19:225–231.
  • He Y, Yue Y, Zheng X, et al. Curcumin, inflammation, and chronic diseases: how are they linked? Molecules. 2015;20:9183–9213.
  • Ma F, Liu F, Ding L, et al. Anti-inflammatory effects of curcumin are associated with down regulating microRNA-155 in LPS-treated macrophages and mice. Pharm Biol. 2017;55:1263–1273.
  • Ghosh A, Banerjee T, Bhandary S, et al. Formulation of nanotized curcumin and demonstration of its antimalarial efficacy. Int J Nanomedicine. 2014;9:5373–5387.
  • Marti Coma-Cros E, Biosca A, Lantero E, et al. Antimalarial activity of orally administered curcumin incorporated in Eudragit((R))-containing liposomes. Int J Mol Sci. 2018;19:E1361.
  • Marslin G, Sarmento BF, Franklin G, et al. Curcumin encapsulated into methoxy poly(ethylene glycol) poly(epsilon-caprolactone) nanoparticles increases cellular uptake and neuroprotective effect in glioma cells. Planta Med. 2017;83:434–444.
  • Djiokeng Paka G, Doggui S, Zaghmi A, et al. Neuronal uptake and neuroprotective properties of curcumin-loaded nanoparticles on SK-N-SH cell line: role of poly(lactide-co-glycolide) polymeric matrix composition. Mol Pharmaceutics. 2016;13:391–403.
  • Sun D, Zhou JK, Zhao L, et al. Novel curcumin liposome modified with hyaluronan targeting CD44 plays an anti-leukemic role in acute myeloid leukemia in vitro and in vivo. ACS Appl Mater Interfaces. 2017;9:16857–16868.
  • Zheng BZ, Liu TD, Chen G, et al. The effect of curcumin on cell adhesion of human esophageal cancer cell. Eur Rev Med Pharmacol Sci. 2018;22:551–560.
  • Huang F, Yao Y, Wu J, et al. Curcumin inhibits gastric cancer-derived mesenchymal stem cells mediated angiogenesis by regulating NF-kappaB/VEGF signaling. Am J Transl Res. 2017;9:5538–5547.
  • Marquardt JU, Gomez-Quiroz L, Arreguin Camacho LO, et al . Curcumin effectively inhibits oncogenic NF-κB signaling and restrains stemness features in liver cancer. J Hepatol. 2015;63:661–669.
  • Zhan JW, Jiao DM, Wang Y, et al. Integrated microRNA and gene expression profiling reveals the crucial miRNAs in curcumin anti-lung cancer cell invasion. Thorac Cancer. 2017;8:461–470.
  • Zaman MS, Chauhan N, Yallapu MM, et al. Curcumin nanoformulation for cervical cancer treatment. Sci Rep. 2016;6:20051
  • Anand P, Kunnumakkara AB, Newman RA, et al. Bioavailability of curcumin: problems and promises. Mol Pharm. 2007;4:807–818.
  • Carolina Alves R, Perosa Fernandes R, Fonseca-Santos B, et al. A critical review of the properties and analytical methods for the determination of curcumin in biological and pharmaceutical matrices. Crit Rev Anal Chem. 2018.
  • Peng S, Li Z, Zou L, et al. Improving curcumin solubility and bioavailability by encapsulation in saponin-coated curcumin nanoparticles prepared using a simple pH-driven loading method. Food Funct. 2018;9:1829–1839.
  • Liang H, Friedman JM, Nacharaju P. Fabrication of biodegradable PEG-PLA nanospheres for solubility, stabilization, and delivery of curcumin. Artif Cells Nanomed Biotechnol. 2017;45:297–304.
  • Kumar S, Kesharwani SS, Mathur H, et al. Molecular complexation of curcumin with pH sensitive cationic copolymer enhances the aqueous solubility, stability and bioavailability of curcumin. Eur J Pharm Sci. 2016;82:86–96.
  • Chaharband F, Kamalinia G, Atyabi F, et al. Formulation and in vitro evaluation of curcumin-lactoferrin conjugated nanostructures for cancerous cells. Artif Cells Nanomed Biotechnol. 2018;46:626–636.
  • Qiu P, Xu L, Gao L, et al. Exploring pyrimidine-substituted curcumin analogues: design, synthesis and effects on EGFR signaling. Bioorg Med Chem. 2013;21:5012–5020.
  • Shen T, Jiang T, Long M, et al. A curcumin derivative that inhibits vinyl carbamate-induced lung carcinogenesis via activation of the Nrf2 protective response. Antioxid Redox Signal. 2015;23:651–664.
  • Tong S, Zhang M, Wang S, et al. Isothiouronium modification empowers pyrimidine-substituted curcumin analogs potent cytotoxicity and Golgi localization. Eur J Med Chem. 2016;123:849–857.
  • Garralda E, Dienstmann R, Tabernero J. Pharmacokinetic/pharmacodynamic modeling for drug development in oncology. Am Soc Clin Oncol Educ Book. 2017;37:210–215.
  • Jiang J, Zhang Y, Zhang Q, et al. Development and validation of an LC-MS/MS method for the determination of SB-505124 in rat plasma: application to pharmacokinetic study. J Pharm Biomed Anal. 2016;117:205–209.
  • Baselga J, Mita AC, Schoffski P, et al. Using pharmacokinetic and pharmacodynamic data in early decision making regarding drug development: a phase I clinical trial evaluating tyrosine kinase inhibitor, AEE788. Clin Cancer Res. 2012;18:6364–6372.
  • US Food and Drug Administration CfDEaR. Guidance for Industry: Bioanalytical Method Validation; 2018. Available from: https://www.fda.gov/ucm/groups/fdagov-public/@fdagov-drugs-gen/documents/document/ucm070107.pdf.
  • Davies B, Morris T. Physiological parameters in laboratory animals and humans. Pharm Res. 1993;10:1093–1095.