Abstract
Many approaches exist in teaching statistics, however, learning statistics is frequently perceived by students as challenging. While evidence-based teaching approaches like case discussions and flipped-classroom models have been successfully incorporated into multiple disciplines, these methods can have inadequate success when students are affectively detached or sometimes paralyzed by the subject. The sudden need to switch to virtual teaching in Spring 2020 created unprecedented challenges that were overwhelming for instructors and students. This article explores the challenges of teaching a statistics course, and the importance of purposeful use of technology and supportive feedback to effectively engage students and promote learning. Furthermore, this article discusses the results of implementing a Technology-enhanced Supportive Instruction (TSI) model (used since Fall 2019) in teaching a business statistics course. The TSI model uses Microsoft Excel in conjunction with intentional interactions between the student and teacher to help students stay engaged in face-to-face and remote learning. The analysis of Fall 2020 course evaluations, when the course was taught in a dual mode, shows positive students’ perception of instruction and engagement, and indicates that Fall 2020 ratings during dual-mode instruction were not different from Fall 2019 ratings during face-to-face instruction, which supports the potential utility of the model. Supplementary materials for this article are available online.
1 Introduction
Research has shown that when students come to the statistics classroom geared up with anxiety and emotional presumptions, such presumptions become barriers to their learning in a reinforcing cycle of self-doubt, exasperation, and diminished performance (Cavanagh Citation2016; Eyler Citation2018). The use of traditional lecturing methods in teaching statistics has been criticized for decades as many instructors deliver the content in a passive manner and research shows that more engaging techniques are needed to include the students in the learning process and allow them to gain the required knowledge (Paul Citation2015; Bruff Citation2019). Moreover, including students in the classroom learning process allows them to feel responsible for their own learning and success (Fleck-Henderson and Melendez Citation2009). The American Statistical Association’s Guidelines for Assessment and Instruction in Statistics Education (GAISE) College Report has been emphasizing the importance of fostering active learning in the classroom since the early 2000s, and states that statistics educators “should rely much less on lecturing and much more on alternatives such as projects, lab exercises, and group problem-solving and discussion activities”(Aliaga et al. Citation2005, p. 9).
While some students can read textbooks and attend lectures where instructions are unidirectional, most students prefer engagement and being actively involved throughout the learning experience (Smith and Martinez-Moyano Citation2012). Moreover, it has been found that learning statistics entails framing problems and interpreting results and accomplishing that requires continuous practice (Yilmaz Citation1996).
The recent shift to dual-mode instruction delivery of statistics courses, which combines in-person and online remote learning, has proven to be successful and resulted in comparable student outcomes (Evans et al. Citation2007; Lu and Lemonde Citation2012; Soesmanto and Bonner Citation2019), and the shift to remote learning and dual-mode instruction became a necessity during Fall 2020 during the Covid-19 pandemic (Jasi Citation2021). This article presents an instruction model to interactively teach statistics lecture courses that can be effective in face-to-face (F2F) learning or/and online learning, allowing students’ engagement irrespective of the instruction mode. The next section reviews the existing challenges in statistics education as well as the extended challenges due to disruptions, the third section presents the Technology-enhanced Supportive Instruction (TSI) Model, the fourth section analyzes data related to students’ perception of instruction and finally the fifth section discusses the conclusion and presents potential implications for teaching.
2 Literature Review
2.1 Existing Challenges in Statistics Education
Over the course of the past few decades, researchers have consistently outlined the need for increased statistical literacy among students and society at large (Wallman Citation1993; Gal Citation2002; Bargagliotti et al. Citation2020). Traditional teaching methods and lecture-courses in statistics can be ineffective as they have not succeeded in explaining the relationship between statistics and real-world applications (Yilmaz Citation1996).
Traditional lecture-courses are primarily composed of “a more or less continuous exposition by a speaker who wants the audience to learn something” (Bligh Citation1999, p. 4). This teaching practice has been criticized for years as focusing on a unidirectional communication method of teaching with the primary goal being delivering the content, which students passively receive from the professor.
Researchers argue that we need more engaging methods that include students in the learning process by giving them chances to make and fix mistakes in practice, so they advance their own understandings (Abrams Citation2012; Segesten Citation2012; Paul Citation2015; Bruff Citation2019). Furthermore, engaging students in classroom discussions and conversations is crucial in making them feel part of the learning environment (Safi, Wenzel, and Spalding Citation2020). In addition, in consideration of what it means for students to engage successfully, the role of teachers is crucial in a way that strategically supports students as powerful agents for their own learning (Langer-Osuna Citation2017; Roy et al. Citation2017; National Council of Teachers of Mathematics (NCTM) Citation2018; Berry and Larson Citation2019). This creates shared responsibility in the learning process which ultimately helps students stay engaged as they have become part of their success (Fleck-Henderson and Melendez Citation2009).
Faculty still use lectures in higher education, but they have recently become one of several teaching approaches as faculty are now incorporating more active learning methods in their teaching (Barkley and Major Citation2018). In addition, the argument has now moved beyond the simple “lecture versus active learning” as researchers in teaching and learning emphasize the importance of developing a refined understanding of how active learning is done well (Cerbin Citation2018).
Peer instruction is an example of a successful adaptation of the lecture to the theory and science of learning and has been widely implemented in physics and other disciplines (Mazur and Somers Citation1999). Team-based learning (TBL) has also shown positive impact on learning in certain disciplines, including statistics (Clair and Chihara Citation2012, Kalaian and Kasim Citation2014, Swanson et al. Citation2019; Charalambous, Hodge, and Ippolito Citation2021). However, students tend to report different learning experiences when it comes to TBL, which could be associated with students’ lack of other important interpersonal skills and the need for persistence and strong institutional support (Abdullah Omer Citation2021). Moreover, the Flipped Classroom (FC) approach in statistics education has shown an improvement in students’ learning and achievement (Farmus, Cribbie, and Rotondi Citation2020), and more specifically when FC is coupled with using technology (e.g., clickers) as a form of assessment to support the FC approach (Reyneke, Fletcher, and Harding Citation2021).
Given that students today were born into a technologically advanced world dominated by the internet, and their early exposure to technology led to improved capabilities for learning supported by technology and visual practice (Rothman Citation2014), they are intolerant for being lectured to or talked at and prefer being engaged in the classroom using multiple tools (McWilliam Citation2015). The use of technology in education does not only allow for the better understanding of concepts through visualization, but it also enables interaction with and the application of concepts through specific programs, benefiting student achievement (Courville Citation2011). The positive impact of technology on education relates to allowing a large population of students to easily access learning on a global scale (Al-Haddad et al. Citation2021). Many research studies advocate and explain the usefulness and effectiveness of technology use in statistics education and have shown clear benefits (Fitzallen Citation2007; Rubin Citation2007; Yilmaz Citation2013; Biehler, Frischemeier, and Podworny Citation2017; Warstat and Proemmel Citation2020). However, the wide adaptation of these technological tools seems to still be limited in statistics education because of the complex user interface design, which has created a clear gap between using the tools and the actual learning of statistics (McNamara Citation2015). The revised GAISE College Report suggested using technology in statistics education to analyze data and enhance the learning experience as long as students understand the fundamental concepts and have the theoretical knowledge (Carver et al. Citation2016). Burckhardt, Nugent, and Genovese (Citation2021) also explained that an Integrated Statistics Learning Environment (ISLE) that employs technology and computing can be effective in statistics education and result in advancing data science education.
Given the critical role of technology and active lecturing in teaching statistics, the important conversation and subsequent actions are not if we should them, but it is how. We should not abandon our role in leading students in learning the principles and practices of statistics and technology, as the old-fashioned “transmission lecture” makes it difficult for students to learn statistics effectively. Although learning statistics can be difficult for a variety of reasons, students often perceive it as intimidating, even impossible. The term statistics anxiety has been defined by researchers as the nervousness that happens when encountering statistics at any level or in any practice (Onwuegbuzie, DaRos, and Ryan Citation1997). This is especially true for nonspecialists, many of whom come to the statistics classroom geared up with previous emotional presumptions and anxiety about their innate incompetence to do well. Such emotional presumptions become barriers to their learning in a reinforcing sequence of self-doubt, exasperation, and diminished performance (Steele and Aronson Citation1995; Cavanagh Citation2016; Eyler Citation2018). Moreover, students who experience stronger statistics anxiety are less likely to participate in deep understanding of the course material, use correct studying strategies, or keep working on hard statistics-related problems (González et al. Citation2016). Learning statistics requires formulating problems and explaining results, and the key is to keep practicing them (Yilmaz Citation1996). If students’ emotional barriers prevent them from engaging, exploring and practicing, learning statistics becomes even more difficult. While some students can learn statistics by reading the textbook and listening passively to lectures, most students prefer being engaged in the learning process (Smith and Martinez-Moyano Citation2012; Rothman Citation2014). Recent research suggests that computer-integrated learning tools should enable interactivity in statistics education to support classroom-focused learning (Burckhardt, Nugent, and Genovese Citation2021).
2.2 Extended Challenges due to the Covid-19 Pandemic
Educational interruptions around the world are not without precedent, and in fact the inequities and consequences of such breaks in conditions related to teaching and learning have been well documented, where the causes and connections to school interruptions have been connected to housing insecurity, natural disasters, or chronic health issues (Brock Citation2013; Kurtz Citation2019; Kubek et al. Citation2020; Rosenbaum Citation2020). During such challenging times, students oftentimes cannot rely on such routines involving socialization and interactions that engage them in activities that help to form communities and shared experiences. As education is an inherently social endeavor, students rely on educational experiences to connect, learn and grow together. In fact, as Su (Citation2020) has indicated in Mathematics for Human Flourishing, one of the reasons for engaging in analysis such as those found in mathematics and statistics involves the notion that such engagement “connects to our deepest human desires… [and so] helps people flourish” (p. 10). When the pandemic started in the United States in early 2020, schools quickly needed to switch to remote instruction in March 2020. The shift to online teaching in response to Covid-19 was necessarily abrupt and as such required faculty to lean on each other for content-specific ideas (Safi, Wenzel, and Spalding Citation2020). As outlined by Safi, Wenzel, and Spalding (Citation2020), emergent themes included concerns such as “Facilitating whole class/small group instruction, incorporating interactive shared documents, using student responses before/during/following instruction” (p. 5) as well as establishing discourse norms during synchronous classes.
This research project focuses on interactive lectures more than the traditional approach plus active learning methods intended to allow for students to talk. As an alternative, this interactive lecture is “something more than the simply conjoining of two instructional approaches” (Barkley and Major Citation2018, p. 16) and is instead characterized by intentional choices to help a range of students learn statistics, particularly those with affective barriers that make learning statistics especially challenging. Also, rather than an intensive overhaul of our familiar ways of teaching, this interactive lecture involves manageable changes in the spirit of James Lang’s principle of Small Teaching, which “draws from the deep well of research on learning and higher education to create a deliberate, structured, and incremental approach to changing our courses for the better” (Lang Citation2016, p. 5). The “small teaching” component of this interactive lecture in the statistics class is a formative assessment through the use of computing in the curriculum and more specifically Microsoft Excel. The distinctiveness of Excel lies in its ease of use and low cost, relative to other software packages, and being one of the most used business analysis tools (Camm et al. Citation2016; Olafusi Citation2016; Al-Haddad et al. Citation2019). However, the TSI model could be extendable to other software packages as many software packages can have similar capabilities as discussed in Section 4.2.
By intentionally pausing the lecture periodically and asking students to turn to an Excel file to work along and solve practice problems while the professor is explaining the topic, the professor can be more responsive to students’ learning needs, both cognitively and affectively. This process of metacognition allows students to think about their thinking which has been proven by decades of research of the National Academy of Sciences on the science of learning to improve learning effectiveness (Bransford, Brown, and Cocking Citation2000).
The next section introduces the interactive instruction model for teaching statistics and explains the details of its two main components.
3 A Technology-Enhanced Supportive Instruction (TSI) Model
Barkley and Major (Citation2018) discussed a model for interactive lecturing that optimizes the benefits of two approaches to instruction: engaging presentation and active learning methods. This complementary pairing allows the instructor to effectively deliver content and integrate formative assessments that inform subsequent content delivery to reach planned learning goals, while also engaging students with the material during in-class practice opportunities. When it comes to interactive statistics lecturing, Burckhardt, Nugent, and Genovese (Citation2021) described an ISLE that “includes a wide variety of interactive learning activities and queries, and it is built on top of and infused with statistical computing and modern information technology” (p. S62). This research draws on these proposed models and learning environments by using carefully designed technology-based lessons coupled with intentional interaction that allow the instructor to share the content in a structured and engaging format with students. Such a format ensures students are actively learning by enabling them to respond and participate while maintaining their interest throughout the lesson.
The TSI model shown in combines technology-supported feedback with intentional teacher–student interaction to cultivate an interactive learning environment that seeks comprehensive understanding of the topic and supports growth, curiosity and critical thinking while respecting the learners.
Fig. 1 Technology-enhanced supportive instruction (TSI) model.
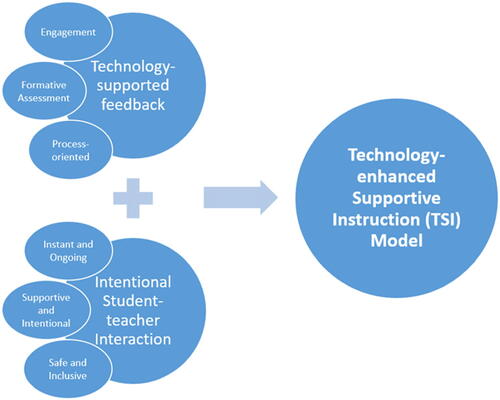
3.1 Technology-Supported Feedback
The first component of the TSI model is well-placed formative assessments that give students immediate feedback on their performance while engaging with the content. A foundational assumption in formative assessment is, according to Angelo and Cross (Citation1993), “To improve their learning, students need to receive appropriate and focused feedback early and often” (p. 9). In a recent article on using formative assessment in a quantitative class, researchers showed that formative assessment interventions can alter students’ insight on the effectiveness of the assessment when it is associated with process-oriented feedback, as it made it possible for students to assess their own proficiency in a positive way (Rakoczy et al. Citation2019). Such feedback need not be complicated: for some tasks, “correct answer feedback” that simply informs students if they are solving problems correctly helps students monitor their learning (Agarwal and Bain Citation2019, p. 134). The auto-graded quizzes typically assigned to support students’ practice outside of class is one example of such helpful and immediate diagnostic feedback. This approach implements a key “small teaching strategy” at “the heart of” Lang’s book by the same name: “Whatever cognitive skills you are seeking to instill in your students, and that you will be assessing for a grade, the students should have time to practice in class” (Lang Citation2016, p. 117). Lang emphasizes this in-class practice specifically so the instructor “can provide feedback while they are working” (p. 124). In the TSI model, the first component—the instructor’s integration of Microsoft Excel—provides correct answer feedback while students are working. A description of the approach, which typically takes up to 40 min of a 50-min class period, is provided below:
The instructor uploads an Excel file with a dataset on the Learning Management System (LMS) of the school before class.
At the beginning of class, the instructor introduces the lesson, explaining its goals and how it applies in a real-world setting. This aids in sparking students’ curiosity, which both makes the topic more interesting and stimulates students’ cognition to pay attention and retain new information (Lang Citation2016).
The students then download the Excel file and start typing definitions and answering questions. The Excel file has existing terms for students to define and questions to answer. Other questions are asked by the professor.
The instructor projects the file on the white board (when in class) or through the video conferencing tool (when taught remotely). While the instructor is explaining the data analysis steps and formulas, students work on analyzing the data alongside the professor, which serves as a “live coding” approach, a dynamic process that modifies the source code in real-time and facilitates students’ engagement (Vasilakos Citation2021). If a student does the work incorrectly, their Excel file will display a different number from what the instructor projects. In this way, Excel provides immediate correct-answer feedback while students are working.
The professor makes frequent breaks to check that all students in class are on track. If a student missed a step, the professor goes over it briefly. If a specific student requires more time, the professor usually waits until the rest of the students are working in pairs, as explained in the next step, and checks again on that student to make sure his/her question or inquiry has been addressed.
Students ask questions as they work to ensure they are following along, and they can work in pairs as long as students are working on separate files. Working in pairs has proven to be beneficial to students’ performance as well as students’ retention and motivation to learn (Yang, Lee, and Chang Citation2016). Students are also encouraged to type notes while learning new concepts.
Lastly, the instructor asks students to summarize the most important main concepts and formulas discussed in class as a recap.
Students individually upload their Excel file on the LMS, and this work counts as participation assignments. The individual work ensures that individual students’ difficulties are not masked.
This use of technology illustrates how a computer-integrated learning environment allows interactivity when teaching statistics courses and can support classroom-focused learning and advance statistics education (Burckhardt, Nugent, and Genovese Citation2021). Furthermore, it has been proven that when applied sciences and statistics learning is combined with Microsoft Excel, students learn better and their performance in class improves (Elrod et al. Citation2015; Al-Haddad et al. Citation2019). Excel is used specifically in this model to promote a “pedagogy of engagement” which enables student to be part of deep learning as well as manage the demands of their future careers (Edgerton Citation2001), and since technology is part of our daily life, it can positively affect how we teach mathematics or statistics courses (Nolan and Temple Lang Citation2010; Fernando and Karunaratne Citation2012; Rakes et al. Citation2022).
This approach also allows students to practice thinking and reflecting, be curious, make mistakes and then reconsider and rethink (Chick and Felten Citation2020). It also provides students with a structured format that guides them to take notes while learning, which helps in maintaining their engagement in the lesson (Barkley and Major Citation2018). The framing of the intentional feedback provided during these activities and throughout the course as well as the interaction between the student and teacher can be as important as the technology-based assessment. The second component of the TSI model is the intentional student–teacher interaction, discussed in the next section. In this component, students receive “elaborative feedback” and other kinds of support in real time (Agarwal and Bain Citation2019, p. 134).
3.2 Intentional Student–Teacher Interaction
Also key to this TSI model is the second component: a learning environment created by constructive interactions with and feedback from the professor. Engagement in class takes place in multiple dimensions. The previous section described timely feedback through the use of Excel for in-class activities. Complementing that feedback on the correctness of student work is well-framed interactions and feedback from the professor to help students feel heard, seen, and supported.
As students practice different skills in Microsoft Excel, the software gives them the immediate feedback of correct or incorrect. Some may say that this kind of practice should be completed as homework, that it is unnecessary or even a waste of class time to have students complete these Excel activities in class. However, the TSI model demonstrates the benefits of students completing this practice in class, in the presence of the instructor. In fact, Lang warns that “Practice that takes place away from the presence of an instructor can become a breeding ground for overlearning, mindless repetition, and the development of wrong or poor habits” (2016, p. 133). The potential for frustration and an increased sense that “I can’t do statistics” is also high. Using class time for this small, well-placed practice allows the professor “to gain a better understanding of [students’] current skill levels and… offer them both individualized and group feedback” (p. 135). This is a cornerstone of the TSI model.
The specific characteristics of the interactions in the TSI model is the second focus of this project. These interactions seemed to be perceived positively by students and help in alleviating their anxiety. Often, the interactions are brief and simple, as in the following examples:
After a student answers a question, the professor says, “Yes, thank you.”
Before asking a question, a student says, “I know this is a stupid question,” and the professor responses quickly with “There are no stupid questions! Every question is important.”
When a student says, “I am just not smart, I’m failing this course,” the professor responds, “this course requires hard work and determination. Let’s come up with a study plan during office hours.”
If a student complains, “this is really hard,” the professor responds, quoting a sentence from Angela Dweck’s book Mindset, “Learning is hard work and struggle increases the mental capability.”
These small but critical moments of interaction when the professor’s “teaching moments” align with the students’ “learning moments” can convey—or not—the professor’s confidence in the student’s ability to do the challenging work of statistics. This layer of feedback is helpful for nonspecialists and others who may not see themselves as able to “do statistics.” Many students, particularly women, students of color, and first-generation college students, carry the weight of stereotypes that suggest they cannot do the work and thus do not belong in math, or science, or even in college. Research has proven that anxiety toward statistics among women and students of color is higher than the anxiety among their Caucasian peers (Davis Citation2003). The distraction of these stereotypes—whether students are aware of it or not—interferes with their performance. Social psychologists describe this phenomenon as a stereotype threat (Cohen and Steele Citation2002; Yeager et al. Citation2014). The common stereotype threat of math and statistics courses are considered high as such courses are perceived as being difficult (Steele and Aronson Citation1995; Steele Citation2010). However, one of the strategies documented to mitigate stereotype threat and free students to perform without the weight of these negative expectations is a specific kind of messaging from the professor. If students hear that the professor believes in their abilities to do the hard work necessary to succeed, this confidence becomes a counterweight to the doubts of the stereotypes. This kind of regular, timely feedback—not only correcting mistakes in real time as they occur but more importantly affirming successes and communicating confidence—gradually replaces these students’ self-doubt with self-efficacy, a sense that they can do it (Rakoczy et al. Citation2019).
It is important to note that the positive learning environment is enabled not through the presence of feedback, rather the nature and intentionality of the feedback that authentically supports students’ engagement as the immediate feedback humanizes the learning process. The examples of the interactions provided in this section were perceived positively by students as shown in their comments in Section 4.2. The thematic analysis categorized the comments into five themes that helped mitigate stereotype threat and reduce the weight of the negative expectations.
The next section presents an example of the proposed TSI Model and provides implementation advice to support the successful execution of the TSI model.
3.3 A TSI Model Example and Implementation Advice
This section provides a demonstration of an example lesson of the TSI model, the Excel file with a dataset that the instructor assigns before class, and implementation advice that can help instructors in applying this model.
3.3.1 An Example Lesson of the TSI model
This lesson is a core chapter in “Descriptive Statistics” and explains the Measures of Central Tendency. It is taught as follows:
The instructor introduces the lesson and explains its goals at the beginning of class and its real-world applicability. The goals are (a) describing the center point of a dataset by calculating the mean, median and mode, (b) interpreting the location of the data, and (c) identifying the shape of its distribution. A real-world applicability is analyzing test scores and their distribution. The instructor briefly explains that the shape of the distribution can be symmetrical or skewed, and further explanation and examples will be provided during class.
The instructor publishes the Excel file on the LMS, which was uploaded before class, and students download the file. The starting file is shown in . Students start typing definitions and answering questions in the cells highlighted in blue. The file has an embedded function formulatext which displays the formula that the instructor and students type in as a text.
The instructor shares the file with the class as explained in Section 3.1 and models how the formulas are used in Excel. Students usually follow along and type answers. The file usually contains multiple sheets (examples), to allow students to practice solving questions before leaving class.
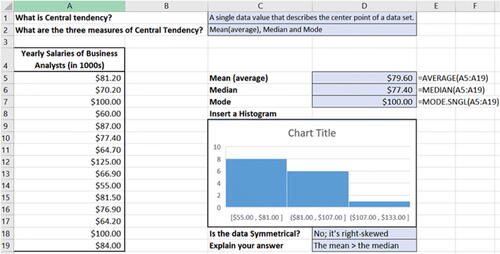
The final or completed file is shown in . Students usually ask questions as they work and can work in pairs as mentioned in Section 3. Students upload the file on the LMS at the end of class individually.
Fig. 2 The starting file in the lesson.
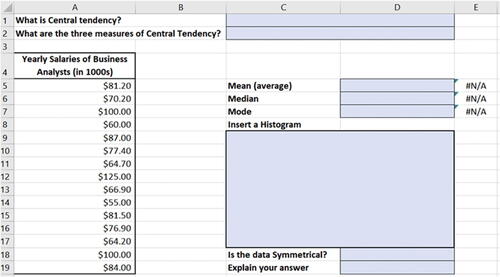
Fig. 3 The completed file in the lesson.
3.3.2 Implementation Advice
The following advice can support the successful implementation of the TSI model:
The instructor makes frequent breaks to check that all students in class are on track.
If a student is stuck, it is helpful if the instructor pauses, asks the rest of students to work in pairs and try to work on the lesson and addresses the question the student(s) has (have).
The instructor should continuously remind and encourage students to type notes in the Excel file while learning new concepts.
The instructor summarizes the lesson at the end of class. Students should be encouraged to provide the important takeaways of the lesson, any new concepts learned and new formulas and techniques they grasped.
4 Data Analysis: Student Perception of Instruction Using the TSI Model
The analyzed course is a one-unit (4 credit hours) core course required of all undergraduate business majors (business management and international business) and students usually take the course in their second year. The course is taught at a small private four-year college. The course uses a textbook that comes with access to MyLab Statistics and Mastery, a Pearson online learning platform that is integrated with and accessed through the college’s Learning Management Systems (LMS). The course is offered every semester and the changes made in the course started in Fall 2019 after students started showing more interest in learning how to use Microsoft Excel, and the TSI model was implemented. Since the Covid-19 Pandemic was extremely disruptive in Spring 2020, the college opted to not have course evaluations that semester. Therefore, this study compared course and instructor evaluation for two semesters: (a) Fall 2019: learning was offered in a face-to-face mode using the TSI model, and (b) Fall 2020: learning was offered in a dual-mode using the TSI model (30% was in-person and 70% was virtual and half of the students opted for fully virtual learning). The instructor had switched from the textbook Business Statistics by Sharpe, De Veaux, and Velleman (Citation2014) to a different textbook Business Statistics by Donnelly (Citation2020) starting Spring 2020 and continued using it in Fall 2020. Nevertheless, the content covered during both semesters was the same and included: types of data, graphing and calculating descriptive statistics, probability, discrete and continuous probability distributions, sampling, confidence intervals, hypothesis testing, and regression analysis. Similar content on MyLab Statistics and Mastery was also assigned as MyLab allows choosing multiple resources when assigning homework, quizzes, and tests. Both student populations were mainly second-year students, which signifies that there were no potential differences in students’ experiences and background knowledge. The research team sought Institutional Review Board (IRB) approval, and approval was granted before starting the research by Rollins College Institutional Review Board and approval number given was 20190214SA. The following research question was investigated:
Research Question:
Are the overall course evaluation ratings different in Fall 2020 during dual-mode instruction compared to Fall 2019 ratings during fully face-to-face instruction?
4.1 Course Ratings
The data consist of course and instructor evaluations for 30 students in Fall 2019 and 54 students in Fall 2020. All 30 students in fall 2019 were face-to-face students, while around 50% of fall 2020 students (27 students) were fully online students. The remaining students in Fall 2020 joined class face-to-face once a week and online twice a week. To control for factors such as method of teaching, the same professor taught all sections, and the majority of students are taking this course in their second year.
summarizes students’ course and instructor evaluation ratings in Fall 2018, Fall 2019 and Fall 2020 and shows a discernible improvement in the overall course evaluation ratings in Fall 2019 and Fall 2020 while using the TSI model when compared to Fall 2018 ratings before the TSI model was implemented. The lowest possible rating is 1 and the highest possible rating is 5. 1 is Poor, 2 is Fair, 3 is Good, 4 is Very Good, and 5 is Excellent.
Table 1 Summary of course evaluation ratings.
The textbook used in Fall 2018 and Fall 2019 was the same, and a different textbook was used in Fall 2020. Although the content was the same, lectures were conducted in a more traditional and passive manner in Fall 2018, where students mainly listen, ask and answer questions and can write down notes. Classroom instruction was mainly done through the use of PowerPoint Slides in Fall 2018.
To answer the research question, Fall 2019 and Fall 2020 data were analyzed. A t-test was performed and resulted in a p-value of approximately 0.8. This result supports the claim that there was no statistically discernible difference in average course evaluation ratings under the Fall 2019 and Fall 2020 modes of instruction.
displays students’ responses on the effectiveness of the course in increasing their knowledge, interest, skills, critical thought, perception. The figure also includes the sample size per semester and the standard deviation in each category. Students are asked to rate the effectiveness of the course in increasing the following:
Fig. 4 Course effectiveness in increasing students’ outcomes.

Knowledge - Increased your understanding of the topic.
Interest - Sparked a desire to learn more about the topic.
Skills - Taught you specific skills relevant to the field.
Critical Thought - Ability to evaluate information and form conclusions.
Perception - Course caused you to think about the world in a different way.
The lowest possible rating is 1 and the highest possible rating is 5. 1 is Poor, 2 is Fair, 3 is Good, 4 is Very Good, and 5 is Excellent.
shows an improvement in the students’ responses on the effectiveness of the course in increasing their knowledge, interest, skills, critical thought, perception in Fall 2019 and Fall 2020 when compared to Fall 2018 and shows that the numbers were relatively similar in Fall 2020 when compared to Fall 2019 which suggests that the responses were steady during the pandemic and that the TSI model was robust to the disruption. For instance, in the area of Skills, the course effectiveness was 4.82 in Fall 2019 and 4.84 in Fall 2020.
shows students’ reactions and perception of performance in the course in terms of engagement, challenge, participation, preparation, performance, and enjoyment. The figure also includes the sample size per semester and the standard deviation in each category. In the course evaluation, students are asked to rate their reactions and performance in the course
Fig. 5 Students’ reactions and perception of performance.
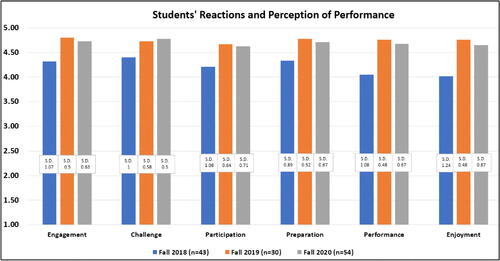
Engagement: You were drawn into the learning experience.
Challenge: Course required you to work at your full potential.
Participation: Degree to which you actively contributed while in class.
Preparation: Attended class having completed assigned readings and homework.
Performance: Your overall level of achievement in this class.
Enjoyment: Learning in this class was enjoyable.
The lowest possible rating is 1 and the highest possible rating is 5. 1 is Poor, 2 is Fair, 3 is Good, 4 is Very Good, and 5 is Excellent.
shows an improvement in students’ reactions and perception of performance in Fall 2019 and Fall 2020 when compared to Fall 2018 and shows that the numbers were relatively similar in Fall 2020 when compared to Fall 2019. These results support the effectiveness of the TSI model in improving students’ reactions and perception of performance and maintaining steady results during the pandemic, suggesting that the model was robust to the disruption. For instance, in the area Challenge, students’ perception was 4.73 in Fall 2019 and 4.78 in Fall 2020.
4.2 Student Comments
Students’ comments on their course and instructor evaluations support the above results and speak directly to the effectiveness of the TSI model. The evaluation instrument used on this campus contains 12 questions, 8 of which include open-ended questions with text boxes for students to enter written comments to complement and, in some cases, clarify the quantitative ratings. Of course, student comments include the occasional critiques of such issues as disliking the textbook (“The book seemed irrelevant. No need to purchase such an expensive book only for discussion questions.”), juggling the workload (“Could have gotten more time for the project,” “I wish there is a little less work due near the end of the semester. There is a lot of work that is due and it might have been better if there was less so we could focus more on the final”), or struggling with the virtual learning environment (“Group work has been tough due to WebEx. It’s hard to engage with one another when we are virtual,” “Obviously the online aspect, but that isn’t much the teacher can do. It is just tough to learn stats through a computer screen.”); however, as with the numerical ratings, the qualitative comments that address the two key components of the TSI model (i.e., technology-supported feedback and a supportive learning environment) are overwhelmingly supportive.
4.2.1 A Challenging Course
First, it’s worth noting that students found the course challenging. The evaluation form includes the question, “How many hours per week on average outside of class did you spend preparing for this course (e.g., studying, reading, writing, rehearsing, etc.)?” The average for this course is 4.5 hr per week, compared to the college average of 3.8 hr per week. In the comment boxes, students also described the course as a “tough class,” “a tad fast for me to keep up,” and “my hardest class,” with “a lot of homework” and a professor who “pushes us to be our best.” Significantly, the full comment for this last observation is “a lot of homework but I guess that is the only way to learn this class,” and the rest of the “my hardest class” sentence is “I am doing extremely well and feel that I am learning.” Throughout the written comments, students describe an awareness that the course, though challenging, has helped them learn and attribute this learning to the specific environment fostered in the class by the TSI model. It’s also worth noting that the average GPA for the course was 2.85, indicating that the course is challenging, and students are expected to work hard to earn their grades.
4.2.2 Engaging Use of Technology for Immediate Feedback (Microsoft Excel)
Students also called attention to the specific way Microsoft Excel was used, one of the key components of the TSI model. In fact, the question “What, if anything, made this course a positive learning experience?” prompted responses like “The class is very engaging because we have to submit an excel file for participation each day,” “The way she taught using excel and the homework she gave was amazing,” “I really enjoyed this course. I like how we used excel in class to draw our attention,” and “The professor allowed students to work on actual problems during class to learn material instead of fully lecturing.” In response to the question “Please add any comments that you feel would help clarify your ratings [of the course in increasing your knowledge and skills],” students again point to these practices, acknowledging that they “improved my skills with working in Excel” and “I consider myself to be exceptionally skilled in excel now and feel very comfortable using it.” Their comments reflect a general appreciation of how Excel was used in class sessions, suggesting that the approach was somehow different from other courses. More precisely, students see it as an effective learning strategy, even though they may not explicitly describe its role in providing immediate feedback on their practice. The only critiques related to this approach were really about the virtual environment, such as “I hated online classes with this course because it was extremely hard to do excel and Webex at the same time” and “At times, I wish the class was always face-to-face because it would be easier to follow along when using Excel.”
It is important to mention that although the proposed TSI model focused on the use of Microsoft Excel files to present the datasets, engage students, and provide immediate feedback, research has shown that using other software packages can have a positive impact on learning (Al-Haddad and Kodzi Citation2021). A large body of research exists related to the concept and meaning of intentional technology integration as well as the strategies that are possible through such technology use (Niess Citation2005, Citation2011; Niess et al. Citation2009) Specifically in the TPACK framework, a model demonstrating the intersection of content, pedagogy and technology explicates the connection between teaching and learning efforts and technology integration (Lee and Hollebrands Citation2008; Koehler and Mishra Citation2009). As such, teaching and learning efforts in the areas of mathematics and statistics commonly adapt technology-based lessons to engage students more effectively in the learning process.
Consequently, the “technology” element of the proposed model is adaptable and could include other well-designed technology-based lessons, where a dataset is assigned using other statistical software packages, including but not limited to: SAS JMP, Minitab, Stata and SPSS. The key elements of the first component of the TSI model, the technology-supported feedback can be achieved by using any software that (a) serves as a formative assessment tool that allow delivering content to reach planned learning goals, (b) allows live coding and engagement where students are participating in real time in entering formulas and writing the code while the professor is modeling the content, and (c) facilitates working in pairs where students can collaborate to learn and improve their knowledge retention in a process-oriented approach.
4.2.3 A Supportive Learning Environment Cultivated by the Instructor
In addition to calling out the effective use of Excel in class, students overwhelmingly attribute their positive experiences and learning in the course to a supportive learning environment created by the instructor. Specifically, descriptions of the kind of learning environment that is central to the TSI model are prevalent. In fact, of the 145 student comments in the three relevant comment boxes (i.e., “What, if anything, made this course a positive learning experience?” “What were the major strengths and weaknesses of the instructor?” and “Please add any comments that you feel would help clarify your ratings of professor characteristics.”), there were 52 descriptions of a specific kind of helpfulness, 22 of responsiveness to current student understanding (or lack thereof), 27 of a noncompetitive environment, and 13 of wanting students to succeed. (Most other comments were expressions of praise for generic characteristics such as “teaching style,” “attitude,” “way of teaching,” or “the way the professor designed this course”; traits that were too general like “great at explaining the content,” “interactive,” or “engaging”; or not clearly related to the TSI model, such as “passionate,” “knowledgeable,” or “attention to detail.”). Thematic data analysis was conducted on students’ comments, and they were categorized into five themes or traits as shown in Appendix A: Representative Student Comments Organized by Learning Environment Traits. The five traits are: empathetic helpfulness, aware of and responsive to students’ understanding, noncompetitive and safe to make mistakes, and assurances that students can do well. Detailed descriptions of each trait are provided in Appendix A. It is important to note that although the students often refer to the professor specifically, they are also describing a learning environment created by the instructor’s observed actions and behaviors, a fact that enables any instructor—regardless of disposition—to apply this aspect of the TSI model in any classroom.
First is the familiar trait of the instructor being “helpful,” but in these students’ comments, the helpfulness is nuanced and amplified: the instructor doesn’t simply answer questions in class, respond to emails, and offer office hours. Instead, she invites questions and responds patiently, clearly, and—most importantly—without judgment. Students note that she is “always open to questions and there to help students when they need it,” “repeat[s] answers over and over if asked,” is “understanding of the students,” and “keep[s] calm even when students do not understand.” The language in these comments suggests that students have experienced more irritable responses to their questions in the past, so this simple trait of patiently responding to questions resulted in a learning environment in which, as one student explained, “I felt comfortable asking any question because I knew she would answer respectfully and never make me feel dumb.” (There were several comments about not being made to “feel dumb.”) Although comments like these might be dismissed as part of the instructor’s personality, a closer look points to specific actions that anyone can implement with intentionality—here, remembering that students are novices grappling with new-to-them and difficult subject matter, recognizing that they ask questions out of a desire to learn, and then responding with understanding, patience, and empathy.
Beyond this instructor trait in reacting to students’ need for help, students also describe a supportive learning environment that has been proactively designed by the teacher, drawing on the principles of formative assessment. The comments portray a consistent process of checking and responding or adapting to student understanding (or lack thereof), a process that’s a centerpiece of the TSI model. They describe the instructor’s consistent efforts to be attuned to student understanding, the kind of awareness resulting from ongoing formative assessment. In students’ words, the instructor “understands the students,” “always made sure everyone understood what was going on,” and “really understand[s] what we as students need and helping us out every way she can.” The students even describe specific instructor behaviors that made them feel this way, such as “slowing down if need or speeding through a concept if students are understanding well,” “explain[ing] all the concepts in a variety of ways so we could understand,” being “easy to follow” and “willing to repeat material,” “[breaking] down complex topics into simpler form for us to understand,” and “paus[ing] after every lesson to ensure understanding.” Implied in all these descriptions of the instructor is a learning environment grounded in activities designed to create a continuous cycle of (a) surfacing students’ understanding in order to (b) inform the instructor of what students know and don’t know in the moment, so she can (c) tailor teaching to support students’ understanding.
Students also depict the class as a low-stakes, noncompetitive environment where they feel safe and even invited to make mistakes in order to learn. One student observed that the professor “always encourages students to try and make mistakes rather than not try at all,” and another praised the value of multiple attempts and “reviewing my wrong answers.” This safety is cultivated by the instructor’s helpful responses as described above, along with plenty of in-class practice and other low-stakes activities that, as students recognize, “allowed me to learn from my mistakes” (e.g., the use of Excel described in Sections 3.1 and 4.2.2). One student criticized the instructor for “forgiving students” when they make such “silly little mistakes” by “giving students points back for rounding errors,” perhaps because a more competitive environment is more typical in many classrooms. Here, students instead describe a course in which they’re all supported and able to do well with “an equal opportunity to learn and participate,” rather than competing for grades or the professor’s favor. One student describes this lack of competition as “the course is structured so that if you try your best and want to succeed, you will.” Students also allude to this characteristic when they describe the experiences of “all of her students,” “all students,” and “everyone,” rather than just “me”—as in when they praise her support for “every single student that might need her help” or “Really tries to make sure everyone understands,” rather than just “effectively help[ing] me with whatever it is I need,” “I felt comfortable asking any question,” or the pronoun-less “always open to questions.”
An extension of this trait is the instructor’s assurances that she wants them to learn and to succeed, and that they can learn and succeed. In fact, the language of “wanting all of her students to succeed” occurred 12 times in these comments. Students also elaborated, such as “The professor was extremely dedicated to making sure we understood all the material” and “she always sticks to what is best for her students.” Part of this specific kind of support is implied in the comments, “she does everything she can to make sure that students succeed” and “she wants to see them succeed, and she is willing to help get them there.” Contrary to the more cynical characterization of “hand-holding,” this commitment to student success is evident in actions like “remind[ing] people about homework and quiz deadlines,” “communicat[ing] new assignments and when they are due, and giv[ing] updates on progress,” and “posting everything on canvas so everyone could benefit.” Ultimately, as another student explained, she “allowed students to feel as though they could handle whatever the course threw at them because they knew their teacher was with them and not against them.” These students felt supported by an instructor who believes they can do well in this challenging course. They see her confidence in them. In fact, this learning environment is also reminiscent of the “wise” approach of using “strategies that convey to students that they will neither be treated nor judged in light of a negative stereotype but will instead be respected as an individual” (Yeager et al. Citation2014, p. 805). Wise strategies, including “wise feedback,” focus on communicating both high expectations and the belief that students can meet those expectations, and have demonstrated to mitigate stereotype threat (Cohen, Steele, and Ross Citation1999; Yeager et al. Citation2014).
4.2.4 A New Attitude toward Statistics
Finally, quite a few students expressed a new attitude toward statistics: “This course was very helpful in teaching me about real life stats,” “I feel the course taught me a lot more about statistics than I knew,” “I know a huge amount more about Statistics than I ever did before and I have learnt to like it so much that I am now exploring a minor in it,” “Through this class, I was able to understand the importance of statistics in the business world and make decisions too,” “really made stats tolerable, lol,” and “the whole thing just made sense.” The data analyzed are provided in Appendix B: course and Instructor Evaluations.
5 Conclusion and Implications for Teaching
Traditional teaching methods in statistics are a unidirectional didactic approach with the primary goal of getting the content delivered from instructors to students. Such a passive method has been criticized, as learning is not optimal and can be ineffective in illustrating the connection between statistics and real-world applications. Many students perceive learning statistics as difficult and intimidating. This is especially true for nonspecialist students, many of whom enroll in a statistics course geared up with emotional presumptions about their inherent incompetence to do well. Such preconceptions can become barriers to their learning in a cycle of self-doubt and diminished performance.
This study discussed the existing challenges in statistics education as well as the extended challenges due to the disruption caused by the Covid-19 pandemic. This study proposed an instruction model to interactively teach Business Statistics courses that has proven to be effective during the pandemic disruption. The instruction model was implemented in face-to-face (F2F) learning as well as online learning and allowed students to be engaged irrespective of the instruction mode. The model aimed to include the students in the learning process and sought to alleviate the intimidation students might feel when learning statistics.
Data suggest that students’ perception of instruction and engagement in the learning process was bolstered by the TSI model and shows that there was no discernible difference in overall course evaluation ratings in Fall 2020 during dual-mode instruction and Fall 2019 during fully face-to-face instruction.
The positive feedback and comments from students in the course evaluations where they explicitly mentioned how challenging the course was and how they appreciated the engaging use of Microsoft Excel as well as being part of a positive learning environment cultivated by a supportive instructor that led to a new attitude toward statistics, can be seen as proof of the success of the TSI model discussed in this study. The results of this study can be used to explain the importance of the interventions to other statistics instructors and how to apply them.
The nature of implications for teaching and future research will not be focused on whether to include computing in the curriculum and the use of interactive technology in teaching and engaging students, but rather how to proceed intentionally and effectively through meaningful technology integration in order to accomplish goals. The approaches discussed in this article outline opportunities to bring in authentic examples and conversations from previous iterations of courses into future courses. One of the affordances of this TSI model involves easy access and future reference to authentic examples and conversations in one iteration of a course into future sections and offerings of courses. Not only would such intentional approaches provide enrichment of learning opportunities, furthermore such actions would enhance continuity in courses across time and place.
A key implication for teaching would be to integrate such interactive instruction models into research-informed teaching practices and contribute to frameworks that include student centered instruction enhanced by intentional technology integration. One logical connection would be to connect research stemming from this model to the Technological Pedagogical Content Knowledge (TPACK) Framework (Koehler and Mishra Citation2009). Specifically, in future studies and research-informed teaching efforts it would be beneficial to explore possible links between the TSI model to the ways that the TPACK framework has been used to teach and learn statistics primarily with preservice and in-service teachers. Additionally, multiple disciplines would benefit from further explication of the ways in which the TSI model might benefit when/how student engagement can be fostered through technology integration while developing content knowledge in the areas of mathematics and statistics.
Opportunities for collaboration by students and instructors within and across institutions through interactive remote means suggest additional pathways in higher education. By using interactive instruction models, faculty members from multiple institutions could aggregate data to inform instructional decisions to modify and/or redesign the scope and sequence of topics in the course. Furthermore, tasks and/or resources that are found to be more engaging and effective in centering student learning experiences could be identified and then implemented. Through remote exchanges—synchronous as well as asynchronous collaborations—students could introduce and engage with realistic issues and problems impacting communities and people throughout their region and more broadly across the country and the globe. In this manner, instruction becomes more student-centered and inclusive of students rather than a potential top-down approach without the guidance and inclusion of student voice and interests. It would be beneficial to further study the potential impact of the TSI model in affecting student attitudes and beliefs regarding statistics and/or STEM disciplines.
All too often and particularly in STEM disciplines, students only engage in instruction by submitting work usually using strict mathematical/statistical convention. One promise and area of future research could entail the ways in which students can be effectively engaging in rich discussion of topics through communication that takes some combination of written, drawn, verbal, contextual, graphical, as well as video-recordings. Not only would faculty members gain additional insights into student thinking through this purposeful multi-representational discourse leveraging an interactive instruction model, moreover, students who are growing in areas of language, writing skills, etc. can play a vital role in learning and contributing to the learning of other students.
6 Research Limitations and Areas for Future Research
Although this research focused on the use of Microsoft Excel, research has shown that using other software packages can have a positive impact on learning. Therefore, the “technology” component of the TSI model can be flexible and extendable to include other well-designed lessons, where a dataset is assigned using any statistical software package, including but not limited to: SAS JMP, Minitab, R, Stata and SPSS. An area for future research could entail the intentional technology integration with software packages and/or technological tools that value student engagement in different forms (written, spoken, drawn, gestured, etc.) while simultaneously more visible and also measurable using quantitative as well as qualitative data analysis. A potential limitation of the current research involves the reliance on the use of a single software (Microsoft Excel). Although Microsoft Excel has limitations when it comes to multi-user collaboration, dealing with large datasets and its incapability to support multivariate analysis, its ease of use, being available for free for students and educators at the institution through Office 365 Education and the availability of Excel-based assignments and videos made it useful and preferable for the proposed TSI model. In addition, working with Excel allowed students to focus on engagement with the context and the implications of calculations rather than merely the act of calculations. The intentional focus on engaging students through the integration of technology is consistent with the recommendations of national organizations such as the National Council of Teachers of Mathematics (NCTM) and their related position statements. In 2023, in the position statement titled Equitable Integration of Technology for Mathematics Learning, the recommendation is the call to “develop systems of reflective practice to support educators as they plan for and use technology in their instruction” (NCTM Citation2023). Moving forward, this effort lays the foundation for future research to connect to and extend present efforts to support technology-enhanced instructional approaches. In addition to Microsoft Excel, future research can employ other software packages like SAS JMP, Minitab, R, Stata and SPSS to conduct analysis that requires on large datasets and support multivariate thinking and analysis
Furthermore, it may be difficult to ascertain the various effective pedagogical moves by the instructor of the course that may have also contributed to the effectiveness of the TSI model. As oftentimes supporting and engaging students may rely on the rapport and interpersonal skills of the instructor and with one instructor, it is difficult to juxtapose the model across instructors with similar student populations at the same institution.
Future research can also focus on how other courses, instructors and universities are using the TSI model and assess the benefits of adopting other software packages in teaching as well as comparing the results of using different packages. Although this model has been implemented in one course, the model can be extended to other statistics courses in different majors as well as different universities and different students (undergraduate and. graduate). Additionally, given the opportunities to co-teach courses across campuses and collaboratively across institutions, it would be quite interesting to see how the TSI model could contribute to student engagement efforts in such inter- and intra-institutional teaching efforts.
Future research can also address how the TSI model can be implemented in different class formats and sizes. For instance, in what ways does the TSI model engage students in smaller seminar type classes, classes that are discussion based, as well as classes that may be taught virtually and/or in a mixed mode (hybrid) format with different number of students. The current study sets the stage nicely for areas for future research within these different class formats as well as different class sizes. The successful implementation of the model in this article was based on having a significant in-person interaction with students of around 50% of the classes being face-to-face, although a fully online format could be done if instructors make time to meet with students outside class time to ensure that she/he is providing on-going, supportive and intentional feedback.
Supplementary Materials
The supplementary materials include 1) Representative student comments organized by learning environment traits (Appendix A) and 2) Course and instructor evaluations (Appendix B).
JSDSE-2021-0076.R2_Online_Supplement.zip
Download Zip (704.1 KB)Data Availability Statement
Data analyzed in this article have been uploaded on OSR.io and can be accessed at: https://osf.io/scwpq/?view_only=8a0d712037494039b7b769e8c3c82e02
Disclosure Statement
No potential conflict of interest was reported by the author(s).
References
- Abdullah Omer, A. A. (2021), “The Early Milestones of Team-Based Learning: The Key is Sustained Practice,” Sudan Journal of Medical Sciences, 16, 454–474. DOI: 10.18502/sjms.v16i3.9704.
- Abrams, F. (2012), “Cultural Literacy: Michael Gove’s School of Hard Facts,” available at https://www.bbc.com/news/education-20041597.
- Agarwal, P. K., and Bain, P. M. (2019), Powerful Teaching: Unleash the Science of Learning, San Francisco: Jossey-Bass.
- Al-Haddad, S., O’Neal, T., Batarseh, I., and Martoncik, A. (2021), “Enabling Academic Entrepreneurship: The I-Corps Experience,” Education + Training, 63, 1027–1042. DOI: 10.1108/ET-03-2019-0045.
- Al-Haddad, S., and Kodzi, E. (2021), “Using Technology in Teaching Business Statistics for Active Learning and Engagement [Virtual Conference Presentation],” in 2021 Annual Sunshine State Conference, January 22.
- Al-Haddad, S., Thorne, B., Ahmed, V., and Sause, W. (2019), “Teaching Information Technology Alongside Business Analytics: Case Study,” Journal of Education for Business, 94, 92–100. DOI: 10.1080/08832323.2018.1507987.
- Aliaga, M., Cobb, G., Cuff, C., Garfield, J., Gould, R., Lock, R., Moore, M., Rossman, A., Stephenson, B., Utts, J., Velleman, P., and Witmer, J. (2005), “Guidelines for Assessment and Instruction in Statistics Education (GAISE) College Report 2005.” Available at https://www.amstat.org/education/guidelines-for-assessment-and-instruction-in-statistics-education-(gaise)-reports
- Angelo, T., and Cross, P. (1993), Classroom Assessment Techniques: A Handbook for College Teachers (2nd ed.), San Francisco, CA: Jossey-Bass.
- Bargagliotti, A., Franklin, C., Arnold, P., Gould, R., Johnson, S., Perez, L., and Spangler, D. A. (2020), “Pre-K–12 Guidelines for Assessment and Instruction in Statistics Education II (GAISE II): A Framework for Statistics and Data Science Education”, American Statistical Association, available at https://www.amstat.org/asa/education/Guidelines-for-Assessment-and-Instruction-in-StatisticsEducation-Reports.aspx
- Barkley, E., and Major, C. (2018), Interactive Lecturing: A Handbook for College Faculty, San Francisco, CA: Jossey-Bass.
- Berry, R. Q., III, and Larson, M. R. (2019), “The Need to Catalyze Change in High School Mathematics,” Phi Delta Kappan, 100, 39–44. DOI: 10.1177/0031721719834027.
- Biehler, R. O. L. F., Frischemeier, D., and Podworny, S. (2017), “Elementary Preservice Teachers’ Reasoning about Modeling a ‘Family Factory’ with TINKERPLOTS–a Pilot Study,” Statistics Education Research Journal, 16, 244–286. DOI: 10.52041/serj.v16i2.192.
- Bligh, D. (1999), What’s the Use of Lectures? Exeter, England: Intellect Press.
- Bransford, J., Brown, A., and Cocking, R. (2000), How People Learn: Brain, Mind, and Experience, Washington, DC: National Academy Press.
- Brock, C. (2013), Education and Natural Disasters, London: Bloomsbury.
- Bruff, D. (2019), Intentional Tech: Principles to Guide the Use of Educational Technology in College Teaching, Morgantown, WV: West Virginia University Press.
- Burckhardt, P., Nugent, R., and Genovese, C. (2021), “Teaching Statistical Concepts and Modern Data Analysis with a Computing-Integrated Learning Environment,” Journal of Statistics and Data Science Education, 29, S61–S73. DOI: 10.1080/10691898.2020.1854637.
- Camm, J. D., Cochran, J. J., Fry, M. J., Ohlmann, J. W., and Anderson, D. R. (2016), Essentials of Business Analytics, Boston, MA: Cengage Learning.
- Carver, R., Everson, M., Gabrosek, J., Horton, N., Lock, R., Mocko, M., Rossman, A., Roswell, G. H., Velleman, P., Witmer, J., and Wood, B. (2016), Guidelines for Assessment and Instruction in Statistics Education (GAISE) College Report 2016.
- Cavanagh, S. (2016), The Spark of Learning: Energizing the College Classroom with the Science of Motion (1st ed.), Morgantown, WV: West Virginia University Press.
- Cerbin, W. (2018), “Improving Student Learning from Lectures,” Scholarship of Teaching and Learning in Psychology, 4, 151–163. DOI: 10.1037/stl0000113.
- Charalambous, M., Hodge, J. A., and Ippolito, K. (2021), “Statistically Significant Learning Experiences: Towards Building Self-Efficacy of Undergraduate Statistics Learners through Team-Based Learning,” Educational Action Research, 29, 226–244. DOI: 10.1080/09650792.2020.1782240.
- Chick, N. L., and Felten, P. (2020), “Slow: Liberal Learning for and in a Fast-Paced World,” in Redesigning Liberal Education: Innovative Design for a Twenty-First Century Undergraduate Education, eds. W. Moner, P. Motley, and R. Pope-Ruark, 254–265, Baltimore, MD: Johns Hopkins UP, available at https://www.press.jhu.edu/books/title/12175/redesigning-liberal-education
- Clair, K. S., and Chihara, L. (2012), “Team-Based Learning in a Statistical Literacy Class,” Journal of Statistics Education, 20, 1–21. DOI: 10.1080/10691898.2012.11889633.
- Cohen, G. L., Steele, C. M., and Ross, L. D. (1999), “The Mentor’s Dilemma: Providing Critical Feedback across the Racial Divide,” Personality and Social Psychology Bulletin, 25, 1302–1318. DOI: 10.1177/0146167299258011.
- Cohen, L., and Steele, C. (2002), “A Barrier of Mistrust: How Stereotypes Affect Cross-Race Mentoring,” in Improving Academic Achievement: Impact of Psychological Factors on Education, ed. J. Aronson, pp. 305–331, Oxford, England: Academic Press.
- Courville, K. (2011), “Technology And Its Use in Education: Present Roles And Future Prospects,” available at https://files.eric.ed.gov/fulltext/ED520220.pdf
- Davis, S. (2003), “Statistics Anxiety among Female African American Graduate-Level Social Work Students,” Journal of Teaching in Social Work, 23, 143–158. DOI: 10.1300/J067v23n03_12.
- Donnelly, R. (2020), Business Statistics (3rd ed), London: Pearson Higher Ed.
- Edgerton, R. (2001), “Education White Paper,” Pew Forum on Undergraduate Learning, Washington, DC: Pew Charitable Trusts.
- Elrod, H., Pittman, K., Norris, J., and Tiggeman, T. (2015), “Excel Training and the Technology Student Learning Outcome,” Academy of Educational Leadership Journal, 19, 43–49.
- Evans, S. R., Wang, R., Yeh, T., Anderson, J., Haija, R., McBratney-Owen, P., Peeples, L., Sinha, S., Xanthakis, V., Rajicic, N., and Zhang, J. (2007), “Evaluation of Distance Learning in an Introduction to Biostatistics Class: A Case Study,” Statistics Education Research Journal, 6, 59–77. DOI: 10.52041/serj.v6i2.484.
- Eyler, J. (2018), How Humans Learn: The Science and Stories behind Effective College Teaching, Morgantown, WV: West Virginia University Press.
- Farmus, L., Cribbie, R., and Rotondi, M. (2020), “The Flipped Classroom in Introductory Statistics: Early Evidence from a Systematic Review and Meta-Analysis,” Journal of Statistics Education, 28, 316–325. DOI: 10.1080/10691898.2020.1834475.
- Fernando, H., and Karunaratne, S. (2012), “Teaching an Undergraduate Statistics Class with Technology,” in International Conference on Technology in Collegiate Mathematics (ICTCM).
- Fitzallen, N. (2007), “Evaluating Data Analysis Software: The Case of Tinkerplots,” Australian Primary Mathematics Classroom, 12, 23–28.
- Fleck-Henderson, A., and Melendez, M. (2009), “Conversation and Conflict: Supporting Authentic Dialogue in the Classroom,” Journal of Teaching in Social Work, 29, 32–46. DOI: 10.1080/08841230802212752.
- Gal, I. (2002), “Adults’ Statistical Literacy: Meaning, Components, Responsibilities,” International Statistical Review/Revue Internationale de Statistique, 70, 1–25. DOI: 10.2307/1403713.
- González, A., Rodríguez, Y., Faílde, J. M., and Carrera, M. V. (2016), “Anxiety in the Statistics Class: Structural Relations with Self-Concept, Intrinsic Value, and Engagement in Two Samples of Undergraduates,” Learning and Individual Differences, 45, 214–221. DOI: 10.1016/j.lindif.2015.12.019.
- Jasi, A. (2021), “Carry on Teaching: Higher Education during a Pandemic,” TCE: The Chemical Engineer, 958, 18–23.
- Kalaian, S. A., and Kasim, R. M. (2014), “A Meta-Analytic Review of Studies of the Effectiveness of Small-Group Learning Methods on Statistics Achievement,” Journal of Statistics Education, 22, 1–20. DOI: 10.1080/10691898.2014.11889691.
- Koehler, M., and Mishra, P. (2009), “What is Technological Pedagogical Content Knowledge (TPACK)?” Contemporary Issues in Technology and Teacher Education, 9, 60–70.
- Kubek, J. B., Tindall-Biggins, C., Reed, K., Carr, L. E., and Fenning, P. A. (2020), “A Systematic Literature Review of School Reentry Practices among Youth Impacted by Juvenile Justice,” Children and Youth Services Review, 110, 104773. DOI: 10.1016/j.childyouth.2020.104773.
- Kurtz, B. (2019), “The AfterMath: A Culturally Responsive Mathematical Intervention to Aid Students Affected by Natural Disasters” [online], 1, 8, available at https://stars.library.ucf.edu/etd/6723/.
- Lang, J. (2016), Small Teaching: Everyday Lessons from the Science of Learning, San Francisco, CA: Jossey-Bass.
- Langer-Osuna, J. M. (2017), “Authority, Identity, and Collaborative Mathematics,” Journal for Research in Mathematics Education, 48, 237–247. DOI: 10.5951/jresematheduc.48.3.0237.
- Lee, H., and Hollebrands, K. (2008), “Preparing to Teach Mathematics with Technology: An Integrated Approach to Developing Technological Pedagogical Content Knowledge,” Contemporary Issues in Technology and Teacher Education, 8, 326–341.
- Lu, F., and Lemonde, M. (2012), “A Comparison of Online versus Face-to-Face Teaching Delivery in Statistics Instruction for Undergraduate Health Science Students,” Advances in Health Sciences Education: Theory and Practice, 18, 963–973. DOI: 10.1007/s10459-012-9435-3.
- Mazur, E., and Somers, M. (1999), “Peer Instruction: A User’s Manual,” American Journal of Physics, 67, 359–360. DOI: 10.1119/1.19265.
- McNamara, A. A. (2015), “Bridging the Gap Between Tools for Learning and for Doing Statistics,” UCLA Electronic Theses and Dissertations. UCLA, available at https://escholarship.org/content/qt1mm9303x/qt1mm9303x.pdf
- McWilliam, E. (2015), “Teaching Gen Z,” available at https://www.ericamcwilliam.com.au/teaching-gen-z/
- National Council of Teachers of Mathematics (NCTM). (2018), “Catalyzing Change in High School Mathematics: Initiating Critical Conversations.”
- National Council of Teachers of Mathematics (NCTM). (2023), “A Position of the NCTM: Equitable Integration of Technology for Mathematics Learning,” https://www.nctm.org/Standards-and-Positions/Position-Statements/Equitable-Integration-of-Technology-for-Mathematics-Learning-2146929355/
- Niess, M. L. (2005), “Preparing Teachers to Teach Science and Mathematics with Technology: Developing a Technology Pedagogical Content Knowledge,” Teaching and Teacher Education, 21, 509–523. DOI: 10.1016/j.tate.2005.03.006.
- Niess, M. L. (2011), “Investigating TPACK: Knowledge Growth in Teaching with Technology,” Journal of Educational Computing Research, 44, 299–317. DOI: 10.2190/EC.44.3.c.
- Niess, M. L., Ronau, R. N., Shafer, K. G., Driskell, S. O., Harper, S. R., Johnston, C., Browning, C., Özgün-Koca, S. A., and Kersaint, G. (2009), “Mathematics Teacher TPACK Standards and Development Model,” Contemporary Issues in Technology and Teacher Education, 9, 4–24.
- Nolan, D., and Temple Lang, D. (2010), “Computing in the Statistics Curricula,” The American Statistician, 64, 97–107. DOI: 10.1198/tast.2010.09132.
- Olafusi, M. (2016), Microsoft Excel and Business Data Analysis for the Busy Professional, North Charleston, SC: CreateSpace Independent Pub.
- Onwuegbuzie, A. J., DaRos, D., and Ryan, J. (1997), “The Components of Statistics Anxiety: A Phenomenological Study,” Focus on Learning Problems in Mathematics, 19, 11–35. DOI: 10.1016/S0740-8188(97)90003-7.
- Paul, A. (2015), “Are College Lectures Unfair?” New York Times, available at https://www.nytimes.com/2015/09/13/opinion/sunday/are-college-lectures-unfair.html
- Rakes, C. R., Stites, M. L., Ronau, R. N., Bush, S. B., Fisher, M. H., Safi, F., Desai, S., Schmidt, A., Andreasen, J. B., Saderholm, J., Amick, L., Mohr-Schroeder, M. J., and Viera, J. (2022), “Teaching Mathematics with Technology: TPACK and Effective Teaching Practices,” Education Sciences, 12, 133. DOI: 10.3390/educsci12020133.
- Rakoczy, K., Pinger, P., Hochweber, J., Klieme, E., Schütze, B., and Besser, M. (2019), “Formative Assessment in Mathematics: Mediated by Feedback’s Perceived Usefulness and Students’ Self-Efficacy,” Learning and Instruction, 60, 154–165. DOI: 10.1016/j.learninstruc.2018.01.004.
- Reyneke, F., Fletcher, L., and Harding, A. (2021), “Enhancing a Flipped Statistics First Year Course by Using QT-Clickers,” Journal of Statistics and Data Science Education, 29, 71–83. DOI: 10.1080/10691898.2021.1895694.
- Rosenbaum, J. (2020), “Educational and Criminal Justice Outcomes 12 Years after School Suspension,” Youth & Society, 52, 515–547. DOI: 10.1177/0044118X17752208.
- Rothman, D. (2014), “A Tsunami of Learners Called Generation Z,” available at https://mdle.net/Journal/A_Tsunami_of_Learners_Called_Generation_Z.pdf
- Roy, G. J., Bush, S. B., Hodges, T. E., and Safi, F. (2017), “Mathematics Discussions: Expectations Matter,” Mathematics Teaching in the Middle School, 23, 98–105. DOI: 10.5951/mathteacmiddscho.23.2.0098.
- Rubin, A. (2007), “Much Has Changed; Little Has Changed: Revisiting the Role of Technology in Statistics Education 1992-2007,” Technology Innovations in Statistics Education, 1, 1–34. DOI: 10.5070/T511000027.
- Safi, F., Wenzel, T., and Spalding, L. A. T. (2020), “Remote Learning Community: Supporting Teacher Educators during Unprecedented Times,” Journal of Technology and Teacher Education, 28, 211–222.
- Segesten, A. D. (2012), “Death of the Lecture,” Inside Higher Education, available at https://www.insidehighered.com/blogs/university-venus/death-lecture
- Sharpe, N., De Veaux, R., and Velleman, P. (2014), Business Statistics (3rd ed.), London: Pearson Higher Ed.
- Smith, A., and Martinez-Moyano, I. (2012), “Techniques in Teaching Statistics: Linking Research Production and Research Use,” Journal of Public Affairs Education, 18, 107–136. DOI: 10.1080/15236803.2012.12001674.
- Soesmanto, T., and Bonner, S. (2019), “Dual Mode Delivery in an Introductory Statistics Course: Design and Evaluation,” Journal of Statistics Education, 27, 90–98. DOI: 10.1080/10691898.2019.1608874.
- Steele, C. M. (2010), Whistling Vivaldi: How Stereotypes Affect Us and What We Can Do, New York: W W Norton & Co.
- Steele, C., and Aronson, J. (1995), “Stereotype Threat and the Intellectual Test Performance of African Americans,” Journal of Personality and Social Psychology, 69, 797–811. DOI: 10.1037/0022-3514.69.5.797.
- Su, F. (2020), Mathematics for Human Flourishing, New Haven, CT: Yale University Press.
- Swanson, E., McCulley, L. V., Osman, D. J., Scammacca Lewis, N., and Solis, M. (2019), “The Effect of Team-Based Learning on Content Knowledge: A Meta-Analysis,” Active Learning in Higher Education, 20, 39–50. DOI: 10.1177/1469787417731201.
- Vasilakos, K. (2021), “Exploring Live Coding as Performance Practice,” Porte Akademik: Journal of Music & Dance Studies, 21, 21–37.
- Wallman, K. K. (1993), “Enhancing Statistical Literacy: Enriching Our Society,” Journal of the American Statistical Association, 88, 1–8. DOI: 10.2307/2290686.
- Warstat, S., and Proemmel, A. (2020), “Effects of Alternative Treatments—an EDA Team Project in High Schools,” Teaching Statistics, 42, 93–97. DOI: 10.1111/test.12232.
- Yang, Y., Lee, C., and Chang, C. (2016), “Learning Motivation and Retention Effects of Pair Programming in Data Structures Courses,” Education for Information, 32, 249–267. DOI: 10.3233/EFI-160976.
- Yeager, D., Henderson, M., Paunesku, D., Walton, G., D’Mello, S., Spitzer, B., and Duckworth, A. (2014), “Boring but Important: A Self-Transcendent Purpose for Learning Fosters Academic Self-Regulation,” Journal of Personality and Social Psychology, 107, 559–580. DOI: 10.1037/a0037637.
- Yilmaz, M. (1996), “The Challenge of Teaching Statistics to Non-Specialists,” Journal of Statistics Education, 4, 107–136.
- Yilmaz, Z. (2013), “Usage of Tinker Plots to Address and Remediate 6th Grade Students’ Misconceptions about Mean and Median” [Abstract],” The Anthropologist, 16, 21–29. DOI: 10.1080/09720073.2013.11891332.