
Figures & data
Table 1. Conceptual framework for trauma-informed yoga intervention (Cook-Cottone, Talebkhah, et al., Citation2017).
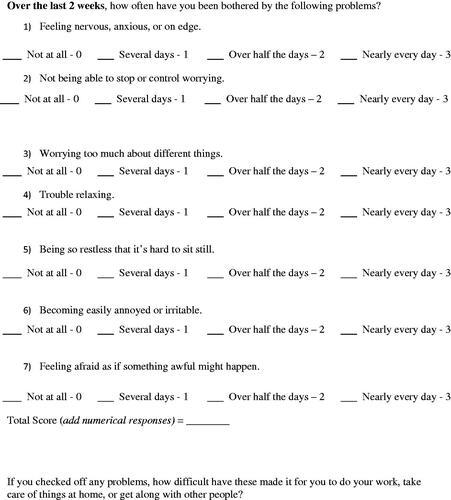
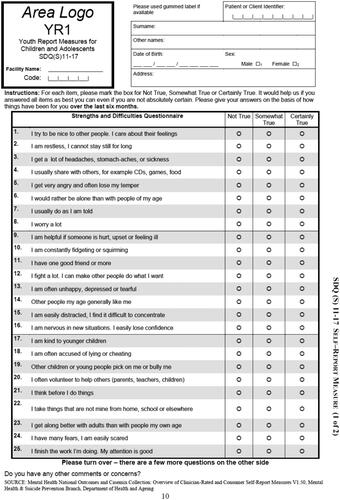
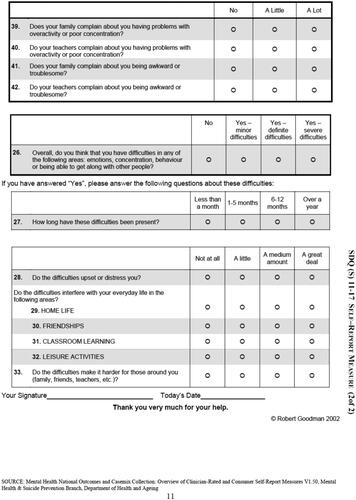
Table 2. Assessment measures.
Table 3. Descriptive statistics of sample (n = 16), pre-yoga intervention (T1).
Figure 1. GAD-7 simple difference plot. Note. Points below the blue line indicate observations where baseline was greater than post-intervention, that is where (post—pre) is negative.
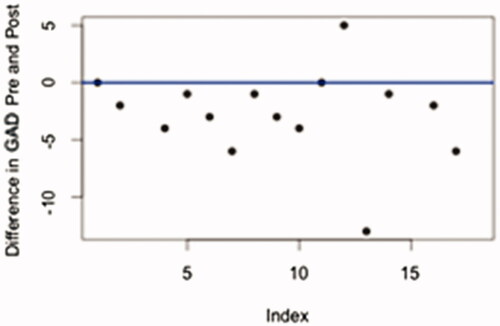
Figure 2. SDQ overall simple difference plot. Note. Points below the blue line indicate observations where baseline was greater than post-intervention, that is where (post—pre) is negative.
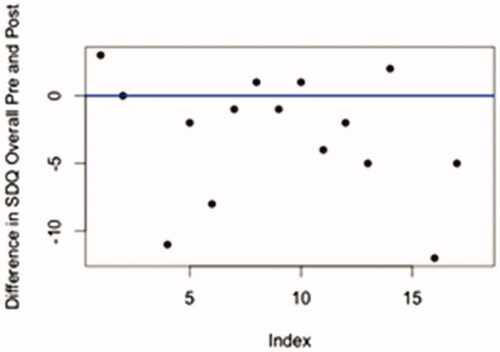
Table 4. Pre/post difference in means for outcomes.
Figure 3. Pre/mid-intervention difference plot in means for salivary cortisol levels.
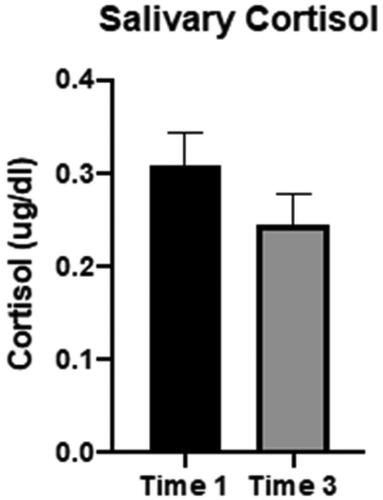
Table 5. Pre/mid-intervention difference in means for salivary cortisol (salivary cortisol levels (ug/dL).
Table 6. Pre/mid-intervention difference in means for previous night’s sleep duration.
Table 7. Sample student survey responses.
Data availability statement
Due to the nature of this research, participants of this study did not agree for their data to be shared publicly, so supporting data is not available.